In additive manufacturing (AM), numerous thermal cycles make stress relaxation a significant factor in affecting the material mechanical response. However, the traditional material constitutive model cannot describe repeated annealing behavior. Here, we propose an improved constitutive model based on a serial of stress relaxation experiments, which can descript the temperature and time-dependent stress relaxation behavior during AM. By using the proposed relaxation model, the prediction accuracy is significantly improved due to the recovery of inelastic strain during multilayer deposition. The results are validated by both in-situ and final distortion measurements. The influence mechanism of the relaxation behavior on material mechanical response is explained by the three-bar model in thermo-elastic-plastic theory. The relaxation behavior during the whole AM process is clarified. The stress behavior is found to have a limited effect when merely depositing several layers; nevertheless, it becomes a prominent impact when depositing multiple layers. The proposed model can enhance modeling accuracy both in AM and in multilayer welding.
Ruishan Xie, Qingyu Shi, Gaoqiang Chen. Improved distortion prediction in additive manufacturing using an experimental-based stress relaxation model. Journal of Materials Science & Technology[J], 2020, 59(0): 83-91 DOI:10.1016/j.jmst.2020.04.056
1. Introduction
Metal additive manufacturing (AM) is a promising processing technology with great potential to fabricate complex components in many industrial fields. However, thermal deformation is inevitable due to repeated and extremely transient thermal cycles in the process of manufacturing [1]. The thermal stresses and distortion would seriously affect part dimensional accuracy, and have become the essential problems when fabricating large scale components [2]. It is difficult to investigate the complex thermo-mechanical process by experimental approaches, though there is a great potential of in-situ monitoring techniques [[3], [4], [5]]. In comparison, finite element modeling becomes an available and economical approach to understand the basic thermo-mechanical behavior and to predict the part distortion. To this end, several thermal-mechanical models have been successfully employed to predict the part distortion in AM.
Since AM can be thought of as a continually multi-layer and multi-bead welding process on the top of the substrate, most of the models in AM showed great similarity to that in computational weld mechanics (CWM) [[6], [7], [8], [9]]. For example, Cao et al. [10] employed the fully coupled thermo-mechanical model to predict distortion in the electron beam AM process. Yang el at [11]. proposed a three-dimensional sequentially coupled thermo-elastic-plastic model to predict residual distortion in the laser-engineered net-shaping process. Mukherjee et al. [12] improved the modeling accuracy of transient temperature by using the heat transfer and fluid flow model. In addition, some reduced order method and simplification strategies were also employed in AM to improve modeling efficiencies, such as the inherent strain method [13], equivalent temperature field method [14], and adaptive meshing technique [15].
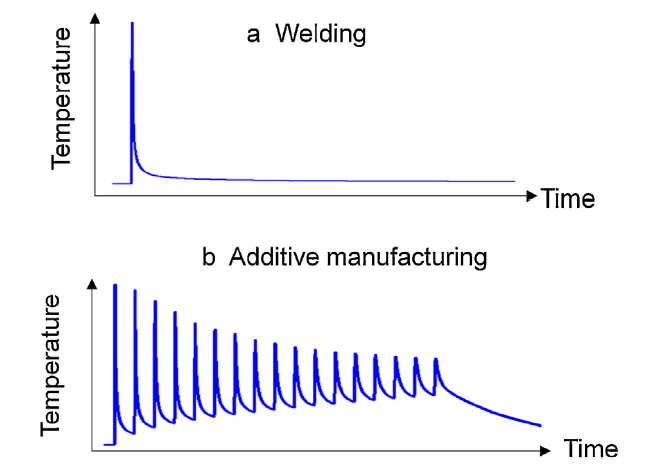
Though the significant similarities between AM and welding, AM has its own process characteristics. As shown in Fig. 1(a), only one heating-cooling cycle exists during welding and thus the material has a short dwell time at high temperatures. However, that is not the case for AM, which involves multiple thermal cycles to build a practical component, as shown in Fig. 1(b). The early deposited material will experience repeated heating-cooling thermal cycles in the subsequent deposition course. Considering the time accumulation effect during the periodical multilayer depositing process, it is unavoidable for the deposited material to be subjected to high temperatures for a relatively long time. Many experimental studies indicate that when the material is subjected to high temperature and stress, the stress relaxation behavior takes place [16,17]. Thus, it is reasonable that the thermal relaxation behavior can be neglected during welding [18], however, such behavior can be a significant factor in affecting the mechanical behavior of the material during AM.
Fig. 1.
Schematic of the thermal cycles during welding (a), and additive manufacturing (b).
Some researchers have realized the importance of material mechanical behavior to the modeling accuracy in multilayer welding and AM process. Zhang et al. [19] proposed a history-dependent material mechanical model for cold work hardening aluminum alloy. They indicated the enhanced accuracy of the predicted distortion by using the history-dependent model in welding [6,19]. Qiao et al. [20] proposed a dynamic strain hardening recovery model for stainless steel to improve the modeling accuracy in the multilayer welding process. Denlinger et al. [21] proposed an instantaneous relaxation model for Ti-6Al-4 V in directed energy deposition when the temperature exceeded a temperature, which was calibrated and artificially set to 690 °C to provide a correlation between the experimental measured and simulated distortion. The instantaneous annealing model was also applied by Lu et al. [22]. In their studies, the stress relaxation behavior was taken into consideration in the thermo-mechanical modeling by using an instantaneous model. However, the relaxation behavior in the actual AM process is a physically temperature dependent and gradual process [17], which is more suitably described by a gradual relaxation model.
Here, we present a stress relaxation model of additive manufactured Ti6Al4V on the basis of experimental measurement. In addition, to verify the model, in-situ distortion measurement was conducted in the experiment of deposition. The distortion mechanism and the effect of relaxation on the distortion behavior in the entire manufacturing course are illustrated and analyzed.
2. Modeling and experimental method
2.1. Stress relaxation experiments
Here, the relaxation behavior can be described by a Norton-bailey model as follows:
where ${{\dot{\varepsilon }}_{\text{re}}} $is the relaxation strain rate, σ is equivalent to deviatoric stress. A and n are material constants, which have different values at different temperatures. The logarithm form of Eq. (2) is written by:
$\text{ln}\left( {{{\dot{\varepsilon }}}_{\text{re}}} \right)=\text{ln}\left( A \right)+n\text{ln}\left( \sigma \right)$
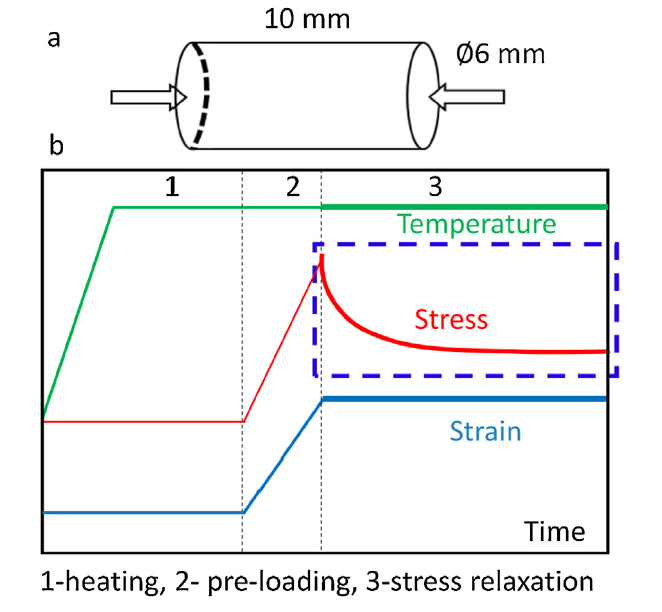
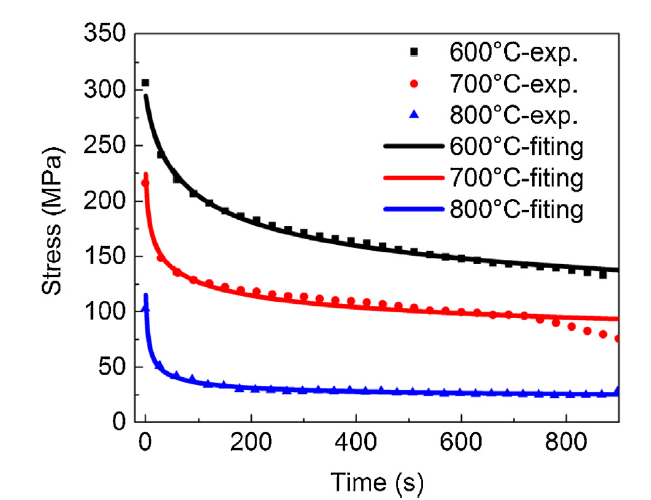
To obtain the values of A and n in Eq. (2), the relationship between $ ln {{\dot{\varepsilon }}_{\text{re}}} $ and ln(σ) will be established based on the stress relaxation test of the additive manufactured Ti6Al4V. Cylindrical specimens were prepared via wire electrical discharge machining from the laser additive manufactured part. The specimens have dimensions of 6 mm in diameter and 10 mm long, as shown in Fig. 2(a). A type K thermocouple was welded to the center of each specimen to measure the temperature. The stress relaxation test was carried out on a Gleeb 3500 thermal simulator with the following step: (1) heating the specimens to a certain temperature, (2) then compressing them to an engineering strain of 0.45 %, and (3) recording the stress with the temperature and strain keeping constant. The evolution histories of temperature, strain and stress are shown in Fig. 2(b). The stress relaxation tests were carried out at 600, 700 and 800 ℃, which are sensitive temperatures, according to the previous Refs. [20,21]. The stress relaxation data at different temperatures were obtained and shown in Fig. 3. The data were fitted with the following equation [17] using MATLAB:
$\sigma =a+b{{(t+c)}^{d}}$
where a, b, c and d are constants at the given temperature.
Fig. 2.
Schematic of the stress relaxation experiment: (a) the dimensions of samples, and (b) the evolution history of temperature-stress-strain during the experiment.
where${{\dot{\varepsilon }}_{\text{0}}}$is the total strain rate, ${{\dot{\varepsilon }}_{\text{e}}}$, ${{\dot{\varepsilon }}_{\text{re}}}$ and ${{\dot{\varepsilon }}_{\text{th}}}$ are the elastic strain rate, the relaxation strain rate, and the thermal strain rate, respectively. Both ${{\dot{\varepsilon }}_{\text{0}}}$ and ${{\dot{\varepsilon }}_{\text{th}}}$ equal to zero, since the total strain and temperature keep constant during the stress relaxation experiment. Thus, we have the equation as follows:
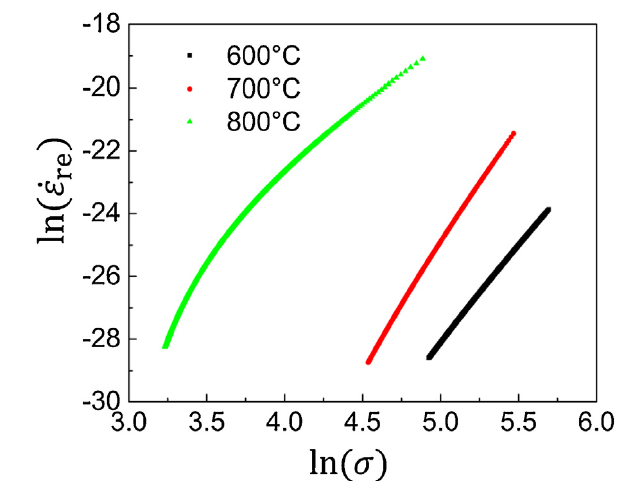
Combing Eqs. (2) and (6), ln(${{\dot{\varepsilon }}_{\text{cr}}}$) - ln(σ) curves are plotted at different temperatures and shown in Fig. 4. A and n are calculated from the slopes of and intercept of ln(${\dot{\varepsilon }}$)-ln(σ) curve, respectively, which are listed in Table 1. The values at temperatures beyond 600, 700 and 800 ℃ are determined by linear interpolation from the values at the given temperatures, as listed in Table 1. The values are assumed constant when the temperature is above 800 ℃, and assumed a small value when the temperature is below 600 ℃.
It should be noted that the relationship between ln${{\dot{\varepsilon }}_{\text{re}}}$ and ln(σ) is linear at 600 ℃ and 700 ℃, but not completely linear at 800 ℃. The reason can be attributed to the different annealing mechanisms at low and high temperatures. Recovery is the main mechanism at low temperatures, while recovery and recrystallization might occur simultaneously at high temperatures [23]. Here, the relationship between ln${{\dot{\varepsilon }}_{\text{re}}}$ and ln(σ) at 800 ℃ is simplified as linear for the preliminary attempt. The development of detailed models that include a more detailed description of the curve and the investigation on its influence on calculation results will be further studied in our future research.
2.2. AM modeling method
The sequentially coupled thermal-mechanical finite element analysis is employed using Abaqus in this study. The heat transfer analysis is conducted first to obtain the temperature field, which is then applied as the thermal load to the mechanical analysis. The energy governing equation for heat transfer analysis is described in our previous study [5].
The mechanical constitutive law is given as:
$\sigma =C \bullet {{\varepsilon }_{\text{e}}}$
where C is the elastic tensor. The total strain tensor ε is decomposed into four components:
where εe, εp, εth and εre are the elastic strain, plastic strain, thermal strain, and relaxation strain, respectively. The material is assumed to be perfect plastic with J2-von Mises plasticity law, due to the limited work hardening of Ti-6Al-4 V [24]. The relaxation strain is calculated using Eq. (1) with the incremental form. Temperature-dependent material properties of Ti-6Al-4 V, such as Young’s modulus, expansion coefficient, and yield stress are taken from the literature [25], and are listed in Table 2.
Table 2
Table 2Temperature-dependent material parameters [25].
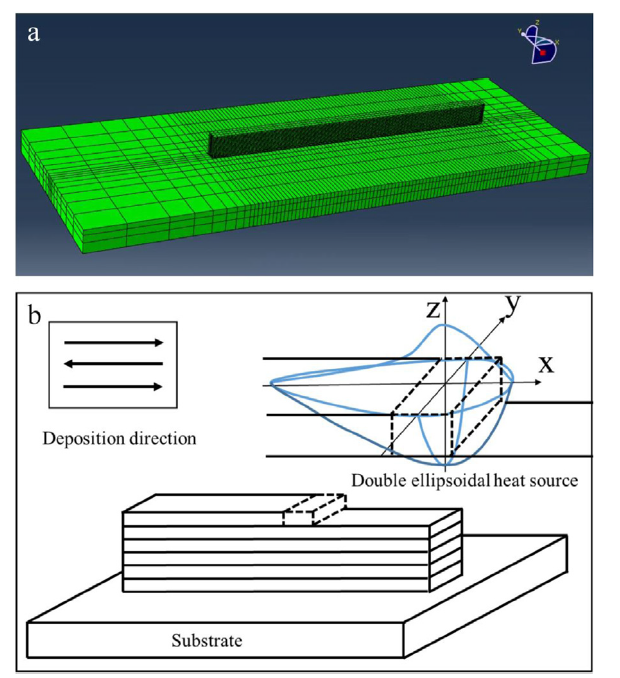
Fig. 5(a) shows the mesh of the domain, which is composed of 36, 992 hexahedral elements and 47,415 nodes, with a finer mesh for the deposition and the region nearby and a coarser mesh for the rest. The FE mesh consists of four elements to represent the laser spot size and one element through the layer thickness. The filler material is simulated using the “element birth technique”. All the elements of the deposition are deactivated at the first step of the analysis, and then the elements are activated sequentially following the heat source, as shown in Fig. 5(b).
Fig. 5.
Mesh of domain (a) and the moving heat source (b).
2.3. AM experiment and measurement
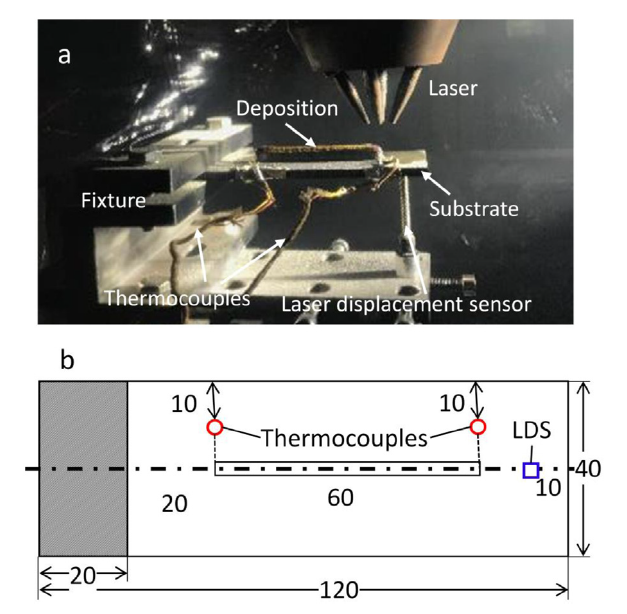
The AM experiment was performed using a CO2-laser with the power of 2000 W as the energy source. The major parameters are listed as follows: a beam diameter of 3 mm, a scanning speed of 10 mm/s, a powder feeding rate of 10 g/min. A thin-wall with a length of 80 mm and a width of 3 mm was fabricated on a Ti-6Al-4 V substrate with dimensions of 140 mm (length) ×50 mm (width) ×6 mm (height). The experimental set-up for in situ measurement during the deposition process is shown in Fig. 6(a). The substrate is clamped at the left end, allowing free deflection at the right side during the manufacturing process. The in-situ displacement of the free end was measured with a WXXY PM11-R1-20 L displacement sensor. Two thermocouples were bonded at the top surface of the substrate to monitor the temperature history, which were 15 mm from the deposition area, as shown in Fig. 6(b).
Fig. 6.
(a) Experimental set-up of in situ measurement during AM, and (b) locations of the measurement points at the substrate.
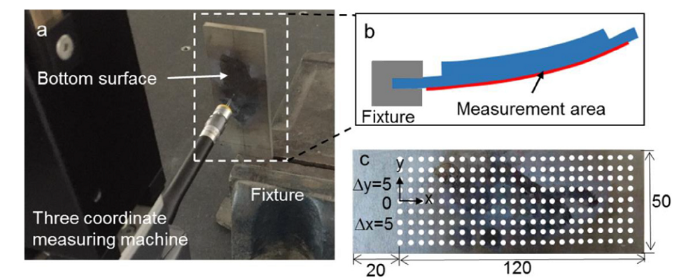
After deposition, the final distortion of the substrate was measured using a PC DMIS coordinate measuring machine, as shown in Fig. 7(a). The schematic diagram of the measurement area and the locations of the measurement points at the back of the substrate are shown in Fig. 7(b) and (c), respectively.
Fig. 7.
(a) Experimental set-up to measure the final distortion of the substrate. (b) Schematic diagram of the measurement area, and (c) locations of the measurement points at the substrate.
3. Results
3.1. Comparison of temperature history
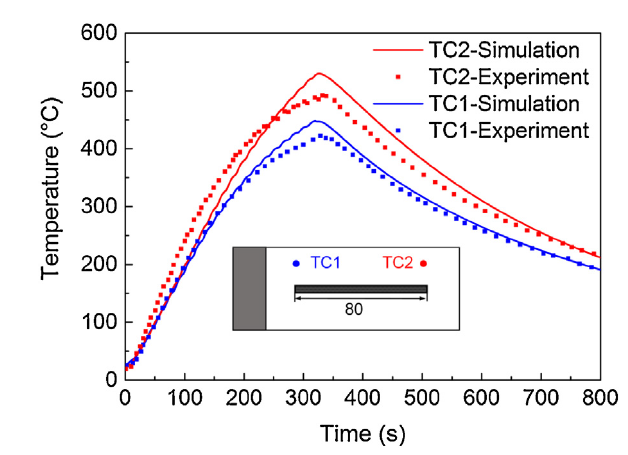
The comparison of temperature histories of the two points in the substrate between the simulation results and experimental measurements are shown in Fig. 8. The temperature of the substrate increases during the deposition because of the thermal accumulation. It is observed that the simulation results are in agreement with the experimental measurements for the two points. The difference of amplitudes between the simulation and the experimental for TC1 and TC2 is 6.18 % and 7.67 %, respectively. The difference might be caused by the complex convection of shielding gas flow is not considered. As mentioned in Refs. [11,25], this might cause a little difference in the temperature history between simulation and measurement.
Fig. 8.
Comparison of temperature history of two points in the substrate.
3.2. Comparison of in-situ displacement
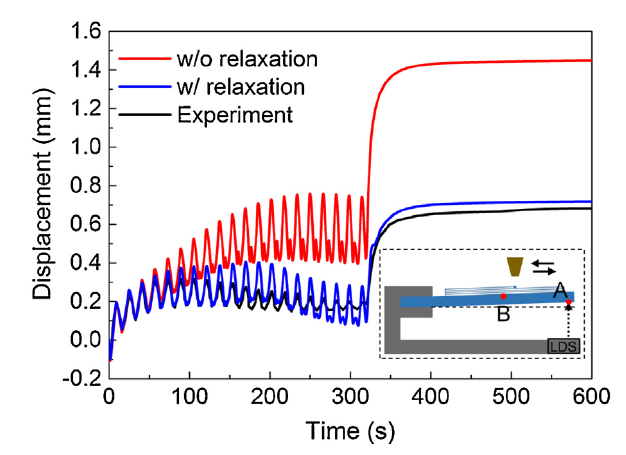
Fig. 9 shows the overall comparison of in-situ out-of-plane displacement (Uz) during the whole manufacturing process between the experimental results and the simulation results. In general, the maximum distortion of each layer increases over the course of the first several layers, then decreases as the depositing layers increase further, and finally increases to a high value when the depositing is completed and the part cools to room temperature. At the initial few layers (approximately 9), both the two simulation cases are in good agreement with the experimental measurement. As the number of layers increases, the experimental measurements consistent more with the simulation case with relaxation model, but are quite different from the simulation case without the relaxation model. The predicted distortion is far larger than the experimental measurement for the case without the relaxation model. It should be noted that the inputs of the temperature field are the same for the two cases (with and without relaxation model), while the distortion history shows a big difference during both the multiple depositing processes and the final cooling process. The large deviation between the experiment and the simulated distortion was also observed by Denlinger et al. [21]. In their study, the stress relaxation behavior was described by an instantaneous relaxation model.
Fig. 9.
Comparison of in-situ displacement of point A during manufacturing process between the experimental results and the simulation results.
3.3. Comparison of final distortion
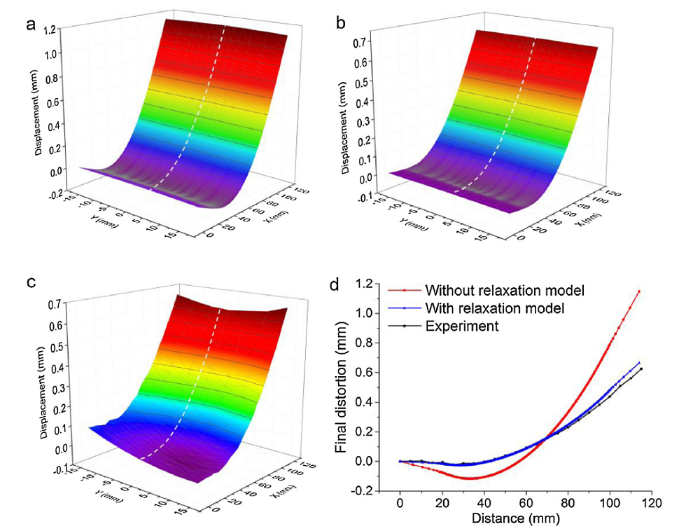
Fig. 10 shows the comparison of the final distortion distribution of the substrate. Fig. 10(a-c) shows the distortion distribution of the simulation result without a relaxation model, simulation result with the relaxation model, and the experiment results, respectively. The maximum final distortion of the cantilever substrate has the same trend for the three cases after the final cooling process. A comparison of distortion along the center of the substrate is shown in Fig. 10(d). The maximum final distortions of the substrate are 0.626 mm, 0.666 mm, and 1.149 mm for the experiment, the case with relaxation, and the case without relaxation, respectively. The maximum deviation of distortion for the case without relaxation is 83.54 %, while that with relaxation is 6.38 %, in comparison with the experiment. It is clear that the final distortion predicted by the simulation without the relaxation model is overestimated.
Fig. 10.
Final distortion distribution of the bottom of substrate (a) simulation-without relaxation model, (b) simulation-with relaxation model, (c) experiment, and (d) comparison of the final distortion along the center line.
Comparing with the traditional model, the predicted accuracy has a great improvement by using the proposed relaxation model, in terms of both in-situ distortion and the final distortion distribution. There still exists difference between the experimental results and the simulation results considering stress relaxation during the transient process. The main reason might because there are some simplifications in the established model. Such as the simplified treatment in the convection heat transfer of shielding gas, and the linear treatment in the constitutive model, etc. More comprehensive and accurate models will be established in our future research to simulate the transient process more accurately.
4. Discussion
4.1. Distortion evolution mechanism during manufacturing
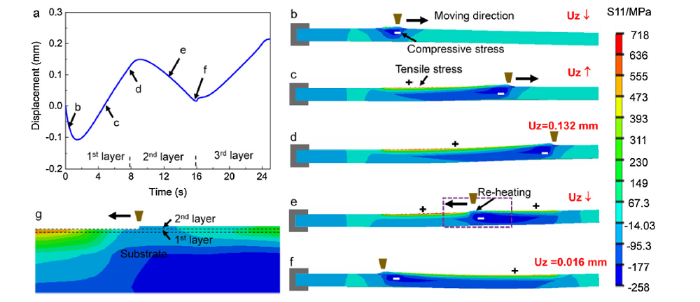
To illustrate the distortion evolution behavior of the substrate during the multilayer depositing process, Fig. 11(a) shows the enlarged image of displacement history when depositing the first three layers. Fig. 11(b-e) show the longitudinal stress distribution at various times, which are indicated in Fig. 11(a). In the first 1.4 s of the deposition, Uz decreases to negative value because of the localized heating at the top of the substrate, which causes the material underneath the melt pool to generate compression stress that bends the substrate downward, as indicated in Fig. 11(b). After 1.4 s, Uz begins to recover due to the solidification of the deposited material at the top surface of the substrate since the heat source moves from left to right, as shown in Fig. 11(c). At the end of the first layer, Uz increases to a positive value, 0.132 mm, indicating that the substrate is bending upward, as shown in Fig. 11(d). When depositing the second layer, the heat source moves from right to left, and Uz begins to decrease, as shown in Fig. 11(e). The deposited material is reheated by the heat source as shown in the enlarged image in Fig.11(g). It indicates that the generated tensile stress decreases to nearly zero when the heat source approaches and increases again to tensile stress when the heat source moves away. At the end of the second depositing layer, Uz decreases to 0.016 mm. Compared with its initial state, the substrate bends upward after the deposition of two layers. The deformation behavior of the substrate follows the same pattern for the subsequent layers.
Fig. 11.
(a) Displacement history of point A (as indicated in Fig. 9) when deposing the first three layers. The longitudinal stress distribution of the substrate at selected time: (b) t = 1 s, (c) t = 6 s, (d) t = 8 s, (e) t = 9 s and (f) t = 16 s. (g) enlarged image of the selected area in Fig. 11(e).
4.2. Role of relaxation behavior on stress and inelastic strain
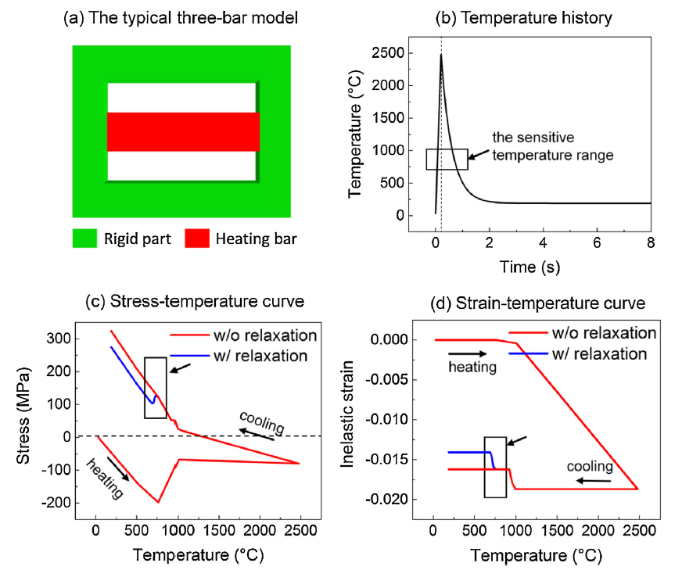
To clarify the influence mechanism of the relaxation model on the stress and deformation, a typical three-bar simulation is conducted. Fig. 12(a) shows a three-bar model, in which the center bar is connected with the rigid bar. Fig. 12(b) shows the temperature history when deposing one layer. This temperature history is extracted and applied to the center bar in Fig. 12(a), while the rigid bars are set to room temperature with no temperature changes. Fig. 12(c) and d show the changes in the stress and inelastic strain of the center bar when it is heated and cooled, respectively. The red curve represents the calculation results of the traditional model (that is, the stress relaxation is not considered), while the blue curve represents the calculation results after the relaxation model is considered. According to the computational welding mechanics, the deformation depends on the inelastic strain accumulated during thermal cycling. In the traditional model, the inelastic strain is equal to the plastic strain, while in the stress relaxation model, the inelastic strain is equal to the sum of the plastic strain and the relaxation strain.
Fig. 12.
(a) Typical three-bar model. (b) Temperature history during deposition. (c) Stress evolution. (d) Inelastic strain evolution.
The red curves in Fig. 12(c) and (d) show the evolution of stress and deformation when the traditional model is adopted. In the heating stage, the center bar is expanded and generates compressive stress due to the constraint of the rigid bar, as shown in Fig. 12(c). When the temperature is relatively low, only elastic deformation occurs. The compressive plastic strain begins to generate when the heating temperature exceeds a certain value, as the thermal stress exceeds the yield strength at that temperature, as shown in Fig. 12(d). In the cooling stage, the center bar is shrinkage and generates tensile stress due to the constraint of the rigid bar. Tensile plastic strain generates at high temperature, which offsets the compressive plastic strain, and leads to the decrease of the compressive inelastic strain at 1000 ℃. As the temperature continually decreases, the material gradually recovers its mechanical resistance. Since the tensile stress is smaller than the yield strength at low temperatures, only elastic deformation occurs. It also leads to an increase in tensile stress, while the inelastic strain keeps constant when the temperature continually decreases.
The blue curves in Fig. 12(c) and (d) show the evolution of stress and deformation when the relaxation model is adopted. In the heating stage, the blue curve and the red curve coincide basically, which indicates that the relaxation model has a slight effect during the heating stage since the rapid heating rate. During the cooling stage, when the temperature decreases to 600-800 ℃, the tensile stress drops since the relaxation model, as shown in the black box in Fig. 12(c). At the same time, the inelastic strain gets a certain recovery, as shown in the black box in Fig. 12(d). According to the expression of relaxation strain, the tensile stress produces a positive relaxation strain increment in the cooling stage, which results in the recovery of the compress plastic strain during the cooling stage. Thus, when the relaxation model is employed, the calculated stress and distortion are smaller than those calculated by the traditional model.
4.3. Relaxation mechanism during additive manufacturing
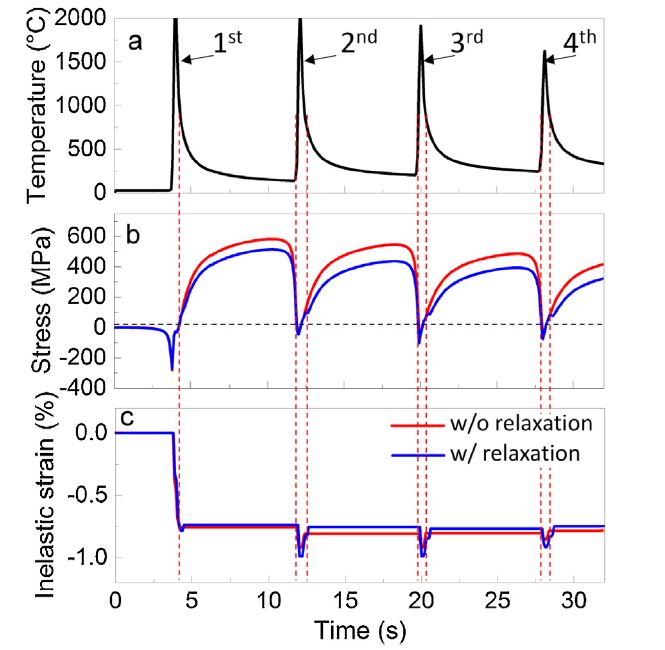
Fig. 13(a) is the temperature history of the material at the center of the substrate when depositing the first four layers. Fig. 13(b) and (c) is the stress history and inelastic strain history, respectively. The red curve represents the calculation results when the traditional model is adopted, while the blue curve represents the calculation results when the relaxation model is adopted.
Fig. 13.
Evolution histories of temperature (a), stress (b) and inelastic strain (c) during the first four deposition.
As shown, there is little difference in the stress and inelastic strain between the two cases when depositing the first layer. When depositing the 2nd, 3rd, and 4th layers, the existence of the relaxation model increases the compression inelastic strain at the heating stage and decreases the compression inelastic strain during the cooling stage, as shown in Fig. 13(c). It is because that the stress (and thus the relaxation strain) is negative at the temperature range of relaxation during heating, while positive during cooling. After depositing each layer, the difference of inelastic strain between the two cases is small. Therefore, relaxation behavior has a limited effect on distortion when depositing the first several layers, which is in accordance with experimental measurement, as shown in Fig. 9.
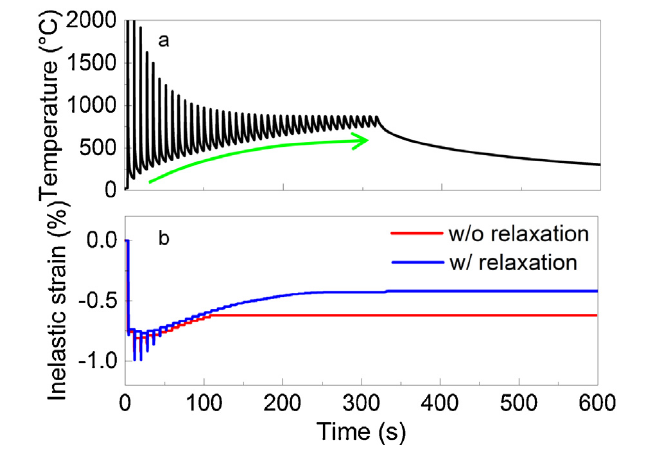
Fig. 14(a) and (b) shows the evolution of temperature and relaxation strain during the whole AM process. As the number of deposition layers increases, the inelastic strain calculated by the traditional model doesn’t change during the subsequent deposition, as shown in the red line of Fig. 14(a). It is because the material is far from the current heat source after depositing several layers. However, the inelastic strain calculated by the relaxation increases during the subsequent deposition, as shown in blue lines of Fig. 14(b). It is attributed to the stress relaxation behavior of the material. Although the inelastic strain of each recovery is relatively small, the relaxation occurs when depositing each layer, and the relaxation strain accumulates as the number of layers increases. Therefore, the predicted distortion is overestimated for the case without the relaxation model because it cannot describe the repeated annealing behavior in AM.
Fig. 14.
Evolution of temperature (a) and relaxation strain (b) during the whole AM process.
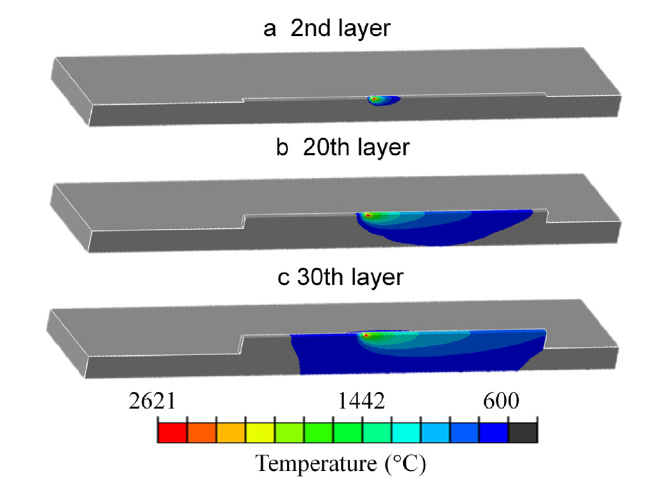
More importantly, as the number of deposition layers increases, the temperature of the substrate and the deposited part increase due to the thermal accumulation phenomenon. Fig. 15 shows the areas that above the relaxation temperature, i.e. 600 ℃, when depositing (a) the 1 st layer, (b) the 20th layer and (c) the 30th layer. The colored area indicates the deposited material where the stress relaxation takes place. As shown in Fig. 15(a), when depositing the first layer, the area where the relaxation takes place is small. As the number of deposition layers increases, the area with a temperature of above 600 ℃ gradually expands, as shown in Fig. 15(b). When depositing the 30th layer, most of the formed parts and the substrate are above 600 ℃, as shown in Fig. 15(c). Therefore, the relaxation behavior has a significant effect on the distortion when depositing multiple layers, which is a representative feature of AM which including multiple layers to deposit an actual component.
Fig. 15.
Temperature field when depositing (a) the 2nd layer, (b) the 20th layer and (c) the 30th layer.
5. Conclusions
(1)An enhanced distortion prediction in AM is achieved by taking the stress relaxation into account on the basis of experimental results. The model is applied in the thermo-mechanical modeling of AM to predict the distortion of a thin wall.
(2)The in-situ and final distortion measurement shows that the thermo-mechanical model considering stress relaxation is demonstrated to be much more accurate. The maximum deviation of distortion for the case without relaxation is 83.54 %, while that with relaxation is 6.38 %, in comparison with the experiment.
(3)The predicted distortion is overestimated for the case without relaxation because the conventional model cannot describe the repeated annealing behavior in AM. By using the proposed relaxation model, the prediction accuracy is significantly improved due to the recovery of inelastic strain during subsequent deposition.
(4)The stress relaxation shows a limited effect on distortion when merely depositing several layers; Nevertheless, it has a significant effect on distortion when depositing multiple layers, which is a representative feature of AM which including multiple layers to establish an actual component.
Acknowledgements
The study was financially supported by the National Key Technologies Research and Development Program, China (No. 2016YFB1100100) and the China Scholarship Council. Ruishan Xie would like to acknowledge valuable suggestions from Dr. Cheng Yu and Prof. Wing Kim Liu at Northwestern University, USA. We also acknowledge the experimental assistance from Mr. Yan Cao, Mr. Bo Yao, Dr. Lei Wei, and Prof. Xin Lin at Northwestern Polytechnical University, China.
... Metal additive manufacturing (AM) is a promising processing technology with great potential to fabricate complex components in many industrial fields. However, thermal deformation is inevitable due to repeated and extremely transient thermal cycles in the process of manufacturing [1]. The thermal stresses and distortion would seriously affect part dimensional accuracy, and have become the essential problems when fabricating large scale components [2]. It is difficult to investigate the complex thermo-mechanical process by experimental approaches, though there is a great potential of in-situ monitoring techniques [[3], [4], [5]]. In comparison, finite element modeling becomes an available and economical approach to understand the basic thermo-mechanical behavior and to predict the part distortion. To this end, several thermal-mechanical models have been successfully employed to predict the part distortion in AM. ...
1
2019
... Metal additive manufacturing (AM) is a promising processing technology with great potential to fabricate complex components in many industrial fields. However, thermal deformation is inevitable due to repeated and extremely transient thermal cycles in the process of manufacturing [1]. The thermal stresses and distortion would seriously affect part dimensional accuracy, and have become the essential problems when fabricating large scale components [2]. It is difficult to investigate the complex thermo-mechanical process by experimental approaches, though there is a great potential of in-situ monitoring techniques [[3], [4], [5]]. In comparison, finite element modeling becomes an available and economical approach to understand the basic thermo-mechanical behavior and to predict the part distortion. To this end, several thermal-mechanical models have been successfully employed to predict the part distortion in AM. ...
1
2018
... Metal additive manufacturing (AM) is a promising processing technology with great potential to fabricate complex components in many industrial fields. However, thermal deformation is inevitable due to repeated and extremely transient thermal cycles in the process of manufacturing [1]. The thermal stresses and distortion would seriously affect part dimensional accuracy, and have become the essential problems when fabricating large scale components [2]. It is difficult to investigate the complex thermo-mechanical process by experimental approaches, though there is a great potential of in-situ monitoring techniques [[3], [4], [5]]. In comparison, finite element modeling becomes an available and economical approach to understand the basic thermo-mechanical behavior and to predict the part distortion. To this end, several thermal-mechanical models have been successfully employed to predict the part distortion in AM. ...
1
2016
... Metal additive manufacturing (AM) is a promising processing technology with great potential to fabricate complex components in many industrial fields. However, thermal deformation is inevitable due to repeated and extremely transient thermal cycles in the process of manufacturing [1]. The thermal stresses and distortion would seriously affect part dimensional accuracy, and have become the essential problems when fabricating large scale components [2]. It is difficult to investigate the complex thermo-mechanical process by experimental approaches, though there is a great potential of in-situ monitoring techniques [[3], [4], [5]]. In comparison, finite element modeling becomes an available and economical approach to understand the basic thermo-mechanical behavior and to predict the part distortion. To this end, several thermal-mechanical models have been successfully employed to predict the part distortion in AM. ...
2
2019
... Metal additive manufacturing (AM) is a promising processing technology with great potential to fabricate complex components in many industrial fields. However, thermal deformation is inevitable due to repeated and extremely transient thermal cycles in the process of manufacturing [1]. The thermal stresses and distortion would seriously affect part dimensional accuracy, and have become the essential problems when fabricating large scale components [2]. It is difficult to investigate the complex thermo-mechanical process by experimental approaches, though there is a great potential of in-situ monitoring techniques [[3], [4], [5]]. In comparison, finite element modeling becomes an available and economical approach to understand the basic thermo-mechanical behavior and to predict the part distortion. To this end, several thermal-mechanical models have been successfully employed to predict the part distortion in AM. ...
... The sequentially coupled thermal-mechanical finite element analysis is employed using Abaqus in this study. The heat transfer analysis is conducted first to obtain the temperature field, which is then applied as the thermal load to the mechanical analysis. The energy governing equation for heat transfer analysis is described in our previous study [5]. ...
2
2011
... Since AM can be thought of as a continually multi-layer and multi-bead welding process on the top of the substrate, most of the models in AM showed great similarity to that in computational weld mechanics (CWM) [[6], [7], [8], [9]]. For example, Cao et al. [10] employed the fully coupled thermo-mechanical model to predict distortion in the electron beam AM process. Yang el at [11]. proposed a three-dimensional sequentially coupled thermo-elastic-plastic model to predict residual distortion in the laser-engineered net-shaping process. Mukherjee et al. [12] improved the modeling accuracy of transient temperature by using the heat transfer and fluid flow model. In addition, some reduced order method and simplification strategies were also employed in AM to improve modeling efficiencies, such as the inherent strain method [13], equivalent temperature field method [14], and adaptive meshing technique [15]. ...
... Some researchers have realized the importance of material mechanical behavior to the modeling accuracy in multilayer welding and AM process. Zhang et al. [19] proposed a history-dependent material mechanical model for cold work hardening aluminum alloy. They indicated the enhanced accuracy of the predicted distortion by using the history-dependent model in welding [6,19]. Qiao et al. [20] proposed a dynamic strain hardening recovery model for stainless steel to improve the modeling accuracy in the multilayer welding process. Denlinger et al. [21] proposed an instantaneous relaxation model for Ti-6Al-4 V in directed energy deposition when the temperature exceeded a temperature, which was calibrated and artificially set to 690 °C to provide a correlation between the experimental measured and simulated distortion. The instantaneous annealing model was also applied by Lu et al. [22]. In their studies, the stress relaxation behavior was taken into consideration in the thermo-mechanical modeling by using an instantaneous model. However, the relaxation behavior in the actual AM process is a physically temperature dependent and gradual process [17], which is more suitably described by a gradual relaxation model. ...
1
2016
... Since AM can be thought of as a continually multi-layer and multi-bead welding process on the top of the substrate, most of the models in AM showed great similarity to that in computational weld mechanics (CWM) [[6], [7], [8], [9]]. For example, Cao et al. [10] employed the fully coupled thermo-mechanical model to predict distortion in the electron beam AM process. Yang el at [11]. proposed a three-dimensional sequentially coupled thermo-elastic-plastic model to predict residual distortion in the laser-engineered net-shaping process. Mukherjee et al. [12] improved the modeling accuracy of transient temperature by using the heat transfer and fluid flow model. In addition, some reduced order method and simplification strategies were also employed in AM to improve modeling efficiencies, such as the inherent strain method [13], equivalent temperature field method [14], and adaptive meshing technique [15]. ...
1
2006
... Since AM can be thought of as a continually multi-layer and multi-bead welding process on the top of the substrate, most of the models in AM showed great similarity to that in computational weld mechanics (CWM) [[6], [7], [8], [9]]. For example, Cao et al. [10] employed the fully coupled thermo-mechanical model to predict distortion in the electron beam AM process. Yang el at [11]. proposed a three-dimensional sequentially coupled thermo-elastic-plastic model to predict residual distortion in the laser-engineered net-shaping process. Mukherjee et al. [12] improved the modeling accuracy of transient temperature by using the heat transfer and fluid flow model. In addition, some reduced order method and simplification strategies were also employed in AM to improve modeling efficiencies, such as the inherent strain method [13], equivalent temperature field method [14], and adaptive meshing technique [15]. ...
1
2016
... Since AM can be thought of as a continually multi-layer and multi-bead welding process on the top of the substrate, most of the models in AM showed great similarity to that in computational weld mechanics (CWM) [[6], [7], [8], [9]]. For example, Cao et al. [10] employed the fully coupled thermo-mechanical model to predict distortion in the electron beam AM process. Yang el at [11]. proposed a three-dimensional sequentially coupled thermo-elastic-plastic model to predict residual distortion in the laser-engineered net-shaping process. Mukherjee et al. [12] improved the modeling accuracy of transient temperature by using the heat transfer and fluid flow model. In addition, some reduced order method and simplification strategies were also employed in AM to improve modeling efficiencies, such as the inherent strain method [13], equivalent temperature field method [14], and adaptive meshing technique [15]. ...
2
2016
... Since AM can be thought of as a continually multi-layer and multi-bead welding process on the top of the substrate, most of the models in AM showed great similarity to that in computational weld mechanics (CWM) [[6], [7], [8], [9]]. For example, Cao et al. [10] employed the fully coupled thermo-mechanical model to predict distortion in the electron beam AM process. Yang el at [11]. proposed a three-dimensional sequentially coupled thermo-elastic-plastic model to predict residual distortion in the laser-engineered net-shaping process. Mukherjee et al. [12] improved the modeling accuracy of transient temperature by using the heat transfer and fluid flow model. In addition, some reduced order method and simplification strategies were also employed in AM to improve modeling efficiencies, such as the inherent strain method [13], equivalent temperature field method [14], and adaptive meshing technique [15]. ...
... The comparison of temperature histories of the two points in the substrate between the simulation results and experimental measurements are shown in Fig. 8. The temperature of the substrate increases during the deposition because of the thermal accumulation. It is observed that the simulation results are in agreement with the experimental measurements for the two points. The difference of amplitudes between the simulation and the experimental for TC1 and TC2 is 6.18 % and 7.67 %, respectively. The difference might be caused by the complex convection of shielding gas flow is not considered. As mentioned in Refs. [11,25], this might cause a little difference in the temperature history between simulation and measurement. ...
1
2017
... Since AM can be thought of as a continually multi-layer and multi-bead welding process on the top of the substrate, most of the models in AM showed great similarity to that in computational weld mechanics (CWM) [[6], [7], [8], [9]]. For example, Cao et al. [10] employed the fully coupled thermo-mechanical model to predict distortion in the electron beam AM process. Yang el at [11]. proposed a three-dimensional sequentially coupled thermo-elastic-plastic model to predict residual distortion in the laser-engineered net-shaping process. Mukherjee et al. [12] improved the modeling accuracy of transient temperature by using the heat transfer and fluid flow model. In addition, some reduced order method and simplification strategies were also employed in AM to improve modeling efficiencies, such as the inherent strain method [13], equivalent temperature field method [14], and adaptive meshing technique [15]. ...
1
2018
... Since AM can be thought of as a continually multi-layer and multi-bead welding process on the top of the substrate, most of the models in AM showed great similarity to that in computational weld mechanics (CWM) [[6], [7], [8], [9]]. For example, Cao et al. [10] employed the fully coupled thermo-mechanical model to predict distortion in the electron beam AM process. Yang el at [11]. proposed a three-dimensional sequentially coupled thermo-elastic-plastic model to predict residual distortion in the laser-engineered net-shaping process. Mukherjee et al. [12] improved the modeling accuracy of transient temperature by using the heat transfer and fluid flow model. In addition, some reduced order method and simplification strategies were also employed in AM to improve modeling efficiencies, such as the inherent strain method [13], equivalent temperature field method [14], and adaptive meshing technique [15]. ...
1
2014
... Since AM can be thought of as a continually multi-layer and multi-bead welding process on the top of the substrate, most of the models in AM showed great similarity to that in computational weld mechanics (CWM) [[6], [7], [8], [9]]. For example, Cao et al. [10] employed the fully coupled thermo-mechanical model to predict distortion in the electron beam AM process. Yang el at [11]. proposed a three-dimensional sequentially coupled thermo-elastic-plastic model to predict residual distortion in the laser-engineered net-shaping process. Mukherjee et al. [12] improved the modeling accuracy of transient temperature by using the heat transfer and fluid flow model. In addition, some reduced order method and simplification strategies were also employed in AM to improve modeling efficiencies, such as the inherent strain method [13], equivalent temperature field method [14], and adaptive meshing technique [15]. ...
1
2017
... Though the significant similarities between AM and welding, AM has its own process characteristics. As shown in Fig. 1(a), only one heating-cooling cycle exists during welding and thus the material has a short dwell time at high temperatures. However, that is not the case for AM, which involves multiple thermal cycles to build a practical component, as shown in Fig. 1(b). The early deposited material will experience repeated heating-cooling thermal cycles in the subsequent deposition course. Considering the time accumulation effect during the periodical multilayer depositing process, it is unavoidable for the deposited material to be subjected to high temperatures for a relatively long time. Many experimental studies indicate that when the material is subjected to high temperature and stress, the stress relaxation behavior takes place [16,17]. Thus, it is reasonable that the thermal relaxation behavior can be neglected during welding [18], however, such behavior can be a significant factor in affecting the mechanical behavior of the material during AM. ...
3
2018
... Though the significant similarities between AM and welding, AM has its own process characteristics. As shown in Fig. 1(a), only one heating-cooling cycle exists during welding and thus the material has a short dwell time at high temperatures. However, that is not the case for AM, which involves multiple thermal cycles to build a practical component, as shown in Fig. 1(b). The early deposited material will experience repeated heating-cooling thermal cycles in the subsequent deposition course. Considering the time accumulation effect during the periodical multilayer depositing process, it is unavoidable for the deposited material to be subjected to high temperatures for a relatively long time. Many experimental studies indicate that when the material is subjected to high temperature and stress, the stress relaxation behavior takes place [16,17]. Thus, it is reasonable that the thermal relaxation behavior can be neglected during welding [18], however, such behavior can be a significant factor in affecting the mechanical behavior of the material during AM. ...
... Some researchers have realized the importance of material mechanical behavior to the modeling accuracy in multilayer welding and AM process. Zhang et al. [19] proposed a history-dependent material mechanical model for cold work hardening aluminum alloy. They indicated the enhanced accuracy of the predicted distortion by using the history-dependent model in welding [6,19]. Qiao et al. [20] proposed a dynamic strain hardening recovery model for stainless steel to improve the modeling accuracy in the multilayer welding process. Denlinger et al. [21] proposed an instantaneous relaxation model for Ti-6Al-4 V in directed energy deposition when the temperature exceeded a temperature, which was calibrated and artificially set to 690 °C to provide a correlation between the experimental measured and simulated distortion. The instantaneous annealing model was also applied by Lu et al. [22]. In their studies, the stress relaxation behavior was taken into consideration in the thermo-mechanical modeling by using an instantaneous model. However, the relaxation behavior in the actual AM process is a physically temperature dependent and gradual process [17], which is more suitably described by a gradual relaxation model. ...
... To obtain the values of A and n in Eq. (2), the relationship between $ ln {{\dot{\varepsilon }}_{\text{re}}} $ and ln(σ) will be established based on the stress relaxation test of the additive manufactured Ti6Al4V. Cylindrical specimens were prepared via wire electrical discharge machining from the laser additive manufactured part. The specimens have dimensions of 6 mm in diameter and 10 mm long, as shown in Fig. 2(a). A type K thermocouple was welded to the center of each specimen to measure the temperature. The stress relaxation test was carried out on a Gleeb 3500 thermal simulator with the following step: (1) heating the specimens to a certain temperature, (2) then compressing them to an engineering strain of 0.45 %, and (3) recording the stress with the temperature and strain keeping constant. The evolution histories of temperature, strain and stress are shown in Fig. 2(b). The stress relaxation tests were carried out at 600, 700 and 800 ℃, which are sensitive temperatures, according to the previous Refs. [20,21]. The stress relaxation data at different temperatures were obtained and shown in Fig. 3. The data were fitted with the following equation [17] using MATLAB: ...
1
2005
... Though the significant similarities between AM and welding, AM has its own process characteristics. As shown in Fig. 1(a), only one heating-cooling cycle exists during welding and thus the material has a short dwell time at high temperatures. However, that is not the case for AM, which involves multiple thermal cycles to build a practical component, as shown in Fig. 1(b). The early deposited material will experience repeated heating-cooling thermal cycles in the subsequent deposition course. Considering the time accumulation effect during the periodical multilayer depositing process, it is unavoidable for the deposited material to be subjected to high temperatures for a relatively long time. Many experimental studies indicate that when the material is subjected to high temperature and stress, the stress relaxation behavior takes place [16,17]. Thus, it is reasonable that the thermal relaxation behavior can be neglected during welding [18], however, such behavior can be a significant factor in affecting the mechanical behavior of the material during AM. ...
2
2008
... Some researchers have realized the importance of material mechanical behavior to the modeling accuracy in multilayer welding and AM process. Zhang et al. [19] proposed a history-dependent material mechanical model for cold work hardening aluminum alloy. They indicated the enhanced accuracy of the predicted distortion by using the history-dependent model in welding [6,19]. Qiao et al. [20] proposed a dynamic strain hardening recovery model for stainless steel to improve the modeling accuracy in the multilayer welding process. Denlinger et al. [21] proposed an instantaneous relaxation model for Ti-6Al-4 V in directed energy deposition when the temperature exceeded a temperature, which was calibrated and artificially set to 690 °C to provide a correlation between the experimental measured and simulated distortion. The instantaneous annealing model was also applied by Lu et al. [22]. In their studies, the stress relaxation behavior was taken into consideration in the thermo-mechanical modeling by using an instantaneous model. However, the relaxation behavior in the actual AM process is a physically temperature dependent and gradual process [17], which is more suitably described by a gradual relaxation model. ...
... ,19]. Qiao et al. [20] proposed a dynamic strain hardening recovery model for stainless steel to improve the modeling accuracy in the multilayer welding process. Denlinger et al. [21] proposed an instantaneous relaxation model for Ti-6Al-4 V in directed energy deposition when the temperature exceeded a temperature, which was calibrated and artificially set to 690 °C to provide a correlation between the experimental measured and simulated distortion. The instantaneous annealing model was also applied by Lu et al. [22]. In their studies, the stress relaxation behavior was taken into consideration in the thermo-mechanical modeling by using an instantaneous model. However, the relaxation behavior in the actual AM process is a physically temperature dependent and gradual process [17], which is more suitably described by a gradual relaxation model. ...
2
2013
... Some researchers have realized the importance of material mechanical behavior to the modeling accuracy in multilayer welding and AM process. Zhang et al. [19] proposed a history-dependent material mechanical model for cold work hardening aluminum alloy. They indicated the enhanced accuracy of the predicted distortion by using the history-dependent model in welding [6,19]. Qiao et al. [20] proposed a dynamic strain hardening recovery model for stainless steel to improve the modeling accuracy in the multilayer welding process. Denlinger et al. [21] proposed an instantaneous relaxation model for Ti-6Al-4 V in directed energy deposition when the temperature exceeded a temperature, which was calibrated and artificially set to 690 °C to provide a correlation between the experimental measured and simulated distortion. The instantaneous annealing model was also applied by Lu et al. [22]. In their studies, the stress relaxation behavior was taken into consideration in the thermo-mechanical modeling by using an instantaneous model. However, the relaxation behavior in the actual AM process is a physically temperature dependent and gradual process [17], which is more suitably described by a gradual relaxation model. ...
... To obtain the values of A and n in Eq. (2), the relationship between $ ln {{\dot{\varepsilon }}_{\text{re}}} $ and ln(σ) will be established based on the stress relaxation test of the additive manufactured Ti6Al4V. Cylindrical specimens were prepared via wire electrical discharge machining from the laser additive manufactured part. The specimens have dimensions of 6 mm in diameter and 10 mm long, as shown in Fig. 2(a). A type K thermocouple was welded to the center of each specimen to measure the temperature. The stress relaxation test was carried out on a Gleeb 3500 thermal simulator with the following step: (1) heating the specimens to a certain temperature, (2) then compressing them to an engineering strain of 0.45 %, and (3) recording the stress with the temperature and strain keeping constant. The evolution histories of temperature, strain and stress are shown in Fig. 2(b). The stress relaxation tests were carried out at 600, 700 and 800 ℃, which are sensitive temperatures, according to the previous Refs. [20,21]. The stress relaxation data at different temperatures were obtained and shown in Fig. 3. The data were fitted with the following equation [17] using MATLAB: ...
3
2014
... Some researchers have realized the importance of material mechanical behavior to the modeling accuracy in multilayer welding and AM process. Zhang et al. [19] proposed a history-dependent material mechanical model for cold work hardening aluminum alloy. They indicated the enhanced accuracy of the predicted distortion by using the history-dependent model in welding [6,19]. Qiao et al. [20] proposed a dynamic strain hardening recovery model for stainless steel to improve the modeling accuracy in the multilayer welding process. Denlinger et al. [21] proposed an instantaneous relaxation model for Ti-6Al-4 V in directed energy deposition when the temperature exceeded a temperature, which was calibrated and artificially set to 690 °C to provide a correlation between the experimental measured and simulated distortion. The instantaneous annealing model was also applied by Lu et al. [22]. In their studies, the stress relaxation behavior was taken into consideration in the thermo-mechanical modeling by using an instantaneous model. However, the relaxation behavior in the actual AM process is a physically temperature dependent and gradual process [17], which is more suitably described by a gradual relaxation model. ...
... To obtain the values of A and n in Eq. (2), the relationship between $ ln {{\dot{\varepsilon }}_{\text{re}}} $ and ln(σ) will be established based on the stress relaxation test of the additive manufactured Ti6Al4V. Cylindrical specimens were prepared via wire electrical discharge machining from the laser additive manufactured part. The specimens have dimensions of 6 mm in diameter and 10 mm long, as shown in Fig. 2(a). A type K thermocouple was welded to the center of each specimen to measure the temperature. The stress relaxation test was carried out on a Gleeb 3500 thermal simulator with the following step: (1) heating the specimens to a certain temperature, (2) then compressing them to an engineering strain of 0.45 %, and (3) recording the stress with the temperature and strain keeping constant. The evolution histories of temperature, strain and stress are shown in Fig. 2(b). The stress relaxation tests were carried out at 600, 700 and 800 ℃, which are sensitive temperatures, according to the previous Refs. [20,21]. The stress relaxation data at different temperatures were obtained and shown in Fig. 3. The data were fitted with the following equation [17] using MATLAB: ...
... Fig. 9 shows the overall comparison of in-situ out-of-plane displacement (Uz) during the whole manufacturing process between the experimental results and the simulation results. In general, the maximum distortion of each layer increases over the course of the first several layers, then decreases as the depositing layers increase further, and finally increases to a high value when the depositing is completed and the part cools to room temperature. At the initial few layers (approximately 9), both the two simulation cases are in good agreement with the experimental measurement. As the number of layers increases, the experimental measurements consistent more with the simulation case with relaxation model, but are quite different from the simulation case without the relaxation model. The predicted distortion is far larger than the experimental measurement for the case without the relaxation model. It should be noted that the inputs of the temperature field are the same for the two cases (with and without relaxation model), while the distortion history shows a big difference during both the multiple depositing processes and the final cooling process. The large deviation between the experiment and the simulated distortion was also observed by Denlinger et al. [21]. In their study, the stress relaxation behavior was described by an instantaneous relaxation model. ...
1
2018
... Some researchers have realized the importance of material mechanical behavior to the modeling accuracy in multilayer welding and AM process. Zhang et al. [19] proposed a history-dependent material mechanical model for cold work hardening aluminum alloy. They indicated the enhanced accuracy of the predicted distortion by using the history-dependent model in welding [6,19]. Qiao et al. [20] proposed a dynamic strain hardening recovery model for stainless steel to improve the modeling accuracy in the multilayer welding process. Denlinger et al. [21] proposed an instantaneous relaxation model for Ti-6Al-4 V in directed energy deposition when the temperature exceeded a temperature, which was calibrated and artificially set to 690 °C to provide a correlation between the experimental measured and simulated distortion. The instantaneous annealing model was also applied by Lu et al. [22]. In their studies, the stress relaxation behavior was taken into consideration in the thermo-mechanical modeling by using an instantaneous model. However, the relaxation behavior in the actual AM process is a physically temperature dependent and gradual process [17], which is more suitably described by a gradual relaxation model. ...
1
2014
... It should be noted that the relationship between ln${{\dot{\varepsilon }}_{\text{re}}}$ and ln(σ) is linear at 600 ℃ and 700 ℃, but not completely linear at 800 ℃. The reason can be attributed to the different annealing mechanisms at low and high temperatures. Recovery is the main mechanism at low temperatures, while recovery and recrystallization might occur simultaneously at high temperatures [23]. Here, the relationship between ln${{\dot{\varepsilon }}_{\text{re}}}$ and ln(σ) at 800 ℃ is simplified as linear for the preliminary attempt. The development of detailed models that include a more detailed description of the curve and the investigation on its influence on calculation results will be further studied in our future research. ...
1
2016
... where εe, εp, εth and εre are the elastic strain, plastic strain, thermal strain, and relaxation strain, respectively. The material is assumed to be perfect plastic with J2-von Mises plasticity law, due to the limited work hardening of Ti-6Al-4 V [24]. The relaxation strain is calculated using Eq. (1) with the incremental form. Temperature-dependent material properties of Ti-6Al-4 V, such as Young’s modulus, expansion coefficient, and yield stress are taken from the literature [25], and are listed in Table 2. ...
3
2015
... where εe, εp, εth and εre are the elastic strain, plastic strain, thermal strain, and relaxation strain, respectively. The material is assumed to be perfect plastic with J2-von Mises plasticity law, due to the limited work hardening of Ti-6Al-4 V [24]. The relaxation strain is calculated using Eq. (1) with the incremental form. Temperature-dependent material properties of Ti-6Al-4 V, such as Young’s modulus, expansion coefficient, and yield stress are taken from the literature [25], and are listed in Table 2. ...
... Temperature-dependent material parameters [25]. ...
... The comparison of temperature histories of the two points in the substrate between the simulation results and experimental measurements are shown in Fig. 8. The temperature of the substrate increases during the deposition because of the thermal accumulation. It is observed that the simulation results are in agreement with the experimental measurements for the two points. The difference of amplitudes between the simulation and the experimental for TC1 and TC2 is 6.18 % and 7.67 %, respectively. The difference might be caused by the complex convection of shielding gas flow is not considered. As mentioned in Refs. [11,25], this might cause a little difference in the temperature history between simulation and measurement. ...


 WeChat