Characterization, Removal and Evaluation of Oxide Film in the Diffusion Bonding of Zr55Cu30Ni5Al10 Bulk Metallic Glass
[Chen Haiyan1 , Cao Jian1, *  , Song Xiaoguo
2 , Liu Jiakun1 , Feng Jicai1, 2 ]
, Song Xiaoguo|
|


The composition of oxide film of Zr55Cu30Ni5Al10 bulk metallic glass was identified by X-ray photoelectron spectroscopy. In addition, the relatively sound joints of bulk metallic glass without macroscopic deformation were obtained by removing the oxide film before diffusion bonding. The joint interfaces were observed by scanning electron microscopy and atomic force microscopy. The hardness of joints near the interface was higher than that far away from the interface, which is attributed to the difference of structural relaxation. According to the result of micro-focused X-ray diffractometry and transmission electron microscopy, the joints retained the amorphous structure when the holding time is less than 20 min. The surface area fraction of oxide film on the interface of joints was detected by ultrasonic inspection. Moreover, the surface area fraction of oxide film is in excellent agreement with the theoretical value calculated by shear strength. The result indicated that surface oxide film is the dominant barrier on the diffusion bonding of bulk metallic glass rather than low atomic diffusion coefficient.
With the development of engineering industries, more and more individual components need to be joined into larger assemblies. For most of materials, such as crystalline alloys [1], [2] and [3]and ceramics [4], a variety of welding methods are available. However, for bulk metallic glasses (BMG), the unique amorphous structure limits the application of conventional welding techniques. Due to thermal cycling or straining, BMG may crystallize partially or fully during welding process. In order to retain the amorphous structure, most of welding methods are unavailable for BMG even though they have many advantages in the welding of the conventional materials.
To date, several techniques, such as laser welding [5] and [6], electron beam welding [7] and [8], explosive welding [9] and [10] and friction welding [11], [12] and [13], have been adopted successfully in the welding of BMG. According to the published literature, these available welding methods can provide a fast cooling rate for BMG joints to prevent crystallization. Diffusion bonding is considered to be an infeasible welding method for BMG owing to the long time process of thermal cycling, although this technique can obtain a joint with the large area. Furthermore, there is little report about the research of the diffusion bonding of BMG. Recently, some researches [14] and [15] show that the sound diffusion bonding joints of BMG have been obtained. Moreover, these joints always have macroscopic deformation during the diffusion bonding, which go against precision welding. However, there is no report on the diffusion bonded joints of BMG without macroscopic deformation.
As regards diffusion bonding, the overall heating mode and the low cooling rate after bonding have an advantage of relieving the stress of joints, but go against the retention of amorphous structure. Therefore, the BMG that can be bonded by diffusion bonding should have a superior glass-forming ability. According to the performances and anti-crystallization ability of BMG in difference temperature zones, the diffusion bonding of BMG can be carried out in supercooled liquid region. For BMG, the lower atomic diffusion coefficient and the stable oxide film are the main barriers in the diffusion bonding [15]. Thus, it is necessary to create sufficient bypasses for atomic diffusion or to break the stable oxide film in order to obtain a sound joint. Somekawa et al. [15] removed the surface oxides of Zr65Cu15Ni10Al10 BMG by grit blasting technique before diffusion bonding. The compression lap shear strength of the joints was 138–155 MPa, which is about 20% of strength of the base metal. However, few studies on the oxide film removal effect were reported.
In this study, the composition of surface oxide film of BMG was identified by X-ray photoelectron spectroscopy (XPS, Escalab250, Thermo Corporation). In order to overcome the barriers of oxide film, the oxide film was broken or removed before diffusion bonding by pre-friction surface treatment and argon ion cleaning. The diffusion bonding of BMG was carried out in supercooled liquid region after the surface treatment. The interface of joints was observed by scanning electron microscopy (SEM, JCM-5700) and atomic force microscopy (AFM, Dimension FastScan). The microstructure of joints was detected by micro-focused X-ray diffractometry (MF-XRD, Bruker D8) with a beam size of 50 μm and transmission electron microscopy selected area electron diffraction (TEM-SAED, Tecnai G2F30). Moreover, we also explored the effect of holding time and pressure on the strength and deformation ratio of joints. The surface area fraction of oxide film in the interface of joints was detected by scanning acoustic microscope (AM300, PVA Tepla Corporation).
Plates of Zr55Cu30Ni5Al10 BMG with a thickness of 3 mm were used in this study. BMG plates were prepared by drop casting the molten alloy into the copper mold. The amorphous structure of the cast alloy was identified by X-ray diffraction (XRD, D/max-rB) with Cu K α radiation. The BMG plates were cut into blocks with the size of 4 mm × 4 mm × 3 mm by wire cutting machine. All specimens were polished by SiC papers up to grit 1000, and ultrasonically cleaned in acetone prior to diffusion bonding. The glass-transition temperature ( Tg) and the crystallization onset temperature ( Tx) of Zr55Cu30Ni5Al10 BMG are 410 °C and 494 °C, respectively. In the diffusion bonding of BMG, the heating rate of 30 °C/min was chosen to decrease the viscosity of BMG specimens.
Conventional diffusion bonding is a solid-state joining technique and involves no liquid fusion or filler metal. This bonding technique is based on the atomic diffusion at the interface of specimens. The specimens to be bonded with their surfaces abutting each other are clamped during the diffusion bonding. Once clamped, the pressure and heat will be applied to the components. Prior to bonding, these surfaces should be polished to be smooth enough. For the diffusion bonding of BMG, the diffusion holding time should be as short as possible because the thermal cycling for long time will cause crystallization of specimens. According to the thermal stability of Zr55Cu30Ni5Al10BMG, the bonding temperature of 440 °C was chosen as the parameter of diffusion bonding. The bonding pressure varies from 40 MPa to 160 MPa, while the holding time varies from 5 min to 30 min.
According to our previous study, the argon ion cleaning is effective to remove the oxide film and create a real-surface. Therefore, argon ion cleaning was used to treat the specimens prior to diffusion bonding. The ion cleaning process, as well as the diffusion bonding process, was carried out in the ion activated vacuum diffusion bonding furnace. First, the specimens were cleaned by 1 keV argon ion beam in ion etching chamber for 20 min, and then the cleaned surfaces were abutted by the fold of specimen holder. Subsequently, the specimens were sent into the diffusion bonding chamber and bonded at 440 °C. The bonding pressure varies from 40 MPa to 160 MPa, while the holding time varies from 5 min to 30 min. More details on the ion cleaning assisted diffusion bonding (IADB) can be found in our previous study [16].
In order to eliminate the effect of surface oxide film, a pre-friction treatment between the specimens was also carried out during the diffusion bonding. The diffusion bonding equipment of pre-friction assisted diffusion bonding (FADB) was designed by assembling the pre-friction device in the vacuum furnace. The pre-friction device can achieve a single direction endless rotation of specimen holder as the reciprocation movement of the upper pressure head. According to our experiments, the pre-friction process was carried out to break the oxide film at 300 °C. For the pre-friction device, the pre-friction pressure of 10 MPa and the pre-friction speed of 15 r/min were used in the pre-friction diffusion hybrid bonding. The pre-friction process lasted for 3 min. Subsequently, the bonding pressure was applied on specimens, and the diffusion process was carried out at 440 °C for different time. More details on the pre-friction device can be found in our previous study [17].
The shear tests were carried out at a displacement speed of 0.5 mm/min in an Instron 3365 universal test machine at room temperature. An average of five measurements was taken for each parameter.
Ultrasonic C-scan is a form of automated ultrasonic testing. It uses high frequency sound energy to conduct examinations and record measurements of planar flaws and their depth. When residual oxide film exists at the interface of joint, ultrasonic waves will be reflected to the receiver. According to the information of reflected waves, the residual oxide film at the interface of joint can be clearly shown in the image.
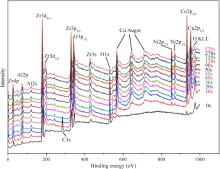
Fig. 1 shows the overall XPS spectrum of as-cast Zr55Cu30Ni5Al10 BMG after ion etching for different time. The peaks of Zr 3 s 3 d 3 p 4 p , Al 2 s 2 p , Ni 2 p , Cu 2 p , O 1 s and C 1 s can be observed from the XPS spectrum. All binding energies were determined relative to the C 1 s peak at 284.6 eV. Owing to the existence of contaminant on the surface, the C 1 s peak of specimen before ion etching is more obvious than that after ion etching. Meanwhile, the intensity of O 1 s peak becomes weaker with the increase of etching time, indicating that the oxide film can be removed effectively by ion etching. The phenomenon provides powerful evidence for the feasibility of the oxide film removal using ion cleaning treatment.
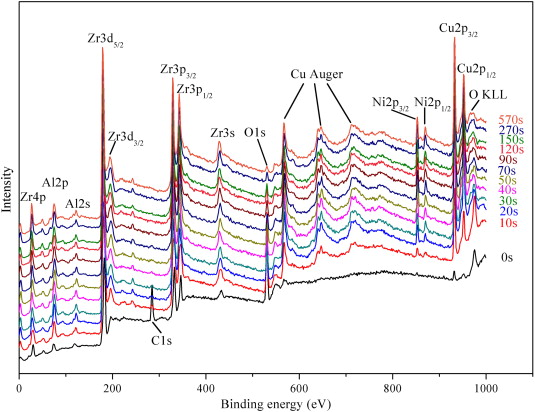 | Fig. 1. Overall XPS spectrum of as-cast Zr55Cu30Ni5Al10 BMG after ion etching for 0, 20, 30, 40, 50, 70, 90, 120, 150, 270 and 570 s. |
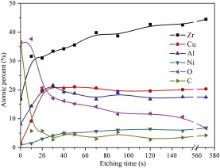
Fig. 2 shows the composition of as-cast Zr55Cu30Ni5Al10BMG surface layer after ion etching for different time. The main elements of surface layers are Zr, Cu, Ni, Al, O and C. It can be seen that the contents of elements C and O in the surface layer before ion etching are higher than that after ion etching. The contents of elements C and O are consistent with the result of XPS spectrum. The contents of all elements Zr, Al, Ni and Cu in the surface layer before ion etching are lower than that after ion etching. Especially, the contents of elements Cu and Ni are marginal, which is attributed to the preferential oxidation of elements Al and Zr.
 | Fig. 2. Composition of as-cast Zr55Cu30Ni5Al10 BMG surface layer after ion etching for 0, 20, 30, 40, 50, 70, 90, 120, 150 and 570 s. |
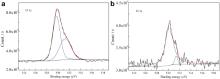
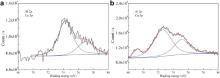
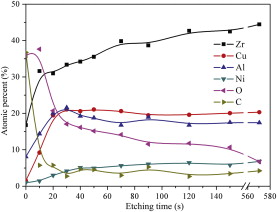
Fig. 3 illustrates O 1 s spectrum of as-cast Zr55Cu30Ni5Al10BMG specimen surface before and after ion etching. The O 1 s spectrum of specimen surface before ion etching consists of two overlapping peaks. According to the peaks at 530.0 eV and 531.4 eV, as shown in Fig. 3(a), the element O exists in the form of OM and OH, respectively. OM is metallic oxides, such as Al2O3, ZrO2 and so on. OH is present in OH-ions, organic pollutants and water molecules adsorbed on the surface. Compared with O 1 s spectrum before ion etching, the intensity of peaks derived from OH and OM becomes weaker after ion etching, as shown in Fig. 3(b). The result also proclaims that ion etching plays an important role in removing the pollutants and oxide film on the surface. Fig. 4 illustrates Al 2 p and Cu 3 p spectrums of as-cast Zr55Cu30Ni5Al10BMG specimen surface before and after ion etching. The overlapping peaks are divided into Al 2 p peak and Cu 3 p peak by peak separation technology. From Fig. 4(a), the Al 2 p peak and Cu 3 p peak locate at 74.3 eV and 77.0 eV, respectively. According to the positions of peaks, it can be concluded that the elements Al and Cu exist in the form of Al2O3 and CuO. After ion etching for 570 s, the positions of Al 2 p peak and Cu 3 p peak have a displacement compared with top surface (before ion etching), as shown in Fig. 4(b). The Al 2 p peak and Cu 3 p peak at 72.6 eV and 75.1 eV indicate that the elements Al and Cu exist in the form of Al and Cu after ion etching. Moreover, a new peak at 69.2 eV is attributed to the increment in the element Ni content, which is fit to the composition change of surface layer after ion etching for a long time.
 | Fig. 3. O 1 s spectrum of as-cast Zr55Cu30Ni5Al10 BMG surface after ion etching for: (a) 0 s, (b) 570 s. |
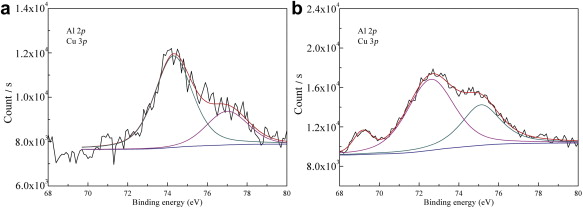 | Fig. 4. Al 2 p and Cu 3 p spectrum of as-cast Zr55Cu30Ni5Al10 BMG surface after ion etching for: (a) 0 s, (b) 570 s. |
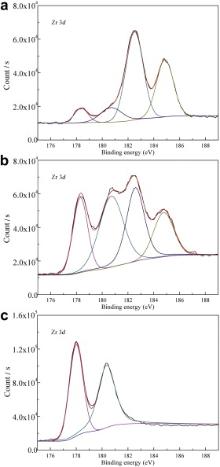
Fig. 5 shows Zr 3 d spectrum of as-cast Zr55Cu30Ni5Al10BMG specimen surface after ion etching for 0 s, 10 s and 570 s. The spectrum of Zr 3 d electron is a doublet of the Zr 3 d5/2 and 3 d3/2 peaks from metal Zirconium, which are at 178.3 eV and 180.6 eV, respectively. For ZrO2, the spectrum of Zr 3 d electron is also a doublet of the Zr 3 d5/2and 3 d3/2 peaks, which appear at 182.5 eV and 184.8 eV. According to Fig. 5(a), the element Zr exists mainly in the form of ZrO2with small amount of Zr before ion etching. After ion etching for 10 s, the proportion of the element Zr increases, while that of ZrO2decreases, as shown in Fig. 5(b). As the extension of ion etching time to 570 s, the element Zr exists mainly in form of Zr, and the content of ZrO2 is reduced to be non-detectable.
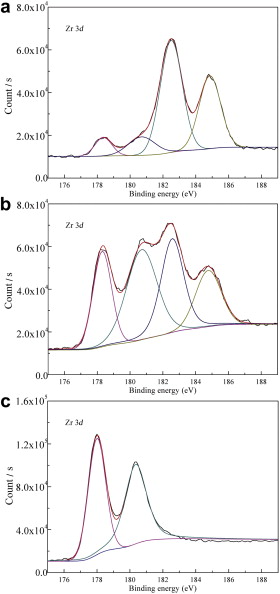 | Fig. 5. Zr 3 d spectrum of as-cast Zr55Cu30Ni5Al10 BMG surface after ion etching for: (a) 0 s, (b) 10 s, (c) 570 s. |
According to the results of XPS, the main components of Zr55Cu30Ni5Al10BMG oxide film are ZrO2and Al2O3. After ion etching, the content of metallic oxides decreases dramatically, indicating that ion etching plays an important role in the removing of metallic oxides and pollutants. In addition, the contents of elements Ni and Cu have an increment compared with the top surface (before ion etching). The extremely low content of Ni and Cu in surface layer before ion etching indicates that elements Al and Zr will be oxidized preferentially in the surface oxide film. According to the parameter of XPS, the argon ions energy is 3 keV in the depth profile, while the argon ions energy is 1 keV in the ion cleaning before diffusion bonding. Thus, the effect of ion etching in XPS detection can only reflect the trends of oxide film removal, and the specific ion cleaning time should be explored in IADB.
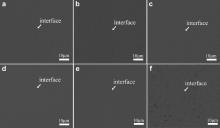
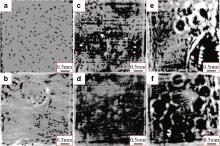
Fig. 6 shows the backscattered electron images of the joints bonded by IADB under 120 MPa for different time. When the holding time was 5 min, the interface of the joint exhibits an obvious weld, as shown in Fig. 6(a). When the holding time was extended to 10 min, the interface line becomes less obvious and discontinuous. With the extension of holding time, the interfaces line of the joints become not obvious, and the joints are devoid of imperfections such as cracks and voids, as shown in Fig. 6(c–e). However, the base metal crystallized when the diffusion bonding was carried out for 30 min, indicating that the thermal cycling for 30 min is too long to obtain an amorphous joint. It can be seen from Fig. 6(f) that some crystalline phases appear after diffusion bonding. According to XRD result, the crystalline phases are Zr2Ni, Zr2Cu and Cu10Zr7.
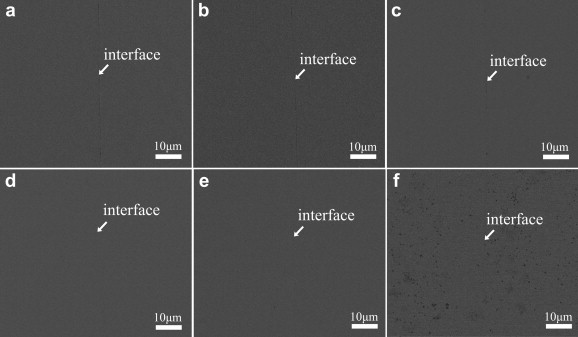 | Fig. 6. Backscattered electron images of the joints bonded by IADB under 120 MPa for different time: (a) 5 min, (b) 10 min, (c) 15 min, (d) 20 min, (e) 25 min, (f) 30 min. |
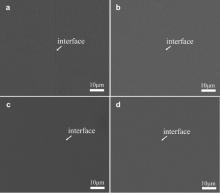
Fig. 7 illustrates the backscattered electron images of the joints bonded by IADB for 20 min under different pressures. When the bonding pressure is 40 MPa, the interface of the joint exhibits an incomplete weld, as shown in Fig. 7(a). The interface demonstrates that the bonding pressure of 40 MPa is not high enough to achieve the close contact between BMG specimens. With the increase in bonding pressure, the interface line becomes less and less obvious. When the bonding pressure was increased to 160 MPa, the interface line is difficult to be found in the backscattered electron image, as shown in Fig. 7(d). Moreover, no crystalline phase appears after diffusion bonding under all bonding pressures. The results indicate that the bonding pressure up to 160 MPa is still safe for amorphous structure.
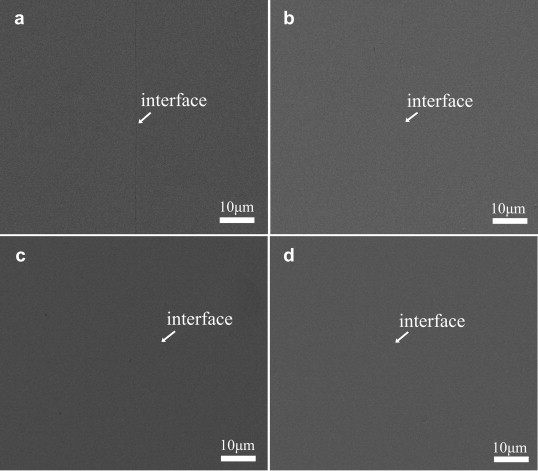 | Fig. 7. Backscattered electron images of the joints bonded by IADB for 20 min under different pressures: (a) 40 MPa, (b) 80 MPa, (c) 120 MPa, (d) 160 MPa. |
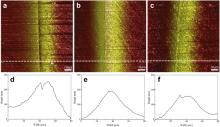
In our study, two methods, pre-friction treatment and ion cleaning, were used to break or remove the surface oxide film of specimens before diffusion bonding. In addition, conventional diffusion bonding was carried out for comparison. The interfaces of the joints bonded by FADB are similar with that by IADB. The joints bonded by conventional diffusion bonding under the same parameters all exhibit obvious slit between specimens. Thus, for simplicity, we show the joints bonded by three methods under the single parameter rather than all parameters. Fig. 8 shows the surface topography and the corresponding altitude curves of the joints bonded by three methods. Colors represent the difference of height, that is to say, dark red is for the lower altitude and orange is for the higher altitude in Fig. 8(a–c). According to the results of AFM, a slit distributes throughout the joint bonded by conventional diffusion bonding, as shown in Fig. 8(a). The height of the white line in Fig. 8(a) is shown in Fig. 8(d), which shows the slit at the interface clearly. The altitude near the interface is higher than that far away from the interface, which is generated during the polishing process. The difference of hardness resulted into the higher altitude of the region with higher hardness. According to the published literature [18] and [19], the hardness of most of BMG will have an increment with the structural relaxation of BMG. It can be found that the sound joint was obtained by IADB and FADB. Owing to the higher hardness, an obvious ridge appears at the interface of joint, as shown in Fig. 8(b and c). It can be found that the ridge at the interface of joint bonded by FADB is more obvious than that by IADB, which is attributed to the effect of friction on the structural relaxation and the flatness of interface. In addition, the corresponding altitude curves shown in Fig. 8(e and f) also illustrate the ridge at the interface. The surface topography demonstrates the interface of joints and the degree of structural relaxation near the interface.
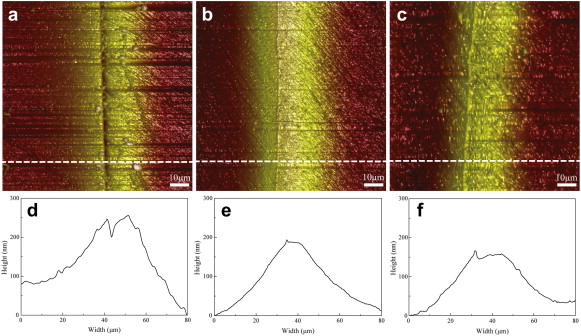 | Fig. 8. Surface topography and the corresponding altitude curve of the joints bonded by (a and d) conventional diffusion bonding (b and e) IADB (c and f) FADB under 120 MPa for 20 min. |
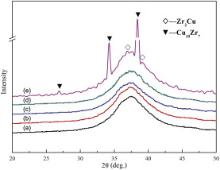
Due to the thermal cycling and straining, the structural relaxation, even crystallization will occur at the interface and in the base metal during the diffusion bonding. Fig. 9 shows the MF-XRD patterns of the interface of BMG joints bonded by IADB under 120 MPa for different time. Diffraction patterns (curves 1–4) all exhibit the same broad diffuse peak showing the existence of only amorphous phase. When the holding time was increased to 30 min, the diffraction pattern (curve 5) exhibits a diffuse peak with the diffraction peaks of Zr2Cu and Cu10Zr7, indicating that parts of BMG specimen crystallized after diffusion bonding for 30 min.
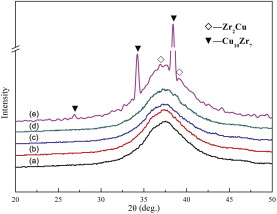 | Fig. 9. MF-XRD patterns of the interface of BMG joints bonded by IADB under 120 MPa for different time: (a) 10 min, (b) 15 min, (c) 20 min, (d) 25 min, (e) 30 min. |
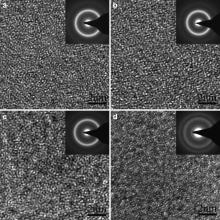
Fig. 10 shows the TEM bright field images and their corresponding SAED patterns of specimens taken from the interface of joints bonded by IADB under 120 MPa for different time. When the holding time is 10 min and 15 min, only diffuse halo rings are observed as shown in Fig. 10(a and b), which presents the typical characteristic of the amorphous structure. With the increase in holding time, the order of atomic arrangement of joint bonded for longer time increased compared with that for shorter time. Especially, a diffraction ring of crystalline phase can be found in SAED pattern as shown in Fig. 10(d) when the holding time was increased to 25 min. According to the above analysis, it can be concluded that the order degree of atomic arrangement increased with the increase in holding time. Although the result of MF-XRD indicates that the amorphous structure is retained when the holding time is 25 min, the order degree of atomic arrangement increases obviously compared with as-cast BMG. Therefore, in order to retain the amorphous structure, the longest holding time should be no more than 25 min.
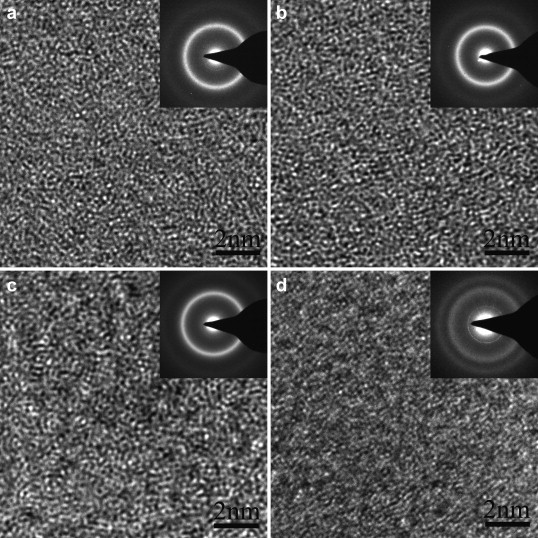 | Fig. 10. TEM bright field images and their corresponding SAED patterns of specimens taken from the interface of joints bonded by IADB under 120 MPa for different time: (a) 10 min, (b) 15 min, (c) 20 min, (d) 25 min. |
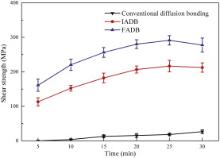
The shear strength is used to evaluate the joining quality of joints. Fig. 11 shows the effect of holding time on shear strength of joints bonded by the above three methods under 120 MPa. There are five parallel samples for one bonding parameter. It is found that the shear strength of joints bonded by all methods increases with the increase in holding time. As shown in Fig. 11, the shear strength of joints bonded by FADB and IADB is more higher than that by conventional diffusion bonding, indicating that the effects of pre-friction treatment and ion cleaning on the removal of oxide film are positive. Due to the existence of surface oxide film, the shear strength of joints bonded by conventional diffusion bonding is very small in micro-deformation conditions. According to the shear strength curves of joints bonded by IADB and FADB, it is clear that the shear strength increased dramatically in the initial stage (0–15 min), and then the rate of strength gain became more and more slow in the late stage (15–30 min). According to our previous study [16], the oxide film is the main barrier in the diffusion bonding. When the oxide film was removed or broken, plastic deformation played a major role in the diffusion bonding of BMG. Moreover, the contribution of plastic deformation on the void shrinkage became less with the increase in bonding time [18]. The theoretical residual oxide film ratio can be deduced by the shear strength of joints and BMG substrate. The shear strength of BMG substrate is 760 MPa. According to the theoretical model for diffusion bonding of BMG, the theoretical residual oxide film ratios of joints bonded by IADB and FADB are 69.1% and 59.7%, respectively.
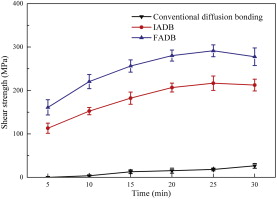 | Fig. 11. Effect of holding time on shear strength of joints bonded by three methods under 120 MPa. |
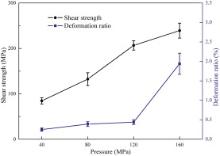
Fig. 12 shows the effect of bonding pressure on shear strength and deformation ratio of joints bonded by IADB. The joints were obtained by IADB under different bonding pressures for 20 min. According to the strength curve, the shear strength increases as the bonding pressure rises. However, the deformation ratio of specimens after diffusion bonding also increases with increasing bonding pressure. In order to ensure no obvious deformation occurs after diffusion bonding, the bonding pressure should be controlled precisely. It can be found that the deformation ratio of specimens is no more than 0.5% when the bonding pressure is less than 120 MPa, as shown in Fig. 12. When the bonding pressure is up to 160 MPa, the deformation ratio of specimens increased to 1.94% suddenly. Thus, the feasible bonding pressure should be less than 120 MPa.
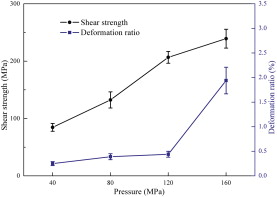 | Fig. 12. Effect of bonding pressure on shear strength and deformation ratio of joints bonded by IADB. |
Fig. 13 shows C-scan images of the interface of joints bonded by the above three methods under 120 MPa for 15 min and 20 min, respectively. The white and light gray regions are not bonded soundly, while the black and dark gray regions are bonded well. It has been reported that the oxide film is the main barrier in the diffusion bonding of BMG. Using the conventional diffusion bonding, the bonding rates of joints bonded for 15 min and 20 min are about 3.2% and 4.5%, respectively. From Fig. 13(a and b), it can be seen that the joints bonded by conventional diffusion bonding are in the form of point-to-point connection. The shear strength of joints bonded by conventional diffusion bonding is no more than 30 MPa, which is consistent with C-scan result. When the surface oxide film was removed by ion cleaning, the bonding rates of joints bonded for 15 min and 20 min are 24.8% and 30.7%, respectively. The C-scan image of interface layer in Fig. 13(c) illustrates that most of interface was still not bonded soundly when the bonding process lasted for 15 min. When the holding time was extended for 20 min, the bonding rate of the joint was increased to 30.7% as shown in Fig. 13(d). It can be seen that the bonded points in Fig. 13(c and d) are distributed uniformly in the interface, indicating that ion cleaning is effective in removing the oxide film. In addition, the advantage of ion cleaning is the even removal for the oxide film. When BMG specimens were bonded by FADB, the surface oxide film was broken by the friction of specimens. From Fig. 13(e and f), it can be seen that the oxide film was crushed and gathered together. Thus, it can be concluded that the specimens were bonded in the form of pieces connection. When the holding time lasted for 15 min and 20 min, the bonding rates of joints are about 31.4% and 43.5%, respectively. According to the result of ultrasonic inspection, the effect of pre-friction treatment and ion cleaning on the removal of oxide film is positive. It is feasible that the joining quality of BMG specimens is improved by removing or breaking the oxide film.
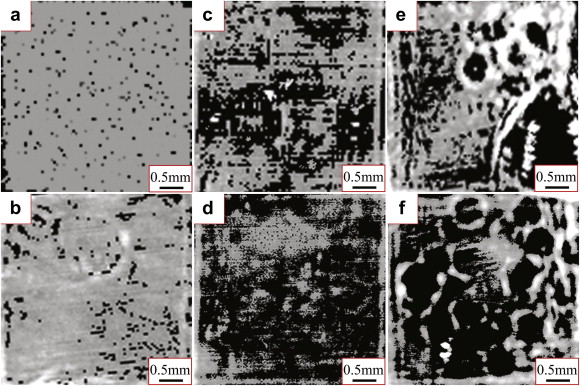 | Fig. 13. C-scan images of interface layers of joints bonded by different methods under 120 MPa for 15 min and 20 min, respectively: (a and b) conventional diffusion bonding, (c and d) IADB, (e and f) FADB. |
According to the theoretical model for diffusion bonding of BMG [20], the bonding rates of joints bonded by IADB and FADB are fit with the theoretical surface area fraction of oxide film of 69.1% and 59.7%, respectively. When the holding time is 20 min, the bonding rates of joints bonded by IADB and FADB are 30.7% and 43.5%, respectively. It can be seen that the actual surface area fraction of oxide film is close to the theoretical value. The result of ultrasonic inspection illustrates that the oxide film removal can improve the joining quality of joints of BMG indeed. The C-scan images also prove that the pre-friction treatment and ion cleaning can remove parts of the oxide film. According to the theoretical analysis, oxide film and low atomic diffusion coefficient are two main barriers during the diffusion bonding of BMG. Although the atomic diffusion coefficient doesn't be improved specially, the joining quality still has a drastic improvement by removing the surface oxide film. The sound joining of BMG is attributed to the removal of oxide film and the superplasticity of BMG. Once the oxide film was removed before joining, plastic deformation of BMG in the supercooled liquid region played a dominant role in the interfacial void shrinkage of joints. The sound joining is attributed to the superplasticity. Once the oxide film was removed completely before diffusion bonding, it is promising and convincing that a high-quality joint will be obtained.
In summary, the high-quality joints of bulk metallic glass were obtained by removing the oxide film before diffusion bonding. Additionally, the surface area fraction of oxide film on the interface of joints was detected. The following conclusions can be drawn:
(1) The main composition of oxide film on the surface of Zr55Cu30Ni5Al10 bulk metallic glass is Al2O3 and ZrO2. With the extension of ion etching time, the content of oxides decreases and the content of elements Cu and Ni increases to the corresponding values in the base metal.
(2) The shear strength of jointed bonded by IADB and FADB is much higher than that by conventional diffusion bonding. When the holding time is less than 20 min, no observable crystallization is detected by MF-XRD and TEM. When the bonding pressure is less than 120 MPa, the deformation ratio of joints is no more than 0.5%.
(3) The actual surface area fraction of oxide film in the interface of joints are fit with the theoretical values deduced from the shear strength of joints.
This work was financially supported by the National Natural Science Foundation of China (Grants Nos. 51275133 and 51021002).
| 1. |
|
| 2. |
|
| 3. |
|
| 4. |
|
| 5. |
|
| 6. |
|
| 7. |
|
| 8. |
|
| 9. |
|
| 10. |
|
| 11. |
|
| 12. |
|
| 13. |
|
| 14. |
|
| 15. |
|
| 16. |
|
| 17. |
|
| 18. |
|
| 19. |
|
| 20. |
|