Ceramic-reinforced metal matrix composites (MMCs) display beneficial properties owing to their combination of ceramic and metal phases. However, the properties are highly dependent on the reinforcing phase composition, volume fraction and morphology. Continuous fiber or network reinforcement morphologies are difficult and expensive to manufacture, and the often-used discontinuous particle or whisker reinforcement morphologies result in less effective properties. Here, we demonstrate the formation of a co-continuous ceramic-reinforced metal matrix composite using solid-state processing. Binder jet additive manufacturing (BJAM) was used to print a nickel superalloy part followed by post-processing via reactive sintering to form a continuous carbide reinforcing phase at the particle boundaries. The kinetics of reinforcement formation are investigated in order to develop a relationship between reactive sintering time, temperature and powder composition on the reinforcing phase thickness and volume fraction. To evaluate performance, the wear resistance of the reinforced BJAM alloy 625 MMC was compared to unreinforced BJAM alloy 625, demonstrating a 64 % decrease in the specific wear rate under abrasive wear conditions.
Pablo D. Enrique, Ehsan Marzbanrad, Yahya Mahmoodkhani, Ali Keshavarzkermani, Hashem Al Momani, Ehsan Toyserkani, Norman Y. Zhou. Design of binder jet additive manufactured co-continuous ceramic-reinforced metal matrix composites. Journal of Materials Science & Technology[J], 2020, 49(0): 81-90 DOI:10.1016/j.jmst.2020.01.053
1. Introduction
Ceramic-reinforced metal matrix composites (MMCs) consist of a ductile metal matrix and a reinforcing ceramic phase, offering a combination of beneficial properties from both phases. The result is often a high specific strength/stiffness, low co-efficient of thermal expansion, improved wear resistance over the unreinforced metal matrix and good fatigue/fracture properties [1,2]. The ability of the reinforcing phase to improve the properties of the metal matrix is highly dependent on its composition, distribution, morphology and volume fraction. Discontinuous reinforcement morphologies - which are the most used and most affordable type of MMC - provide only modest improvements in properties and can suffer from inhomogeneous distributions. Agglomeration of the ceramic reinforcing particles or whiskers occurs more readily during manufacturing at high volume fractions, which is detrimental to mechanical properties and wear resistance. Continuous fiber reinforced MMCs are also possible, which typically contain aligned high aspect ratio fibers embedded in a metal matrix. This unidirectional reinforcement morphology is continuous along the fiber axis, and as such displays improved properties in the fiber direction. Although layers with various orientations can be combined in the form of laminates, this typically results in beneficial properties along only two axis and suffers from adhesion issues between layers of the laminate. For beneficial properties in all three axis, continuous network reinforcement morphologies can be used. In co-continuous MMCs, the reinforcing phase and metal matrix form an interconnected network throughout the entire composite [3]. However, these morphologies are difficult to manufacture.
Fabrication of co-continuous metal/ceramic composites are typically done via reactive metal infiltration of ceramic preforms, also known as reactive metal penetration. One example is the reaction and infiltration of a cordierite preform (Mg2Al4Si5O18) with excess aluminum demonstrated by Manfredi et al. [4], resulting in a composite containing a silicon-rich aluminum metal phase and ceramic phases composed of aluminum oxide and magnesium-aluminum oxide. This process requires elevated temperatures to obtain a kinetically favoured reaction, good wetting characteristics, and a volume reduction upon reaction of the metal penetrant and ceramic preform to prevent blockage of the infiltration pathways. However, these processes demonstrate slow infiltration rates that limit part sizes due to processing time and production costs. In general, co-continuous ceramics often use lower melting point metals such as Cu or Al alloys to facilitate infiltration, although liquid exchange processes have been used to replace these metals with ones more suited to high temperature applications. As shown by Caccia et al. [5], WC preforms infiltrated with molten Zr2Cu react to form a molten Cu phase that is then removed, leaving behind solid W metal and ZrC ceramic. To avoid challenges associated with infiltration using higher melting point alloys, incompatible metal and ceramic preform combinations, slow infiltration rates, and the potential for poor wetting that leads to porosities during infiltration processes, a solid-state processing technique for the formation of co-continuous ceramics is desired.
Binder jet additive manufacturing (BJAM) is a solid-state process that selectively applies a liquid binder to a bed of powder. This is followed by the spreading of a new layer of powder, and the process is repeated to construct 3D parts in a layer-wise fashion [6]. These parts are then post-processed by de-binding and sintering at elevated temperatures. BJAM has been previously adapted for the fabrication of metal/ceramic composites, although the available literature remains limited. One technique demonstrated by Kernan et al. [7] relies on the use of ceramic and metal oxide powders, which are then reduced during post-processing to form the metal phase. Composites have also been manufactured by the layer-wise addition of a ceramic-loaded resin to a metal powder bed [8]. However, most of the literature focuses on a hybrid BJAM and infiltration technique to make composites, in which a ceramic preform is printed using BJAM and infiltration is used to introduce the metal matrix. This was demonstrated by Cramer et al. [9] with the infiltration of a B4C preform using Al and by Levy et al. [10] with the infiltration of TiC preforms using steel.
A new approach is presented for the solid-state BJAM of co-continuous MMCs, which form an interconnected reinforcing phase within a metal matrix. An in situ reactive sintering process occurs between a binder and metal powder, in which alloying elements within the metal powder react with carbon from the decomposed binder. In this work, a Ni-based alloy 625 metal powder is used so that Cr alloying elements react to form a Cr3C2 phase at the metal particle boundaries that extend throughout the manufactured part.
2. Materials and methods
2.1. Fabrication processes
2.1.1. Binder jet additive manufacturing
Spherical Inconel alloy 625 powder (24 μm average diameter) was used in a 3D SYSTEMS ZCorp Z 510/310 binder jetting powder-bed system to manufacture alloy 625 and alloy 625 MMC parts. As shown in a previous study [11] the alloy 625 parts are not reinforced and retain a nominal alloy 625 composition. Alloy 625 is a predominantly solid solution strengthened Ni superalloy, with notable quantities of Cr, Mo, Fe and Nb within the Ni matrix. After BJAM and reactive sintering, a previous study [12] has shown that the reinforced alloy 625 MMC parts form Cr, Mo, and Nb carbide reinforcements throughout the Ni matrix. The printing process for both the reinforced and unreinforced materials was the same, with the difference arising during the post-printing sintering process. Further details are available in the previous studies, although a summary is provided below. The binder (Zb60) was obtained from 3D SYSTEMS, and an analysis by Olivier et al. [13] in combination with the supplier provided data sheet indicates that it consists of water, a humectant (glycerol), a proprietary polymeric surfactant and 2-pyrrolidone. Printing parameters included a 70 μm layer height, 360 dpi resolution, and 100 % core and 200 % shell saturation. Immediately after printing, the samples were exposed to a 35 °C 3-hour drying step.
2.1.2. Post-processing
The difference between the samples arises during post-processing, where only the BJAM alloy 625 parts were subjected to a de-binding step. These parts were placed in an alumina crucible within a horizontal quartz tube furnace and a 3 °C/min ramp-up was performed in a hydrogen/argon (5 %/95 %) atmosphere to reach the 527 °C de-binding temperature. A hold time of 3 h was used, after which the atmosphere was switched to 5.0 grade, high purity argon. A final temperature of 1200 °C was reached with a ramp speed of 5 °C/min and held for 5 h. Samples were removed from the furnace at this temperature and immediately water quenched.
The BJAM alloy 625 MMC parts were subjected to a 5.0 grade, high purity argon atmosphere and 5 °C/min ramp rate from room temperature. The temperature was increased directly to 1200 °C and held for 5 h, without the 3 h hold period at the 527 °C de-binding temperature. At the conclusion of reactive sintering, water quenching was used.
2.1.3. Growth kinetics samples
Samples for measuring the kinetics of reinforcement phase growth were prepared by pipetting Zb60 binder onto cast alloy 625 specimens with 7 mm by 7 mm dimensions and 1.5 mm thickness. The binder was added 25 mL at a time to the surface and allowed to dry between subsequent depositions. A total of 100 mL of binder was applied to each surface. These samples were then subjected to the same post-processing as BJAM alloy 625 MMCs, using the same ramp rate and atmosphere but varying the final hold temperature (1100-1200 °C) and hold duration (0-9 h). This process was repeated once at a hold temperature of 1200 °C and a time of 3 h with the use of graphite powder instead of Zb60 binder.
2.2. Characterization and testing
2.2.1. Characterization methods
Scanning electron microscopy (SEM) was performed with a Zeiss UltraPlus SEM with an AMETEK EDAX Apollo XL energy-dispersive X-ray spectroscopy (EDX) attachment. All SEM analysis was performed with a 60 μm aperture, 20 kV accelerating voltage and 9 mm working distance. A JEOL 7000F SEM with an Oxford Electron backscatter diffraction (EBSD) detector was used for EBSD analysis. Measurements of carbide growth kinetics on cast alloy 625 samples were performed by cross sectioning the samples, imaging the cross sections using an Oxford BX51M optical microscope (OM), and measuring the carbide thickness using ImageJ software. An average of 110 individual measurements of carbide thickness are made for each sample from a minimum of 5 images. MATLAB was then used for analyzing the results and curve fitting.
2.2.2. Wear testing
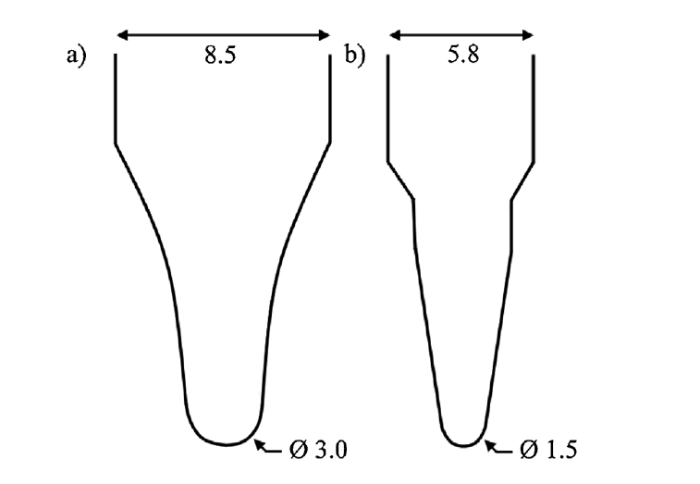
Abrasive wear testing was performed on an in-house linear wear tester. Samples of BJAM alloy 625 and BJAM alloy 625 MMC were prepared by grinding and flattening the surface using up to 600 grit SiC paper. The samples were fixed to a stage and an abrasive ZrO2 pin was moved in a linear motion along the sample surface. Testing was also repeated with an abrasive Si3N4 pin, and 3 wear tests were performed for each pin/sample combination. The pin shapes are cylindrical with a spherical contact point as shown in Fig. 1. During wear testing, only the spherical pin surface contacts the sample to be tested.
Fig. 1.
Wear pin dimensions in mm for a) ZrO2 and b) Si3N4.
A one kg load was applied to the abrasive pin with a pin travel distance of 7 mm in one direction (14 mm for a full back and forth cycle) and a travel speed of 20 mm/s. A total of 100 cycles were used for tests with the ZrO2 pins and 200 cycles were used with the Si3N4 pins. Measurements of the wear track profiles were obtained using a Wyko NT1100 optical profiling system and were further analyzed in MATLAB to determine volume loss.
3. Results and discussion
3.1. Reinforcing phase formation
3.1.1. Microstructure
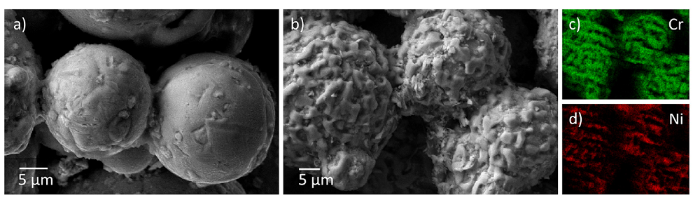
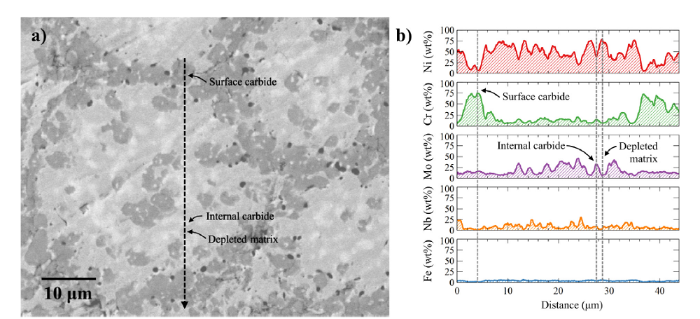
SEM images of alloy 625’s sintered surface after the use of a de-binding step shows a smooth profile (Fig. 2a), whereas the reactive sintered alloy 625 MMC surface consists of a Cr-rich phase (Fig. 2b). The phase does not fully envelop the particle, with some Ni detectible between the Cr-rich phase using EDX (Fig. 2c, d). A previous study [12] used XRD to identify the composition of the Cr-rich phase as Cr3C2, as well as identifying the presence of internal carbides (Mo2C and NbC) within the particle. This is supported in the current work using two additional techniques (EDX and EBSD) that identify the location of the phases and their composition. The cross-section of a sintered BJAM alloy 625 part in Fig. 3a and EDX line scan in Fig. 3b confirms that a Cr-rich region forms around the surface of the individual powder particles that make up the larger printed part. Additionally, Nb and Mo-rich phases are confirmed to exist within the particles. EBSD results presented in Fig. 4a support the previous XRD results by confirming the presence of a Cr3C2 phase around each particle and a Mo2C phase within each particle. Ni and NbC were indistinguishable via EBSD due to their similar crystallographic structure and attempts to detect other Cr carbides (such as Cr23C6 and Cr7C3) indicate that only Cr3C2 is present. Based on the Cr-C phase diagram and exposure of these samples to a temperature of 1200 °C for 5 h, formation of the Cr3C2 phase is expected with a localized C concentration of >40 at%. The high number of Mo and Nb carbides within the particle core suggests that significant inward diffusion of carbon occurs during the reactive sintering process.
Fig. 2.
SEM images of particles on surface of a) BJAM alloy 625, b) BJAM alloy 625 MMC, and EDX scans of the MMC surface showing c) Cr and d) Ni concentration.
Fig. 4.
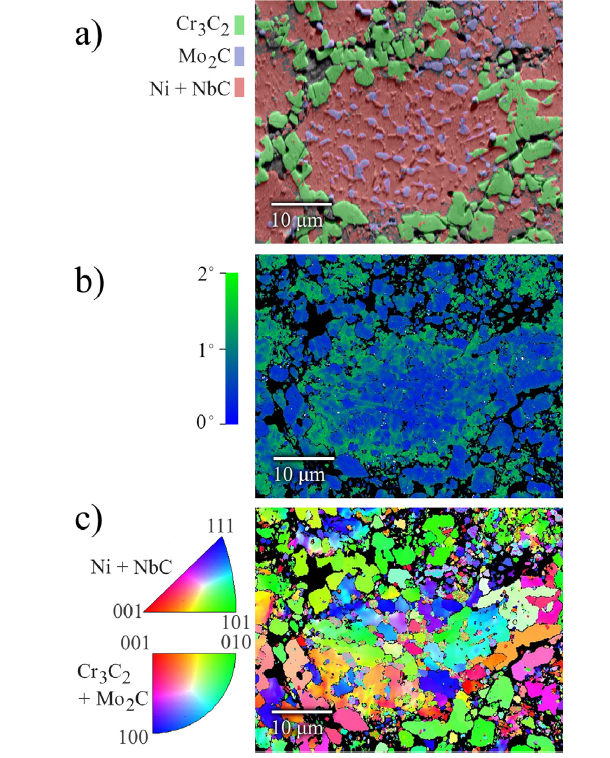
a) EBSD images of the cross-sectioned MMC showing a) a phase map, b) a kernel average misorientation map, and c) a crystal orientation inverse pole figure map.
Closer analysis of the EDX results in Fig. 3b shows overlap in the Mo and Cr peaks. This is especially true within the lighter internal carbide (Mo2C) in the core of the particle (Fig. 3a), suggesting that some substitution of elements is occurring. Within the Cr3C2 growing on the powder surface (Fig. 3b), 20 wt% of Mo is identified via EDX, suggesting that the Cr3C2 phase contains approximately 17 wt% Mo when the contribution of C to weight is also considered. Using threshold image analysis, the volume fraction of the Cr3C2 reinforcing phase was determined to be 25.4 ± 4 vol.%. This is further supported by the 24.1 vol.% of Cr3C2 measured in the EBSD results in Fig. 4a. However, some inaccuracy is expected due to difficulties with sample preparation; during grinding and polishing, carbides at the surface fracture and leave behind small pores that can influence measures of carbide volume fraction.
Kernel average misorientation maps (Fig. 4b) show an increasing misorientation gradient extending from the center of the Ni powder to the surface, with very little misorientation detected in the Cr3C2 phase. Most of the misorientation is below 2°, which Humphreys et al. [14] indicates will result in low grain boundary mobility. In addition, the formation of a significant amount of internal Mo2C and NbC prohibits the migration of low and high angle grain boundaries. As such, no recrystallized grains or annealing twins are detected in the Ni matrix (Fig. 4c) and the Ni matrix grain size does not significantly change during the reactive sintering process.
With the formation of Cr, Mo and Nb carbide phases, the Ni matrix - which was initially alloy 625 - has been partially depleted of alloying elements. The final composition of the depleted matrix is compared to a nominal alloy 625 [15], the initial alloy 625 powder [11], and Hastelloy N [16] in Table 1. The increase in Ni concentration and decrease in Cr make the depleted matrix similar to that of Hastelloy N, although the reduced Mo and greater Fe likely result in reduced solid solution strengthening and reduced corrosion resistance.
Table 1
Table 1Comparison of compositions (wt%) excluding minor alloying elements.
To better understand the growth kinetics of the interdiffusion reaction layer that forms between the zb60 binder and alloy 625 during sintering, a set of cast alloy 625 samples coated with an excess quantity of zb60 binder were prepared. The resulting serrated morphology at the carbide-matrix interface shown in Fig. 5a is attributed to anisotropic diffusion/growth along preferred crystallographic orientations, as reported by Cheng and Wang [17] for other interdiffusion reaction layers and by Tang et al. [18] in carbide growth within Ni alloys. Also visible on the surface is a network-like structure, shown in Fig. 5b. Visual similarities were found in the microstructure between the carbide that formed on the cast alloy 625 diffusion test specimens and the carbide shell seen in the BJAM alloy 625 MMCs (Fig. 5c, d). Both the test specimens and the powder particles formed a network structure, and the same microstructure was obtained on the cast alloy 625 specimens with the use of graphite powder instead of zb60 binder. This suggests that the binder behaves similar to carbon at elevated temperatures. Since this binder is used to hold the powder particles together during the BJAM process, the growth of this reaction layer occurs around each particle throughout the entire part and is not limited to only the surface of the part.
Fig. 5.
SEM images of a Cr3C2 coating on a cast alloy 625 specimen after 3 h at 1200 °C showing a) the cross section of the coating and b) the top surface of the coating, compared to SEM images of c) a particle with a Cr3C2 shell and d) a magnified view of the shell using a backscatter detector.
3.1.2. Growth kinetics of Cr3C2 on alloy 625
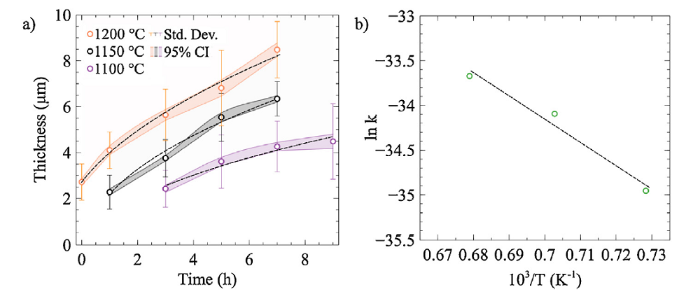
Increasing temperatures and increasing time both result in the formation of a thicker Cr3C2 coating on cast alloy 625 specimens. The coating thickness (d) is described by Eq. (1) using a growth rate constant (k), an initial coating thickness term (d0), a time dependence (t), and Eq. (2), which introduces a temperature dependence (T) for k using the Arrhenius equation. These two equations are commonly used in literature to determine the growth rate of diffusion coatings, as shown by Arai [19] for the growth of VC, NbC, TiC and Cr7C3, by Devincent and Michal [20] for the reaction layer between graphite and copper-chromium, and by Sen [21] for the growth of Cr carbide layers on steel substrates.
The growth rate constant is also dependent on an activation energy (Ea), a pre-exponential factor (k0) and the gas constant (Rg). With an exponent of n equal to 2, Eq. (1) becomes parabolic and the fitted parameters (Table 2) closely describe the measured coating thickness (Fig. 6a). The very close fit (R2=0.99) between the experimental data and parabolic growth kinetics suggests that diffusion is the rate-controlling mechanism for Cr3C2 growth. The calculated growth rate constants in Table 2 can be compared to the diffusion coefficients reported by Mayr et al. [22] for Cr-C diffusion couples. A value of 5.0 × 10⁻¹⁵ was reported for the diffusion coefficient of C in a Cr3C2 reaction layer at 1262 °C, which is similar to the 2.38 × 10⁻¹⁵ obtained in this study at 1200 °C. This suggests that C diffusion through Cr3C2 is the limiting diffusion species, with the small discrepancy attributed to the different temperature and the presence of Mo within the Cr3C2 phase. No literature data was found for the diffusion coefficient of Cr in Cr3C2, although a study by Glowacki and Kaluba [23] on the diffusion through Cr carbide reaction layers in graphite and Fe-C alloys shows that some conditions are Cr diffusion limited and others are C diffusion limited. In the case where a chromizing medium is in contact with a graphite layer, C diffusion through the carbide reaction layer and towards the chromizing medium is found to be limiting. This closely reflects the conditions in this study, with the decomposed binder acting as the graphite layer and the alloy 625 acting as the chromizing medium. Observations of the cast (Fig. 5a) and BJAM samples (Fig. 3a) show carbide growth into the alloy 625, further supporting that carbon diffusion inwards is the limiting factor.
Table 2
Table 2Fitted model parameters for Eq. (1) obtained from Fig. 6a.
Fig. 6.
a) Thickness of the Cr3C2 coating on cast alloy 625 as a function of time at various temperatures and b) an Arrhenius plot showing the logarithm of the growth rate constant as a function of the inverse temperature.
With the use of k values shown in Table 2, an Arrhenius plot is constructed (Fig. 6b) and the activation energy (Ea) and pre-exponential factor (k0) in Eq. (2) for the diffusion-controlled growth of the carbide is determined (Table 3). These values are also closely related to those of C diffusion in Cr3C2 reported by Mayr et al. [22], further supporting that C diffusion through the Cr3C2 layer is the limiting factor.
Table 3
Table 3Fitted model parameters for Eq. (2) obtained from Fig. 6b.
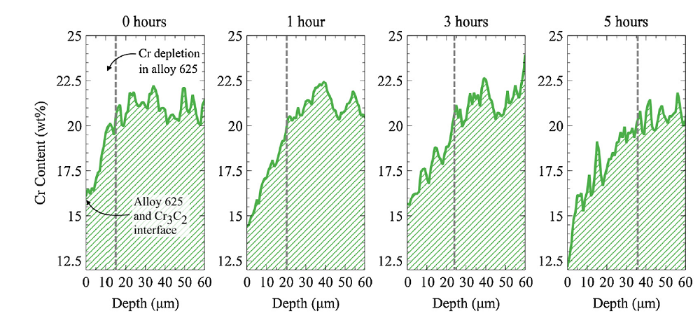
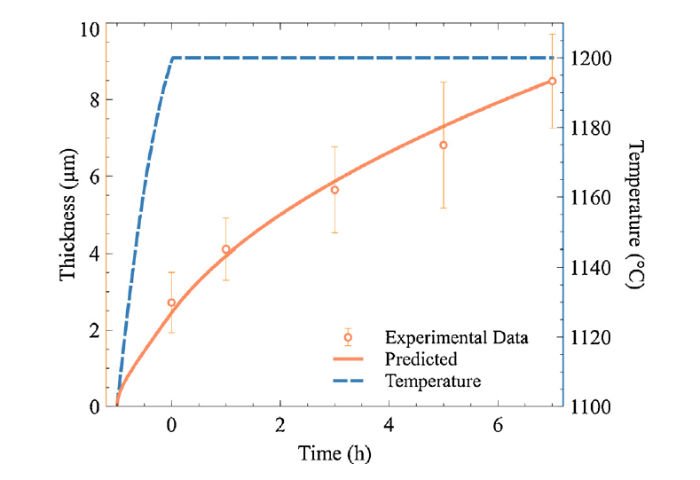
As can be seen in Fig. 6, Fig. 7, the Cr3C2 begins to grow (and Cr begins to deplete from the matrix) prior to reaching a temperature of 1200 °C such that the thickness is nonzero at t=0. The calculated temperature dependence of k (Eq. (2) and Table 3) allows for a better understanding of the Cr3C2 growth during furnace temperature ramp up. The temperature profile within the furnace during the initial ramp was recorded and used in Eq. (3) to determine the shell thickness as a function of the temperature at time t. Eq. (3) uses the instantaneous growth of the Cr3C2 shell and the shell thickness in the previous time step (dt-Δt) to determine the new shell thickness (dt). The temperature dependence of k closely explains the initial Cr3C2 thickness at t=0, as shown in Fig. 8.
Fig. 7.
EDX line scans of cast alloy 625 samples with zb60 coatings exposed to 1200 °C showing Cr depletion over time as a function of distance from the carbide-matrix interface.
Fig. 8.
Cr3C2 growth during furnace ramp up (t<0) and at hold temperature of 1200 °C.
3.2. Design considerations
Unlike the cast samples used to determine the Cr3C2 growth kinetics, BJAM samples have a more limited supply of Cr due to the small powder particle size and a supply of C limited by the quantity of binder used. Cr and C depletion as the carbide shell grows likely results in progressively slower growth. Additionally, diffusion occurs in a 3D spherical domain as opposed to the 1D diffusion that occurs between the two flat diffusion couple layers in the cast samples. Since the growth kinetics were determined in conditions with excess Cr and C, those results provide an upper bound for the thickness of the carbide shell in reactively sintered BJAM alloy 625 samples. Another limitation of these growth kinetics results is due to the presence of Mo in the Cr3C2, which literature suggests is substituted at Cr sites within the Cr3C2 structure [24] and may influence diffusion during the carbide growth. Although the effect of Mo is present in both cast and BJAM samples due to their similar composition, care must be taken when extending the growth kinetics results to other Ni alloys without Mo.
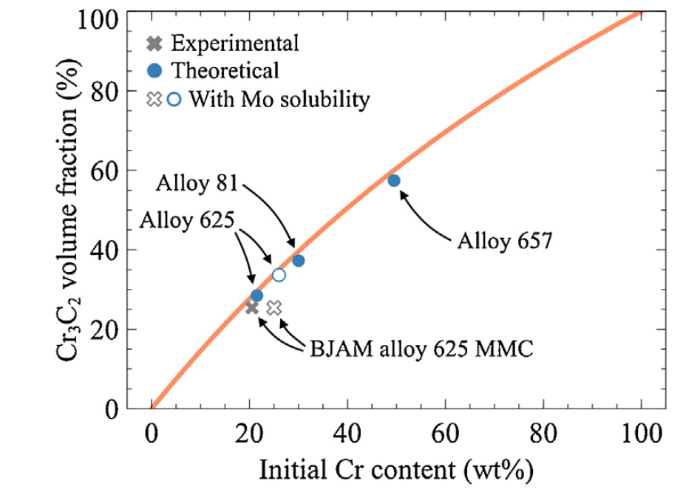
Regardless of the rate at which the shell forms, the quantity of Cr in the starting powder particle also provides an upper limit on the volume fraction of a Cr3C2 reinforcing phase that can form. Neglecting the substitution of other elements into the shell (such as Mo) and the substitution of Cr into other phases (such as Mo2C), the upper limit on the achievable volume fraction of a Cr3C2 shell assuming Cr content is the limiting factor can be determined. The volume of the Cr3C2 reinforcing phase (Vcr3C2) is calculated using Eq. (4) and the volume fraction (Vfrac) is calculated using Eq. (5). The dependence of maximum Vfrac on the available Cr is represented in Fig. 9 by the solid curve.
where Vp, and ρp are the initial alloy 625 particle’s volume (m3) and density (g/m3), Cp is the mass fraction of Cr in the initial metal powder, ρCr3C2 is the density of Cr3C2 (g/m3), and CCr3C2 is the mass fraction of Cr in the Cr3C2 reinforcing phase. The value of ρp is approximated in Eq. (6) using a mass fraction weighted combination of the density of Cr (ρCr) and the density of Ni (ρNi) as previously shown by Callister and Rethwisch [25], assuming the remainder of the alloy is pure Ni.
Fig. 9.
Maximum Cr3C2 shell volume fraction achievable with varying Cr concentrations in the starting powder. Values for some Ni-based alloys and the current study’s MMC are shown, with adjustments (no-fill shapes) for Mo solubility in the Cr3C2 shell.
The value of ρp is used to determine the mass of one powder particle (Vpρp) and the mass of Cr within the particle (VpρpCp). With the use of a Cr mass balance equating the Cr content in Cr3C2 with the Cr content in the particle, the volume of Cr3C2 is determined (and Eq. (4) is derived). When determining Vfrac (Eq. (5)), the volume of Cr3C2 is divided by a sum of the volume of Cr3C2 and the initial powder, minus the volume of Cr used to form the Cr3C2.
The orange line in Fig. 9 is obtained using Eqs. (4) and (5), which shows the predicted maximum Cr3C2 volume fraction possible with varying starting Cr content in the powder. This prediction depends on the approximation in Eq. (6), which assumes the alloy only contains Ni and Cr. The maximum expected volume fraction is also calculated for three nickel-based alloys labelled in Fig. 9 (blue fill dots), including the alloy used in this study (alloy 625) and two others with higher Cr content: alloy 81 (30 wt% Cr) and alloy 657 (50 wt% Cr). For these results, Vfrac was determined with the alloy’s actual density, although their proximity to the approximated maximum Vfrac curve suggests that Eq. (6) is appropriate for alloys mostly composed of Cr and Ni.
Alloys with higher Cr content than alloy 625 allow for further design freedom. Longer reactive sintering times can be used to obtain Ni-based MMCs with larger reinforcing volume fractions, or equivalent reactive sintering times can be used to retain more Cr content in the matrix and allow for usage at high temperatures in more corrosive environments. Control of the carbon content by adjusting the saturation level of the binder or using other binder compositions can also limit the amount of reinforcing phase that forms, as opposed to this study’s use of reactive sintering time as the controlling variable.
The volume fraction experimentally determined for the BJAM alloy 625 MMC in this study is also included in Fig. 9. Although the Cr content remaining in the matrix was measured at 7.4 wt% (Table 1), the Cr3C2 volume fraction appears close to the theoretical maximum. This discrepancy can be partly attributed to Mo substitution in the reinforcing carbide shell, which contributes to reinforcing shell formation and therefore increases the possible volume fraction. This can be considered in the volume fraction estimate by using an “equivalent” initial Cr content that includes Mo, assuming 17 wt% substitution into the Cr3C2 phase as seen in Fig. 3b. The result of this adjustment is shown in Fig. 9 (no-fill shapes) for the nominal alloy 625 and experimental BJAM alloy 625 MMC. Unlike alloy 625, alloy 81 and alloy 657 do not contain any Mo, such that their reinforcement volume fraction predictions do not require adjustment.
3.3. Wear behaviour
Three primary wear mechanisms have been used to model MMCs by Lee et al. [26]: plowing, interface or reinforcement cracking, and complete particle removal. The distribution and size of reinforcing particles are known to influence these wear mechanisms. If the depth of penetration by the abrasive pin is greater than the reinforcement size, plowing is typically more dominant. With larger reinforcements or shallower penetration, Lee et al. [26] indicate that interface or reinforcement cracking can be expected to dominate the wear mechanism. Kumar and Balasubramanian [27] have demonstrated this effect in a SiC particle reinforced aluminum alloy, where an increase in the reinforcing particle size decreasing the extent of plowing. Unfortunately, Diler and Ipek [28] show that these materials are also more susceptible to agglomeration at higher volume fractions during manufacturing than those with smaller reinforcing particles. The network microstructure of the BJAM alloy 625 MMC is expected to alleviate some of these issues; the small NbC and Mo2C particles act to reinforce the material within the nickel matrix, while the interconnected shell prevents deep penetration of the abrasive pin that would result in a plowing action and removal of the small carbides.
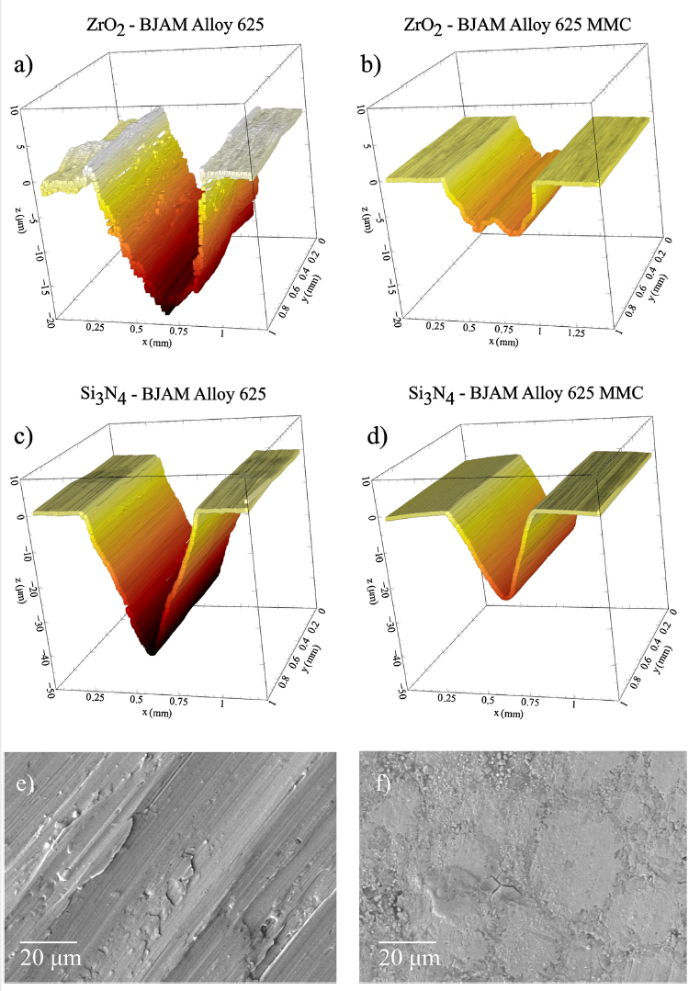
An analysis of wear testing results presented in Fig. 10 show a significant reduction in wear rate for the BJAM alloy 625 MMC when compared to unreinforced BJAM alloy 625. The wear track is significantly shallower for the MMC, regardless of which abrasive pin material is used. To better quantify the difference in wear rate, the specific wear rate coefficient (kw) is calculated using Eq. (7) as demonstrated by Holmberg and Matthews [29],
${{k}_{w}}=\frac{V}{F\times s}$
were V is the wear volume (m3), F is the applied normal load (N) and s is the pin travel distance (m). Using the wear track profiles in Fig. 10, values for the wear coefficient are calculated and presented in Table 4. The specific wear rate coefficient ratios between the BJAM alloy 625 and the BJAM alloy 625 MMC are similar when using ZrO2 or Si3N4 wear pin materials; the composite experiences a greater resistance to wear with a specific wear rate 68 % or 60 % lower, respectively, than that of the unreinforced BJAM alloy 625 under the current test conditions.
Fig. 10.
Wear profiles using ZrO2 on a) BJAM alloy 625, b) BJAM alloy 625 MMC, and using Si3N4 on c) BJAM alloy 625 and d) BJAM alloy 625 MMC. Wear tracks are shown from e) conditions in (a), and f) conditions in (b).
The wear tracks show a clear difference between the two BJAM materials, with deep grooves and indications of plastic deformation in the wear track of unreinforced BJAM alloy 625 (Fig. 10e). By comparison, the BJAM alloy 625 MMC had a smoother wear track and no indications of plastic deformation. This suggests that the wear mechanism changes with the introduction of reinforcements from one dominated by plastic deformation of the nickel matrix to one dominated by surface cracking of the reinforcements.
Three regions are of interest in understanding how this MMC behaves during wear: within the reinforcing phases (Cr3C2 and Mo2C), within the Ni matrix, and at the interface between the carbides and matrix. The presence of cracking in the Cr3C2 shell and interior carbide particles is shown in Fig. 11a, which indicate that they jointly contribute to the increased wear resistance of the composite material. These cracks result in fragmentation of the reinforcement, which break off and contribute to mass loss. As proposed in wear models for MMCs [26], failure typically begins at the interface between the matrix and reinforcing phases. This is due to penetration of the wear pin into the soft matrix, which then catches on reinforcing phases and causes “roll-out” via a plowing mechanism.
Fig. 11.
a) Backscatter SEM image of the MMC after wear testing and b) SEM image of tilted MMC sample after wear testing.
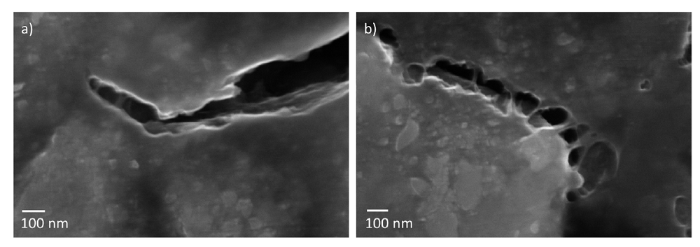
In composites with a continuous reinforcing phase, a different mechanism has been proposed by Larsson et al. [30]; reduced surface indentation of the wear pin due to distributed loading on a rigid network - in this case, the Cr3C2 phase - results in surface fatigue cracking within the reinforcement. Evidence of this can be seen in Fig. 11b, where a heavily cracked Cr3C2 phase still displays an intact Cr3C2-matrix interface. In the situations where these cracks reach the Cr3C2-matrix interface (Fig. 12a), crack deflection along the interface occurs likely due to the higher fracture toughness of the Ni matrix. Cracks that continue to propagate along the Cr3C2-matrix interface show signs of crack growth via pore coalescence, as seen in Fig. 12b. These small voids are the result of interface decohesion, which Tvergaard [31] describes as leading to material failure by void coalescence due to plastic yielding (necking) in the inter-void region. Therefore, although the MMC’s Ni matrix is depleted of solid solution strengthening elements that typically contribute to increased strength and wear resistance [32], the wear rate is limited by the slower process of reinforcement cracking and removal.
Fig. 12.
SEM image of MMC showing a) crack propagation in the Cr3C2 phase blunted by the Ni matrix and b) plastic deformation at the Ni-Cr3C2 interface.
4. Conclusions
The use of binder jetting and reactive sintering post-processing to form co-continuous ceramic-reinforced metal matrix composites was demonstrated. During reactive sintering of alloy 625, a reaction between the Cr alloying element in the alloy 625 particles and the binder forms an interconnected reinforcing Cr3C2 phase throughout the Ni matrix.
•A measure of Cr3C2 growth between 1100 °C and 1200 °C suggests that the process is diffusion limited, with good fit demonstrated for parabolic growth kinetics and an activation energy of 216 kJ mol-1.
•The quantity of Cr in the starting alloy 625 powder was used to predict the volume fraction of the Cr3C2 shell, with adjustments made for the presence of Mo in the shell. The measured shell volume fraction was 25.4 % after a 5 h reactive sintering process, with 7.4 wt% Cr in the resulting Ni matrix. This compares to the expected maximum volume fraction of 32.5 % at longer reactive sintering durations, demonstrating the use of reactive sintering time and starting alloy composition as methods to control reinforcing phase volume fraction and Cr sensitization of the matrix.
•Wear tests show an average 64 % decrease in the specific wear rate of the BJAM alloy 625 MMC when compared to unreinforced BJAM alloy 625. Both the carbide reinforcement shell and small carbides within the Ni matrix experience cracking during wear testing, with surface fatigue cracking identified as the wear mechanism. This is attributed to the continuous reinforcing phase morphology, which prevents removal of the reinforcing phase by the typical plowing mechanism.
Acknowledgments
This work was performed with funding support from the Natural Sciences and Engineering Research Council of Canada (NSERC), the Canada Research Chairs (CRC) Program, Huys Industries and the CWB Welding Foundation, in collaboration with the Centre for Advanced Materials Joining and the Multi-Scale Additive Manufacturing Lab at the University of Waterloo.
... Ceramic-reinforced metal matrix composites (MMCs) consist of a ductile metal matrix and a reinforcing ceramic phase, offering a combination of beneficial properties from both phases. The result is often a high specific strength/stiffness, low co-efficient of thermal expansion, improved wear resistance over the unreinforced metal matrix and good fatigue/fracture properties [1,2]. The ability of the reinforcing phase to improve the properties of the metal matrix is highly dependent on its composition, distribution, morphology and volume fraction. Discontinuous reinforcement morphologies - which are the most used and most affordable type of MMC - provide only modest improvements in properties and can suffer from inhomogeneous distributions. Agglomeration of the ceramic reinforcing particles or whiskers occurs more readily during manufacturing at high volume fractions, which is detrimental to mechanical properties and wear resistance. Continuous fiber reinforced MMCs are also possible, which typically contain aligned high aspect ratio fibers embedded in a metal matrix. This unidirectional reinforcement morphology is continuous along the fiber axis, and as such displays improved properties in the fiber direction. Although layers with various orientations can be combined in the form of laminates, this typically results in beneficial properties along only two axis and suffers from adhesion issues between layers of the laminate. For beneficial properties in all three axis, continuous network reinforcement morphologies can be used. In co-continuous MMCs, the reinforcing phase and metal matrix form an interconnected network throughout the entire composite [3]. However, these morphologies are difficult to manufacture. ...
1
2016
... Ceramic-reinforced metal matrix composites (MMCs) consist of a ductile metal matrix and a reinforcing ceramic phase, offering a combination of beneficial properties from both phases. The result is often a high specific strength/stiffness, low co-efficient of thermal expansion, improved wear resistance over the unreinforced metal matrix and good fatigue/fracture properties [1,2]. The ability of the reinforcing phase to improve the properties of the metal matrix is highly dependent on its composition, distribution, morphology and volume fraction. Discontinuous reinforcement morphologies - which are the most used and most affordable type of MMC - provide only modest improvements in properties and can suffer from inhomogeneous distributions. Agglomeration of the ceramic reinforcing particles or whiskers occurs more readily during manufacturing at high volume fractions, which is detrimental to mechanical properties and wear resistance. Continuous fiber reinforced MMCs are also possible, which typically contain aligned high aspect ratio fibers embedded in a metal matrix. This unidirectional reinforcement morphology is continuous along the fiber axis, and as such displays improved properties in the fiber direction. Although layers with various orientations can be combined in the form of laminates, this typically results in beneficial properties along only two axis and suffers from adhesion issues between layers of the laminate. For beneficial properties in all three axis, continuous network reinforcement morphologies can be used. In co-continuous MMCs, the reinforcing phase and metal matrix form an interconnected network throughout the entire composite [3]. However, these morphologies are difficult to manufacture. ...
1
2006
... Ceramic-reinforced metal matrix composites (MMCs) consist of a ductile metal matrix and a reinforcing ceramic phase, offering a combination of beneficial properties from both phases. The result is often a high specific strength/stiffness, low co-efficient of thermal expansion, improved wear resistance over the unreinforced metal matrix and good fatigue/fracture properties [1,2]. The ability of the reinforcing phase to improve the properties of the metal matrix is highly dependent on its composition, distribution, morphology and volume fraction. Discontinuous reinforcement morphologies - which are the most used and most affordable type of MMC - provide only modest improvements in properties and can suffer from inhomogeneous distributions. Agglomeration of the ceramic reinforcing particles or whiskers occurs more readily during manufacturing at high volume fractions, which is detrimental to mechanical properties and wear resistance. Continuous fiber reinforced MMCs are also possible, which typically contain aligned high aspect ratio fibers embedded in a metal matrix. This unidirectional reinforcement morphology is continuous along the fiber axis, and as such displays improved properties in the fiber direction. Although layers with various orientations can be combined in the form of laminates, this typically results in beneficial properties along only two axis and suffers from adhesion issues between layers of the laminate. For beneficial properties in all three axis, continuous network reinforcement morphologies can be used. In co-continuous MMCs, the reinforcing phase and metal matrix form an interconnected network throughout the entire composite [3]. However, these morphologies are difficult to manufacture. ...
1
2010
... Fabrication of co-continuous metal/ceramic composites are typically done via reactive metal infiltration of ceramic preforms, also known as reactive metal penetration. One example is the reaction and infiltration of a cordierite preform (Mg2Al4Si5O18) with excess aluminum demonstrated by Manfredi et al. [4], resulting in a composite containing a silicon-rich aluminum metal phase and ceramic phases composed of aluminum oxide and magnesium-aluminum oxide. This process requires elevated temperatures to obtain a kinetically favoured reaction, good wetting characteristics, and a volume reduction upon reaction of the metal penetrant and ceramic preform to prevent blockage of the infiltration pathways. However, these processes demonstrate slow infiltration rates that limit part sizes due to processing time and production costs. In general, co-continuous ceramics often use lower melting point metals such as Cu or Al alloys to facilitate infiltration, although liquid exchange processes have been used to replace these metals with ones more suited to high temperature applications. As shown by Caccia et al. [5], WC preforms infiltrated with molten Zr2Cu react to form a molten Cu phase that is then removed, leaving behind solid W metal and ZrC ceramic. To avoid challenges associated with infiltration using higher melting point alloys, incompatible metal and ceramic preform combinations, slow infiltration rates, and the potential for poor wetting that leads to porosities during infiltration processes, a solid-state processing technique for the formation of co-continuous ceramics is desired. ...
1
2018
... Binder jet additive manufacturing (BJAM) is a solid-state process that selectively applies a liquid binder to a bed of powder. This is followed by the spreading of a new layer of powder, and the process is repeated to construct 3D parts in a layer-wise fashion [6]. These parts are then post-processed by de-binding and sintering at elevated temperatures. BJAM has been previously adapted for the fabrication of metal/ceramic composites, although the available literature remains limited. One technique demonstrated by Kernan et al. [7] relies on the use of ceramic and metal oxide powders, which are then reduced during post-processing to form the metal phase. Composites have also been manufactured by the layer-wise addition of a ceramic-loaded resin to a metal powder bed [8]. However, most of the literature focuses on a hybrid BJAM and infiltration technique to make composites, in which a ceramic preform is printed using BJAM and infiltration is used to introduce the metal matrix. This was demonstrated by Cramer et al. [9] with the infiltration of a B4C preform using Al and by Levy et al. [10] with the infiltration of TiC preforms using steel. ...
1
2007
... Binder jet additive manufacturing (BJAM) is a solid-state process that selectively applies a liquid binder to a bed of powder. This is followed by the spreading of a new layer of powder, and the process is repeated to construct 3D parts in a layer-wise fashion [6]. These parts are then post-processed by de-binding and sintering at elevated temperatures. BJAM has been previously adapted for the fabrication of metal/ceramic composites, although the available literature remains limited. One technique demonstrated by Kernan et al. [7] relies on the use of ceramic and metal oxide powders, which are then reduced during post-processing to form the metal phase. Composites have also been manufactured by the layer-wise addition of a ceramic-loaded resin to a metal powder bed [8]. However, most of the literature focuses on a hybrid BJAM and infiltration technique to make composites, in which a ceramic preform is printed using BJAM and infiltration is used to introduce the metal matrix. This was demonstrated by Cramer et al. [9] with the infiltration of a B4C preform using Al and by Levy et al. [10] with the infiltration of TiC preforms using steel. ...
1
2018
... Binder jet additive manufacturing (BJAM) is a solid-state process that selectively applies a liquid binder to a bed of powder. This is followed by the spreading of a new layer of powder, and the process is repeated to construct 3D parts in a layer-wise fashion [6]. These parts are then post-processed by de-binding and sintering at elevated temperatures. BJAM has been previously adapted for the fabrication of metal/ceramic composites, although the available literature remains limited. One technique demonstrated by Kernan et al. [7] relies on the use of ceramic and metal oxide powders, which are then reduced during post-processing to form the metal phase. Composites have also been manufactured by the layer-wise addition of a ceramic-loaded resin to a metal powder bed [8]. However, most of the literature focuses on a hybrid BJAM and infiltration technique to make composites, in which a ceramic preform is printed using BJAM and infiltration is used to introduce the metal matrix. This was demonstrated by Cramer et al. [9] with the infiltration of a B4C preform using Al and by Levy et al. [10] with the infiltration of TiC preforms using steel. ...
1
2019
... Binder jet additive manufacturing (BJAM) is a solid-state process that selectively applies a liquid binder to a bed of powder. This is followed by the spreading of a new layer of powder, and the process is repeated to construct 3D parts in a layer-wise fashion [6]. These parts are then post-processed by de-binding and sintering at elevated temperatures. BJAM has been previously adapted for the fabrication of metal/ceramic composites, although the available literature remains limited. One technique demonstrated by Kernan et al. [7] relies on the use of ceramic and metal oxide powders, which are then reduced during post-processing to form the metal phase. Composites have also been manufactured by the layer-wise addition of a ceramic-loaded resin to a metal powder bed [8]. However, most of the literature focuses on a hybrid BJAM and infiltration technique to make composites, in which a ceramic preform is printed using BJAM and infiltration is used to introduce the metal matrix. This was demonstrated by Cramer et al. [9] with the infiltration of a B4C preform using Al and by Levy et al. [10] with the infiltration of TiC preforms using steel. ...
1
2017
... Binder jet additive manufacturing (BJAM) is a solid-state process that selectively applies a liquid binder to a bed of powder. This is followed by the spreading of a new layer of powder, and the process is repeated to construct 3D parts in a layer-wise fashion [6]. These parts are then post-processed by de-binding and sintering at elevated temperatures. BJAM has been previously adapted for the fabrication of metal/ceramic composites, although the available literature remains limited. One technique demonstrated by Kernan et al. [7] relies on the use of ceramic and metal oxide powders, which are then reduced during post-processing to form the metal phase. Composites have also been manufactured by the layer-wise addition of a ceramic-loaded resin to a metal powder bed [8]. However, most of the literature focuses on a hybrid BJAM and infiltration technique to make composites, in which a ceramic preform is printed using BJAM and infiltration is used to introduce the metal matrix. This was demonstrated by Cramer et al. [9] with the infiltration of a B4C preform using Al and by Levy et al. [10] with the infiltration of TiC preforms using steel. ...
2
2019
... Spherical Inconel alloy 625 powder (24 μm average diameter) was used in a 3D SYSTEMS ZCorp Z 510/310 binder jetting powder-bed system to manufacture alloy 625 and alloy 625 MMC parts. As shown in a previous study [11] the alloy 625 parts are not reinforced and retain a nominal alloy 625 composition. Alloy 625 is a predominantly solid solution strengthened Ni superalloy, with notable quantities of Cr, Mo, Fe and Nb within the Ni matrix. After BJAM and reactive sintering, a previous study [12] has shown that the reinforced alloy 625 MMC parts form Cr, Mo, and Nb carbide reinforcements throughout the Ni matrix. The printing process for both the reinforced and unreinforced materials was the same, with the difference arising during the post-printing sintering process. Further details are available in the previous studies, although a summary is provided below. The binder (Zb60) was obtained from 3D SYSTEMS, and an analysis by Olivier et al. [13] in combination with the supplier provided data sheet indicates that it consists of water, a humectant (glycerol), a proprietary polymeric surfactant and 2-pyrrolidone. Printing parameters included a 70 μm layer height, 360 dpi resolution, and 100 % core and 200 % shell saturation. Immediately after printing, the samples were exposed to a 35 °C 3-hour drying step. ...
... With the formation of Cr, Mo and Nb carbide phases, the Ni matrix - which was initially alloy 625 - has been partially depleted of alloying elements. The final composition of the depleted matrix is compared to a nominal alloy 625 [15], the initial alloy 625 powder [11], and Hastelloy N [16] in Table 1. The increase in Ni concentration and decrease in Cr make the depleted matrix similar to that of Hastelloy N, although the reduced Mo and greater Fe likely result in reduced solid solution strengthening and reduced corrosion resistance. ...
2
2018
... Spherical Inconel alloy 625 powder (24 μm average diameter) was used in a 3D SYSTEMS ZCorp Z 510/310 binder jetting powder-bed system to manufacture alloy 625 and alloy 625 MMC parts. As shown in a previous study [11] the alloy 625 parts are not reinforced and retain a nominal alloy 625 composition. Alloy 625 is a predominantly solid solution strengthened Ni superalloy, with notable quantities of Cr, Mo, Fe and Nb within the Ni matrix. After BJAM and reactive sintering, a previous study [12] has shown that the reinforced alloy 625 MMC parts form Cr, Mo, and Nb carbide reinforcements throughout the Ni matrix. The printing process for both the reinforced and unreinforced materials was the same, with the difference arising during the post-printing sintering process. Further details are available in the previous studies, although a summary is provided below. The binder (Zb60) was obtained from 3D SYSTEMS, and an analysis by Olivier et al. [13] in combination with the supplier provided data sheet indicates that it consists of water, a humectant (glycerol), a proprietary polymeric surfactant and 2-pyrrolidone. Printing parameters included a 70 μm layer height, 360 dpi resolution, and 100 % core and 200 % shell saturation. Immediately after printing, the samples were exposed to a 35 °C 3-hour drying step. ...
... SEM images of alloy 625’s sintered surface after the use of a de-binding step shows a smooth profile (Fig. 2a), whereas the reactive sintered alloy 625 MMC surface consists of a Cr-rich phase (Fig. 2b). The phase does not fully envelop the particle, with some Ni detectible between the Cr-rich phase using EDX (Fig. 2c, d). A previous study [12] used XRD to identify the composition of the Cr-rich phase as Cr3C2, as well as identifying the presence of internal carbides (Mo2C and NbC) within the particle. This is supported in the current work using two additional techniques (EDX and EBSD) that identify the location of the phases and their composition. The cross-section of a sintered BJAM alloy 625 part in Fig. 3a and EDX line scan in Fig. 3b confirms that a Cr-rich region forms around the surface of the individual powder particles that make up the larger printed part. Additionally, Nb and Mo-rich phases are confirmed to exist within the particles. EBSD results presented in Fig. 4a support the previous XRD results by confirming the presence of a Cr3C2 phase around each particle and a Mo2C phase within each particle. Ni and NbC were indistinguishable via EBSD due to their similar crystallographic structure and attempts to detect other Cr carbides (such as Cr23C6 and Cr7C3) indicate that only Cr3C2 is present. Based on the Cr-C phase diagram and exposure of these samples to a temperature of 1200 °C for 5 h, formation of the Cr3C2 phase is expected with a localized C concentration of >40 at%. The high number of Mo and Nb carbides within the particle core suggests that significant inward diffusion of carbon occurs during the reactive sintering process. ...
1
2014
... Spherical Inconel alloy 625 powder (24 μm average diameter) was used in a 3D SYSTEMS ZCorp Z 510/310 binder jetting powder-bed system to manufacture alloy 625 and alloy 625 MMC parts. As shown in a previous study [11] the alloy 625 parts are not reinforced and retain a nominal alloy 625 composition. Alloy 625 is a predominantly solid solution strengthened Ni superalloy, with notable quantities of Cr, Mo, Fe and Nb within the Ni matrix. After BJAM and reactive sintering, a previous study [12] has shown that the reinforced alloy 625 MMC parts form Cr, Mo, and Nb carbide reinforcements throughout the Ni matrix. The printing process for both the reinforced and unreinforced materials was the same, with the difference arising during the post-printing sintering process. Further details are available in the previous studies, although a summary is provided below. The binder (Zb60) was obtained from 3D SYSTEMS, and an analysis by Olivier et al. [13] in combination with the supplier provided data sheet indicates that it consists of water, a humectant (glycerol), a proprietary polymeric surfactant and 2-pyrrolidone. Printing parameters included a 70 μm layer height, 360 dpi resolution, and 100 % core and 200 % shell saturation. Immediately after printing, the samples were exposed to a 35 °C 3-hour drying step. ...
Recrystallization and Related Annealing Phenomena
1
2017
... Kernel average misorientation maps (Fig. 4b) show an increasing misorientation gradient extending from the center of the Ni powder to the surface, with very little misorientation detected in the Cr3C2 phase. Most of the misorientation is below 2°, which Humphreys et al. [14] indicates will result in low grain boundary mobility. In addition, the formation of a significant amount of internal Mo2C and NbC prohibits the migration of low and high angle grain boundaries. As such, no recrystallized grains or annealing twins are detected in the Ni matrix (Fig. 4c) and the Ni matrix grain size does not significantly change during the reactive sintering process. ...
Special Metals
1
2013
... With the formation of Cr, Mo and Nb carbide phases, the Ni matrix - which was initially alloy 625 - has been partially depleted of alloying elements. The final composition of the depleted matrix is compared to a nominal alloy 625 [15], the initial alloy 625 powder [11], and Hastelloy N [16] in Table 1. The increase in Ni concentration and decrease in Cr make the depleted matrix similar to that of Hastelloy N, although the reduced Mo and greater Fe likely result in reduced solid solution strengthening and reduced corrosion resistance. ...
Haynes International
1
2002
... With the formation of Cr, Mo and Nb carbide phases, the Ni matrix - which was initially alloy 625 - has been partially depleted of alloying elements. The final composition of the depleted matrix is compared to a nominal alloy 625 [15], the initial alloy 625 powder [11], and Hastelloy N [16] in Table 1. The increase in Ni concentration and decrease in Cr make the depleted matrix similar to that of Hastelloy N, although the reduced Mo and greater Fe likely result in reduced solid solution strengthening and reduced corrosion resistance. ...
1
2009
... To better understand the growth kinetics of the interdiffusion reaction layer that forms between the zb60 binder and alloy 625 during sintering, a set of cast alloy 625 samples coated with an excess quantity of zb60 binder were prepared. The resulting serrated morphology at the carbide-matrix interface shown in Fig. 5a is attributed to anisotropic diffusion/growth along preferred crystallographic orientations, as reported by Cheng and Wang [17] for other interdiffusion reaction layers and by Tang et al. [18] in carbide growth within Ni alloys. Also visible on the surface is a network-like structure, shown in Fig. 5b. Visual similarities were found in the microstructure between the carbide that formed on the cast alloy 625 diffusion test specimens and the carbide shell seen in the BJAM alloy 625 MMCs (Fig. 5c, d). Both the test specimens and the powder particles formed a network structure, and the same microstructure was obtained on the cast alloy 625 specimens with the use of graphite powder instead of zb60 binder. This suggests that the binder behaves similar to carbon at elevated temperatures. Since this binder is used to hold the powder particles together during the BJAM process, the growth of this reaction layer occurs around each particle throughout the entire part and is not limited to only the surface of the part. ...
1
2018
... To better understand the growth kinetics of the interdiffusion reaction layer that forms between the zb60 binder and alloy 625 during sintering, a set of cast alloy 625 samples coated with an excess quantity of zb60 binder were prepared. The resulting serrated morphology at the carbide-matrix interface shown in Fig. 5a is attributed to anisotropic diffusion/growth along preferred crystallographic orientations, as reported by Cheng and Wang [17] for other interdiffusion reaction layers and by Tang et al. [18] in carbide growth within Ni alloys. Also visible on the surface is a network-like structure, shown in Fig. 5b. Visual similarities were found in the microstructure between the carbide that formed on the cast alloy 625 diffusion test specimens and the carbide shell seen in the BJAM alloy 625 MMCs (Fig. 5c, d). Both the test specimens and the powder particles formed a network structure, and the same microstructure was obtained on the cast alloy 625 specimens with the use of graphite powder instead of zb60 binder. This suggests that the binder behaves similar to carbon at elevated temperatures. Since this binder is used to hold the powder particles together during the BJAM process, the growth of this reaction layer occurs around each particle throughout the entire part and is not limited to only the surface of the part. ...
1
1979
... Increasing temperatures and increasing time both result in the formation of a thicker Cr3C2 coating on cast alloy 625 specimens. The coating thickness (d) is described by Eq. (1) using a growth rate constant (k), an initial coating thickness term (d0), a time dependence (t), and Eq. (2), which introduces a temperature dependence (T) for k using the Arrhenius equation. These two equations are commonly used in literature to determine the growth rate of diffusion coatings, as shown by Arai [19] for the growth of VC, NbC, TiC and Cr7C3, by Devincent and Michal [20] for the reaction layer between graphite and copper-chromium, and by Sen [21] for the growth of Cr carbide layers on steel substrates. ...
1
1993
... Increasing temperatures and increasing time both result in the formation of a thicker Cr3C2 coating on cast alloy 625 specimens. The coating thickness (d) is described by Eq. (1) using a growth rate constant (k), an initial coating thickness term (d0), a time dependence (t), and Eq. (2), which introduces a temperature dependence (T) for k using the Arrhenius equation. These two equations are commonly used in literature to determine the growth rate of diffusion coatings, as shown by Arai [19] for the growth of VC, NbC, TiC and Cr7C3, by Devincent and Michal [20] for the reaction layer between graphite and copper-chromium, and by Sen [21] for the growth of Cr carbide layers on steel substrates. ...
1
2005
... Increasing temperatures and increasing time both result in the formation of a thicker Cr3C2 coating on cast alloy 625 specimens. The coating thickness (d) is described by Eq. (1) using a growth rate constant (k), an initial coating thickness term (d0), a time dependence (t), and Eq. (2), which introduces a temperature dependence (T) for k using the Arrhenius equation. These two equations are commonly used in literature to determine the growth rate of diffusion coatings, as shown by Arai [19] for the growth of VC, NbC, TiC and Cr7C3, by Devincent and Michal [20] for the reaction layer between graphite and copper-chromium, and by Sen [21] for the growth of Cr carbide layers on steel substrates. ...
2
1999
... The growth rate constant is also dependent on an activation energy (Ea), a pre-exponential factor (k0) and the gas constant (Rg). With an exponent of n equal to 2, Eq. (1) becomes parabolic and the fitted parameters (Table 2) closely describe the measured coating thickness (Fig. 6a). The very close fit (R2=0.99) between the experimental data and parabolic growth kinetics suggests that diffusion is the rate-controlling mechanism for Cr3C2 growth. The calculated growth rate constants in Table 2 can be compared to the diffusion coefficients reported by Mayr et al. [22] for Cr-C diffusion couples. A value of 5.0 × 10⁻¹⁵ was reported for the diffusion coefficient of C in a Cr3C2 reaction layer at 1262 °C, which is similar to the 2.38 × 10⁻¹⁵ obtained in this study at 1200 °C. This suggests that C diffusion through Cr3C2 is the limiting diffusion species, with the small discrepancy attributed to the different temperature and the presence of Mo within the Cr3C2 phase. No literature data was found for the diffusion coefficient of Cr in Cr3C2, although a study by Glowacki and Kaluba [23] on the diffusion through Cr carbide reaction layers in graphite and Fe-C alloys shows that some conditions are Cr diffusion limited and others are C diffusion limited. In the case where a chromizing medium is in contact with a graphite layer, C diffusion through the carbide reaction layer and towards the chromizing medium is found to be limiting. This closely reflects the conditions in this study, with the decomposed binder acting as the graphite layer and the alloy 625 acting as the chromizing medium. Observations of the cast (Fig. 5a) and BJAM samples (Fig. 3a) show carbide growth into the alloy 625, further supporting that carbon diffusion inwards is the limiting factor. ...
... With the use of k values shown in Table 2, an Arrhenius plot is constructed (Fig. 6b) and the activation energy (Ea) and pre-exponential factor (k0) in Eq. (2) for the diffusion-controlled growth of the carbide is determined (Table 3). These values are also closely related to those of C diffusion in Cr3C2 reported by Mayr et al. [22], further supporting that C diffusion through the Cr3C2 layer is the limiting factor. ...
1
1982
... The growth rate constant is also dependent on an activation energy (Ea), a pre-exponential factor (k0) and the gas constant (Rg). With an exponent of n equal to 2, Eq. (1) becomes parabolic and the fitted parameters (Table 2) closely describe the measured coating thickness (Fig. 6a). The very close fit (R2=0.99) between the experimental data and parabolic growth kinetics suggests that diffusion is the rate-controlling mechanism for Cr3C2 growth. The calculated growth rate constants in Table 2 can be compared to the diffusion coefficients reported by Mayr et al. [22] for Cr-C diffusion couples. A value of 5.0 × 10⁻¹⁵ was reported for the diffusion coefficient of C in a Cr3C2 reaction layer at 1262 °C, which is similar to the 2.38 × 10⁻¹⁵ obtained in this study at 1200 °C. This suggests that C diffusion through Cr3C2 is the limiting diffusion species, with the small discrepancy attributed to the different temperature and the presence of Mo within the Cr3C2 phase. No literature data was found for the diffusion coefficient of Cr in Cr3C2, although a study by Glowacki and Kaluba [23] on the diffusion through Cr carbide reaction layers in graphite and Fe-C alloys shows that some conditions are Cr diffusion limited and others are C diffusion limited. In the case where a chromizing medium is in contact with a graphite layer, C diffusion through the carbide reaction layer and towards the chromizing medium is found to be limiting. This closely reflects the conditions in this study, with the decomposed binder acting as the graphite layer and the alloy 625 acting as the chromizing medium. Observations of the cast (Fig. 5a) and BJAM samples (Fig. 3a) show carbide growth into the alloy 625, further supporting that carbon diffusion inwards is the limiting factor. ...
1
1993
... Unlike the cast samples used to determine the Cr3C2 growth kinetics, BJAM samples have a more limited supply of Cr due to the small powder particle size and a supply of C limited by the quantity of binder used. Cr and C depletion as the carbide shell grows likely results in progressively slower growth. Additionally, diffusion occurs in a 3D spherical domain as opposed to the 1D diffusion that occurs between the two flat diffusion couple layers in the cast samples. Since the growth kinetics were determined in conditions with excess Cr and C, those results provide an upper bound for the thickness of the carbide shell in reactively sintered BJAM alloy 625 samples. Another limitation of these growth kinetics results is due to the presence of Mo in the Cr3C2, which literature suggests is substituted at Cr sites within the Cr3C2 structure [24] and may influence diffusion during the carbide growth. Although the effect of Mo is present in both cast and BJAM samples due to their similar composition, care must be taken when extending the growth kinetics results to other Ni alloys without Mo. ...
Materials Science and Engineering: An Introduction
1
2007
... where Vp, and ρp are the initial alloy 625 particle’s volume (m3) and density (g/m3), Cp is the mass fraction of Cr in the initial metal powder, ρCr3C2 is the density of Cr3C2 (g/m3), and CCr3C2 is the mass fraction of Cr in the Cr3C2 reinforcing phase. The value of ρp is approximated in Eq. (6) using a mass fraction weighted combination of the density of Cr (ρCr) and the density of Ni (ρNi) as previously shown by Callister and Rethwisch [25], assuming the remainder of the alloy is pure Ni. ...
3
2002
... Three primary wear mechanisms have been used to model MMCs by Lee et al. [26]: plowing, interface or reinforcement cracking, and complete particle removal. The distribution and size of reinforcing particles are known to influence these wear mechanisms. If the depth of penetration by the abrasive pin is greater than the reinforcement size, plowing is typically more dominant. With larger reinforcements or shallower penetration, Lee et al. [26] indicate that interface or reinforcement cracking can be expected to dominate the wear mechanism. Kumar and Balasubramanian [27] have demonstrated this effect in a SiC particle reinforced aluminum alloy, where an increase in the reinforcing particle size decreasing the extent of plowing. Unfortunately, Diler and Ipek [28] show that these materials are also more susceptible to agglomeration at higher volume fractions during manufacturing than those with smaller reinforcing particles. The network microstructure of the BJAM alloy 625 MMC is expected to alleviate some of these issues; the small NbC and Mo2C particles act to reinforce the material within the nickel matrix, while the interconnected shell prevents deep penetration of the abrasive pin that would result in a plowing action and removal of the small carbides. ...
... ]: plowing, interface or reinforcement cracking, and complete particle removal. The distribution and size of reinforcing particles are known to influence these wear mechanisms. If the depth of penetration by the abrasive pin is greater than the reinforcement size, plowing is typically more dominant. With larger reinforcements or shallower penetration, Lee et al. [26] indicate that interface or reinforcement cracking can be expected to dominate the wear mechanism. Kumar and Balasubramanian [27] have demonstrated this effect in a SiC particle reinforced aluminum alloy, where an increase in the reinforcing particle size decreasing the extent of plowing. Unfortunately, Diler and Ipek [28] show that these materials are also more susceptible to agglomeration at higher volume fractions during manufacturing than those with smaller reinforcing particles. The network microstructure of the BJAM alloy 625 MMC is expected to alleviate some of these issues; the small NbC and Mo2C particles act to reinforce the material within the nickel matrix, while the interconnected shell prevents deep penetration of the abrasive pin that would result in a plowing action and removal of the small carbides. ...
... Three regions are of interest in understanding how this MMC behaves during wear: within the reinforcing phases (Cr3C2 and Mo2C), within the Ni matrix, and at the interface between the carbides and matrix. The presence of cracking in the Cr3C2 shell and interior carbide particles is shown in Fig. 11a, which indicate that they jointly contribute to the increased wear resistance of the composite material. These cracks result in fragmentation of the reinforcement, which break off and contribute to mass loss. As proposed in wear models for MMCs [26], failure typically begins at the interface between the matrix and reinforcing phases. This is due to penetration of the wear pin into the soft matrix, which then catches on reinforcing phases and causes “roll-out” via a plowing mechanism. ...
1
2010
... Three primary wear mechanisms have been used to model MMCs by Lee et al. [26]: plowing, interface or reinforcement cracking, and complete particle removal. The distribution and size of reinforcing particles are known to influence these wear mechanisms. If the depth of penetration by the abrasive pin is greater than the reinforcement size, plowing is typically more dominant. With larger reinforcements or shallower penetration, Lee et al. [26] indicate that interface or reinforcement cracking can be expected to dominate the wear mechanism. Kumar and Balasubramanian [27] have demonstrated this effect in a SiC particle reinforced aluminum alloy, where an increase in the reinforcing particle size decreasing the extent of plowing. Unfortunately, Diler and Ipek [28] show that these materials are also more susceptible to agglomeration at higher volume fractions during manufacturing than those with smaller reinforcing particles. The network microstructure of the BJAM alloy 625 MMC is expected to alleviate some of these issues; the small NbC and Mo2C particles act to reinforce the material within the nickel matrix, while the interconnected shell prevents deep penetration of the abrasive pin that would result in a plowing action and removal of the small carbides. ...
1
2013
... Three primary wear mechanisms have been used to model MMCs by Lee et al. [26]: plowing, interface or reinforcement cracking, and complete particle removal. The distribution and size of reinforcing particles are known to influence these wear mechanisms. If the depth of penetration by the abrasive pin is greater than the reinforcement size, plowing is typically more dominant. With larger reinforcements or shallower penetration, Lee et al. [26] indicate that interface or reinforcement cracking can be expected to dominate the wear mechanism. Kumar and Balasubramanian [27] have demonstrated this effect in a SiC particle reinforced aluminum alloy, where an increase in the reinforcing particle size decreasing the extent of plowing. Unfortunately, Diler and Ipek [28] show that these materials are also more susceptible to agglomeration at higher volume fractions during manufacturing than those with smaller reinforcing particles. The network microstructure of the BJAM alloy 625 MMC is expected to alleviate some of these issues; the small NbC and Mo2C particles act to reinforce the material within the nickel matrix, while the interconnected shell prevents deep penetration of the abrasive pin that would result in a plowing action and removal of the small carbides. ...
Coatings Tribology: Properties, Mechanisms, Techniques and Applications in Surface Engineering, second edition
1
2009
... An analysis of wear testing results presented in Fig. 10 show a significant reduction in wear rate for the BJAM alloy 625 MMC when compared to unreinforced BJAM alloy 625. The wear track is significantly shallower for the MMC, regardless of which abrasive pin material is used. To better quantify the difference in wear rate, the specific wear rate coefficient (kw) is calculated using Eq. (7) as demonstrated by Holmberg and Matthews [29], ...
1
2004
... In composites with a continuous reinforcing phase, a different mechanism has been proposed by Larsson et al. [30]; reduced surface indentation of the wear pin due to distributed loading on a rigid network - in this case, the Cr3C2 phase - results in surface fatigue cracking within the reinforcement. Evidence of this can be seen in Fig. 11b, where a heavily cracked Cr3C2 phase still displays an intact Cr3C2-matrix interface. In the situations where these cracks reach the Cr3C2-matrix interface (Fig. 12a), crack deflection along the interface occurs likely due to the higher fracture toughness of the Ni matrix. Cracks that continue to propagate along the Cr3C2-matrix interface show signs of crack growth via pore coalescence, as seen in Fig. 12b. These small voids are the result of interface decohesion, which Tvergaard [31] describes as leading to material failure by void coalescence due to plastic yielding (necking) in the inter-void region. Therefore, although the MMC’s Ni matrix is depleted of solid solution strengthening elements that typically contribute to increased strength and wear resistance [32], the wear rate is limited by the slower process of reinforcement cracking and removal. ...
1
1989
... In composites with a continuous reinforcing phase, a different mechanism has been proposed by Larsson et al. [30]; reduced surface indentation of the wear pin due to distributed loading on a rigid network - in this case, the Cr3C2 phase - results in surface fatigue cracking within the reinforcement. Evidence of this can be seen in Fig. 11b, where a heavily cracked Cr3C2 phase still displays an intact Cr3C2-matrix interface. In the situations where these cracks reach the Cr3C2-matrix interface (Fig. 12a), crack deflection along the interface occurs likely due to the higher fracture toughness of the Ni matrix. Cracks that continue to propagate along the Cr3C2-matrix interface show signs of crack growth via pore coalescence, as seen in Fig. 12b. These small voids are the result of interface decohesion, which Tvergaard [31] describes as leading to material failure by void coalescence due to plastic yielding (necking) in the inter-void region. Therefore, although the MMC’s Ni matrix is depleted of solid solution strengthening elements that typically contribute to increased strength and wear resistance [32], the wear rate is limited by the slower process of reinforcement cracking and removal. ...
1
2016
... In composites with a continuous reinforcing phase, a different mechanism has been proposed by Larsson et al. [30]; reduced surface indentation of the wear pin due to distributed loading on a rigid network - in this case, the Cr3C2 phase - results in surface fatigue cracking within the reinforcement. Evidence of this can be seen in Fig. 11b, where a heavily cracked Cr3C2 phase still displays an intact Cr3C2-matrix interface. In the situations where these cracks reach the Cr3C2-matrix interface (Fig. 12a), crack deflection along the interface occurs likely due to the higher fracture toughness of the Ni matrix. Cracks that continue to propagate along the Cr3C2-matrix interface show signs of crack growth via pore coalescence, as seen in Fig. 12b. These small voids are the result of interface decohesion, which Tvergaard [31] describes as leading to material failure by void coalescence due to plastic yielding (necking) in the inter-void region. Therefore, although the MMC’s Ni matrix is depleted of solid solution strengthening elements that typically contribute to increased strength and wear resistance [32], the wear rate is limited by the slower process of reinforcement cracking and removal. ...


 WeChat