

1. Introduction
Steel components, e.g. gears, used in machinery fail through wear and fatigue. Heat treatments such as carburization are widely used in order to improve the fatigue properties of steel gears. During carburization, carbon is diffused into the steel surface, which mainly contains austenite. The components with increased carbon content in the surface are then rapidly quenched and austenite transforms into martensite in the surface. The formation of martensite, a high strength phase, creates a hard surface layer (case) and increases the hardness of the surface. The martensitic transformation also gives rise to compressive residual stresses on the surface, which are beneficial for the fatigue performance of gears.
The carburization temperature and time have been reported to affect the mechanical properties of steel gears. The surface hardness of a carburized steel gear increases with increasing heat treatment duration. However, excessive carburization has been reported to have a negative effect on fatigue life due to carbide growth [1,2]. Therefore, it is essential to predict the case depths at different temperatures and heat treatment durations.
The amount of martensite and retained austenite (RA) can affect the fatigue properties of gears, as shown by experiments and macroscale models [[3], [4], [5], [6], [7], [8]]. Abudaia conducted root bending fatigue tests on 17CrNiMo6 steel gears with low RA (15 % RA) and high RA (40-60 % RA) content [3]. Abudaia’s fatigue tests showed that gears with low RA content possessed better fatigue strength in the high cycle region (i.e. low stress regime), whereas the gears with high RA content showed better fatigue life in the low cycle fatigue region (i.e. high stress regime) [3]. Da Silva et al. showed that high RA in 8620 steel samples that were subjected to four point bend fatigue test resulted in longer fatigue life and slower crack growth rate in the high stress regime [5]. The low cyclic (high stress) fatigue tests on a three phase steel by Hu et al. have shown that samples with high RA possessed good fatigue properties in the low stress regime and poor fatigue properties in the high stress regime [7]. Qi et al. reported that RA improved the high-cycle fatigue strength of a TRIP steel [8]. Zaccone et al. performed low cycle bending fatigue tests on a high carbon steel and reported that high RA content decreased the fatigue life in the low stress regime [4]. Experiments and modeling work by Ooi et al. on the rolling contact fatigue of 8620 steel showed that high RA (70 % RA) leads to improved rolling contact fatigue life [6].
Despite the many experimental results mentioned above, there is a need to model and understand the effect of stress cycling on retained austenite and martensite, especially at the microscale. The phase-field approach [9] has been successfully applied to study solidification [10], grain growth [11], martensitic transformation [[12], [13], [14], [15], [16], [17]] as well as the reversion of martensite to austenite by a shear mechanism [18,19] and during thermal cycling [20].
In the present work, a multi-scale modeling work is performed to study: (a) the diffusion of carbon during heat treatments, (b) the phase transformations and microstructure evolution during quenching as well as during stress cycling by using a 3D elastoplastic phase-field model [15] and (c) the effect of carburization and phase fractions on the macroscale fatigue properties of a steel spur gear.
2. Methodology
The diffusion of carbon is modeled by solving the Fick’s second law [21] to predict the carbon concentrations and case depths in SAE8620 steel at different heat treatment temperatures and times. The local carbon concentration at certain depth from the surface, predicted by the diffusion model for a given heat treatment temperature and time, is used as input data for the microscale (phase-field) model to predict the microstructure as well as phase fractions of retained austenite (RA) and martensite in an austenite grain that is subjected to rapid quenching. The effects of plasticity and strain hardening are also incorporated in the phase-field model. Two different microstructures with different RA content were then subjected to different stress cycling simulations to study the response of austenite and martensite to the applied cyclic stresses.
In order to analyze the fatigue performance at macroscale, a spur gear was designed using Autodesk Inventor software [22]. The case depth predicted by the diffusion model for a given carburizing temperature and heat treatment time are selected and the corresponding experimental S-N data are used as input data to simulate the fatigue behavior of a SAE8620 steel spur gear using ANSYS software [23]. The amounts of martensite, retained austenite predicted by the phase-field model and the corresponding experimental S-N data are used as input data for the ANSYS model to study the effect of retained austenite on the fatigue properties of the gear. The model set-up, simulation data used in the three different modeling approaches as well as the corresponding results are presented in the following sections.
3. Modeling, results and discussion
3.1. Diffusion modeling
where C is concentration, x is distance, t is time and D is diffusion coefficient expressed as:
where D0 is pre-exponential factor, Qd is the activation energy, R is gas constant and T is temperature.
The solution to Eq. (1) under the boundary conditions C = C0 at t = 0 when 0 < x < ∞ and C = Cs at x = 0 when 0 < t < ∞ is:
where C0 is the initial concentration, Cs is the surface concentration, Cx is the concentration at a distance ‘x’ from the surface.
The following diffusion data corresponding to SAE8620 steel with a composition of Fe-0.46 Cr-0.22 C-0.46 Ni-0.74 Mn-0.22 Si-0.18 Mo, in wt %, are used in the model [21]: D0 = 44.7 mm2/s and Qd = 151 kJ/mol.
3.1.1. Diffusion modeling: results and discussion
The diffusion of carbon in SAE8620 steel at different carburizing temperatures after 2 h and 5 h is shown in Fig. 1. The case depth increases with increasing heat treatment time, in agreement with experimental and theoretical results [21,25]. The case depth obtained at 1173 K after 2 h was approximately 0.9 mm and 1.5 mm after 5 h. Jimenez et al. reported a case depth of 0.9 mm after carburizing 8620H steel at 1173 K for 2 h [21], whereas Genel et al. reported a case depth of 0.9 mm after carburizing 8620 steel at 1173 K for 5 h [25]. The case depth increased with increasing heat treatment temperature, in agreement with Ref. [26]. The present results show that a case depth of 1.6 mm can be obtained when carburized at 1250 K after 2 h, whereas Asi et al.’s experiments showed a case depth of 1.49 mm for a same heat treatment of 8620 steel [26].
Fig. 1.
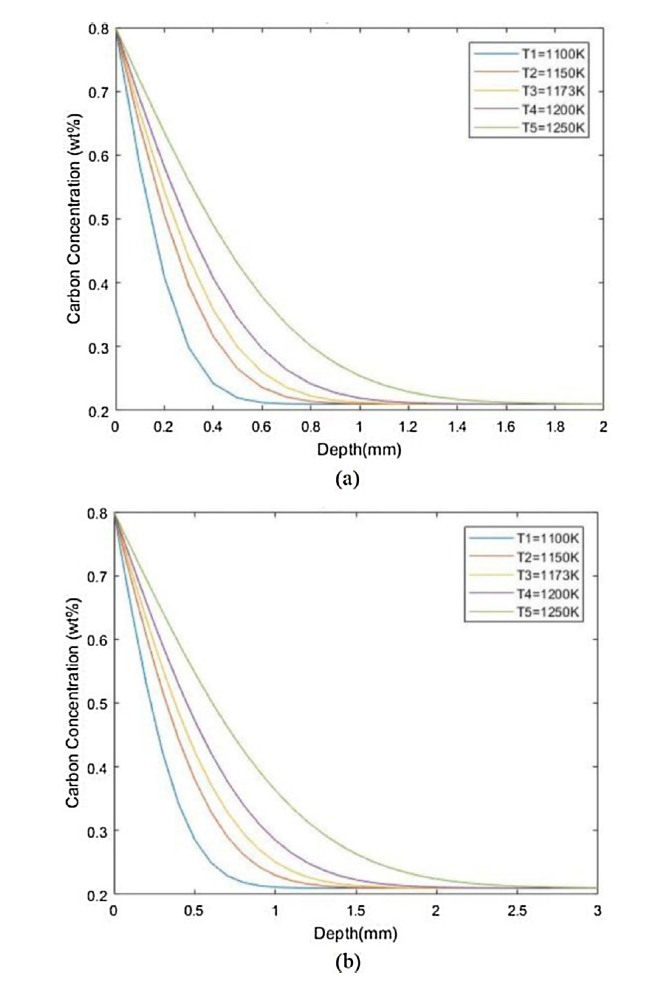
Fig. 1.
Diffusion of carbon in SAE 8620 steel after carburizing for (a) 2 h and (b) 5 h.
3.2. Microscale modeling: phase-field model
where ηp is the phase field variable that tracks the evolution of martensite units, r(x,y,z) is the position vector expressed in Cartesian coordinates, L governs the mobility of the phase interface, Gvchem is the chemical part of the Gibbs energy density, Gvel is the strain energy density and Gvappl is the extra Gibbs energy density due to the externally applied stress. The last term in Eq. (4) is the gradient energy term (Ggrad) and β is the gradient energy coefficient expressed in terms of the interfacial energy (γ), molar volume (Vm) and the Gibbs energy barrier as: $\beta =\frac{9{{\gamma }^{2}}{{V}_{m}}}{16\text{ }\!\!\Delta\!\!\text{ }{{G}^{*}}}$.
Martensite variants (laths), which form in 24 different crystallographic orientations, can be grouped into three basic variants known as Bain variants [17]. In this work formation of the three Bain variants is modeled by considering three phase-field variables η1, η2 and η3. Gchem is expressed as a Landau-type polynomial in terms of the three phase-field variables [13,14]:
where the coefficients A, B, C are expressed in terms of Gibbs energy barrier (ΔG∗) and the driving force (ΔGm) as: A = 32ΔG∗, B = (3A - 12ΔGm), C = (2A-12ΔGm) and $\Delta {{G}^{*}}=\frac{{{V}_{m}}\beta }{2{{\delta }^{2}}}$ [14]. δ is the physical interface thickness.
where σij(r) is the stress, cijkl is the tensor of elastic constants, ${{\varepsilon }_{kl}}\left( r \right)$ is the total strain, $~\varepsilon _{kl}^{0}\left( r \right)$ is the stress-free transformation strain and $\varepsilon _{kl}^{pl}\left( r \right)$ is the plastic strain. The anisotropic elastic properties of different phases are considered by using ${{c}_{ijkl}}=c_{ijkl}^{FCC}\left( 1-{{\eta }_{p}} \right)+c_{ijkl}^{BCT}{{\eta }_{p}}$ [14]. The total strain ${{\varepsilon }_{kl}}\left( r \right)$ is calculated by solving the mechanical equilibrium equation $\frac{\partial {{\sigma }_{ij}}\left( r \right)}{\partial {{r}_{j}}}=0$, expressed as:
Small strain theory is assumed in the present work and therefore, ${{\varepsilon }_{ij}}\left( r \right)=\frac{1}{2}\left( \frac{\partial {{u}_{i}}(r)}{\partial {{r}_{j}}}+\frac{\partial {{u}_{j}}(r)}{\partial {{r}_{i}}} \right)$, where u(r) is the local displacement vector.
$~\varepsilon _{ij}^{0}\left( r \right)$ is given by:
where $\varepsilon _{ij}^{00}\left( p \right) $ are the Bain strain tensors that govern the three phase-field variables (η1, η2, η3) and are given by:
where ε3 is compressive transformation strain, ε1 is tensile transformation strain and are defined based on the lattice constants of austenite (aFCC) and martensite (aBCT, cBCT) [14]. Thus the martensite (Bain) variants-1, 2 and 3 are governed by $\varepsilon _{ij}^{00}\left( 1 \right)$, $\varepsilon _{ij}^{00}\left( 2 \right)$, $\varepsilon _{ij}^{00}\left( 3 \right)$, respectively.
The plastic strain ($\varepsilon _{kl}^{pl}\left( r \right)$)is generated when the internal stress (σij(r)) exceeds the yield limit and the material undergoes plastic deformation. In the present work von Mises yield criterion is used. The evolution of plastic strain $\varepsilon _{ij}^{pl}\left( r \right)$ is governed by [14]:
where $G_{v}^{shear}$ is the shear energy density expressed in terms of deviatoric strain components [14], ${{k}_{ijkl}}(=kc_{ijkl}^{-1})$ is the plastic kinetic coefficient and $c_{ijkl}^{-1}$ is the compliance tensor. k is a parameter, which controls the rate at which stresses are relaxed by means of plastic deformation and is called plastic relaxation rate [14]. Linear isotropic strain hardening is considered by using the expression ${{\sigma }_{y}}=\sigma _{y}^{0}+H{{\varepsilon }^{pl}}(r)$ [27], where σy is yield stress of the material that depends on plastic strain,$\sigma _{y}^{0}$ is initial yield stress, H is hardening modulus and ${{\varepsilon }^{pl}}(r)$ is equivalent plastic strain.
The additional energy term $G_{v}^{appl}$ due to the externally applied stress can be expressed as [15]:
where $\sigma _{ij}^{appl}$ is the Cauchy stress tensor.
3.2.1. Phase-field simulations and data
The simulations are performed on a 1 μm austenite grain. The simulated grain is assumed to be at a depth of approximately 0.17 mm below the surface of the steel specimen carburized at 1173 K for 2 h (Fig. 1a) and hence the local carbon concentration of the grain is 0.6 wt %. The following input simulation data are acquired from different sources, such as CALPHAD and experiments: A = 1188 J/mol, B = 3564 J/mol, C = 2376 J/mol, L = 1 m3J-1s-1, β = 0.1061 × 10⁻¹⁰ J/m, ΔG∗ = 37.135 J/mol [14], γ = 0.01 J/m2 [13]; Bain strains are ε1 = 0.1294 and ε3 = -0.17902 based on the lattice constants of Fe-0.6 wt %C, aFCC = 3.575 Å, aBCT = 2.855 Å, cBCT = 2.935 Å [28]; elastic constants of austenite are C11 = 263 GPa, C12 = 106 GPa and C44 = 78 GPa [29]; elastic constants of martensite are C11 = 268 GPa, C12 = 111 GPa, C44 = 79 GPa, C13 = 110 GPa, C33 = 267 GPa and C66 = 79 GPa [30]; σy° (austenite) =500 MPa, σy° (martensite) =800 MPa, H =738 MPa [31], k = 1.25 GPa-1s-1, Ms temperature =578 K [32], ΔGm at 100 K below Ms = -2391 J/mol and ΔGm at 300 K = -948 J/mol. ΔGm values are calculated for the local grain composition of Fe-0.5 wt %Cr-0.6 wt %C using MatCalc software [33].
A pre-existing spherical martensite (η1) embryo of 0.1 μm is considered in the center of the grain. Dirichlet (clamped) boundary conditions are considered. The plastic relaxation rate (k) is a model parameter [14]. Simulations are performed on a 50 × 50 × 50 mesh by using FemLego software [34]. Due to the lack of available experimental data on the kinetics of lath martensite, Lpq in Eq. (4) is considered as unity.
The martensitic microstructure evolution upon quenching is simulated by performing two different simulations at 100 K below the Ms and the resultant phase fractions from these simulations are: 50 % martensite with 50 % retained austenite (RA) termed as high RA sample and 86 % martensite with 14 % RA termed as low RA sample. The effect of RA on the microstructure that is subjected to repeated stress loading (fatigue) is studied by applying triangular waveform type of stress loading on the high RA and low RA samples, as mentioned above. Two different cyclic loadings were studied by applying a uni-axial tensile stress along the X-axis at 300 K. Therefore, except σxxappl in the Cauchy stress tensor (Eq. (11)), all the other stress components are equal to zero. In the first type of cyclic loading, stress (σxxappl) was varied from 0 to 400 MPa with increments of 100 MPa (Fig. 2a). The stresses applied in this loading correspond to the stresses observed in the low stress regime, i.e. high cycle fatigue region of the S-N curve of 8620 steel [35]. In the second type of cyclic loading, stress was varied from 0 to 1200 MPa with increments of 300 MPa (Fig. 2a). The stresses applied in this cyclic loading correspond to the stresses typically observed in the high stress regime, i.e. low cycle fatigue region of S-N curve of 8620 steel [35].
Fig. 2.
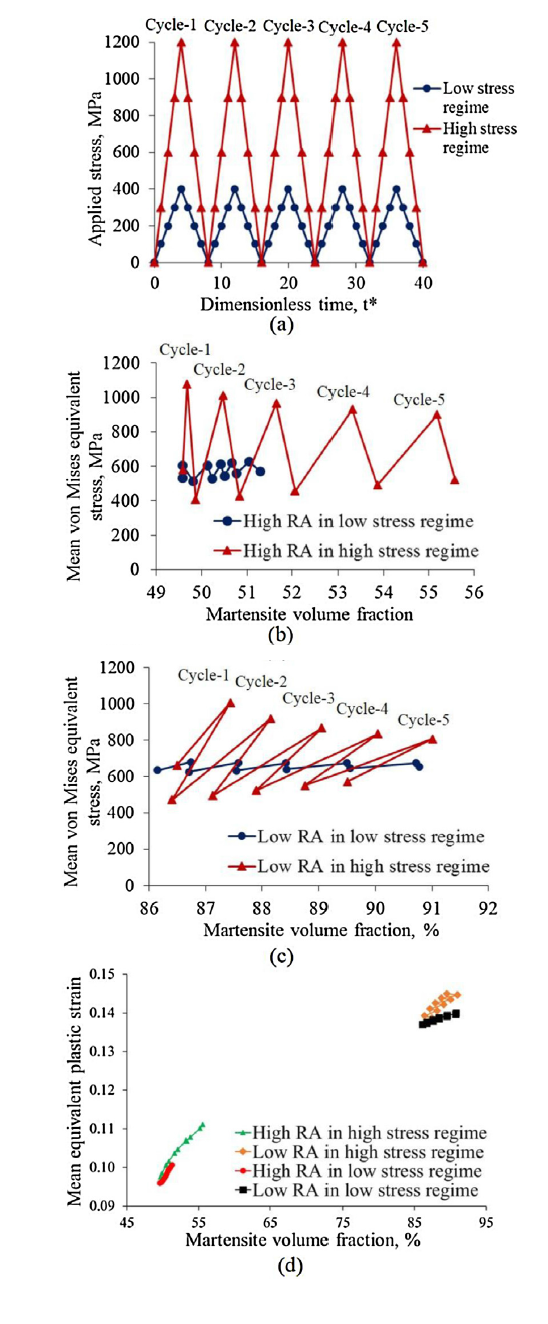
Fig. 2.
(a) Phase-field stress cycling simulations. Evolution of martensite volume fraction and mean von Mises equivalent stress in (b) high RA sample and (c) low RA sample. (d) Variation in the mean equivalent plastic strain with martensite volume fraction.
3.2.2. Phase-field modeling: results and discussion
The simulations show that microstructure consists of lath martensite (Fig. 3, Fig. 4), in agreement with experimental observations on steels with 0.6 wt%C [36]. Martensite variants 1, 2 and 3 (Eq. (5)) are shown in red, blue and green, respectively. Fig. 3 shows that some variants revert to austenite during the stress cycling. The reversion of martensite can be seen by the decrease in thickness of martensite variants (ellipses in Fig. 3a and b). Fig. 4 shows that some variant reorganization occurs, i.e. some martensite variants transform into other variants in some regions of the grain, see XY (side) planes in Fig. 4a and c. Fig. 4 shows that a specific set of variants are formed along different grain boundaries, i.e. variants 1 and 2 along XY plane (side), 1 and 3 along XZ plane (front), 2 and 3 along YZ plane (top). These phenomena, i.e. variant reorganization, reversion and variant selection, occur in order to minimize the energy and hence the variants that are most favorable under the local thermomechanical conditions will grow and those that are not favorable will revert to austenite or transform into other variants [15,18].
Fig. 3.
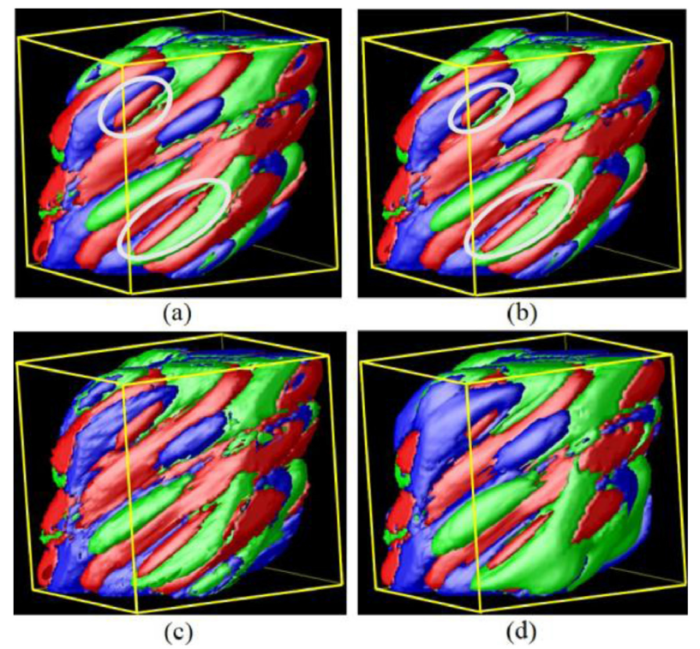
Fig. 3.
Simulated microstructures of an austenite grain with high RA content (50 % RA) subjected to stress cycling. Microstructure (a) before the stress cycling (as-quenched), (b) after completion of loading part of stress cycle-1 in the low stress regime, (c) after completion of stress cycling in the low stress regime, (d) after completion of stress cycling in the high stress regime. Martensite variants 1, 2 and 3 are shown in red, blue and green, respectively. Areas of martensite reversion are shown by ellipses (white).
Fig. 4.
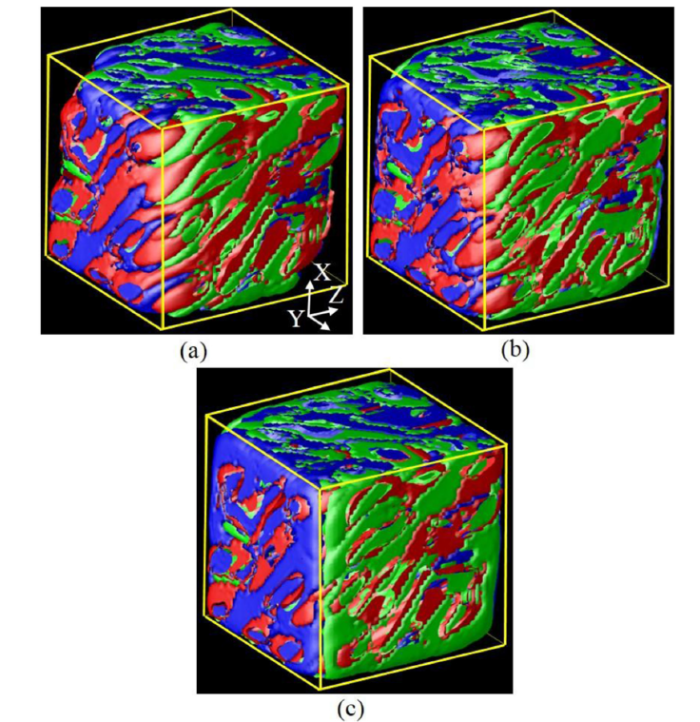
Fig. 4.
Simulated microstructures of an austenite grain with low RA content (14 % RA) subjected to stress cycling. Microstructure (a) before the stress cycling (as-quenched), (b) after completion of stress cycling in the low stress regime, (c) after completion of stress cycling in the high stress regime.
The stress cycling simulations (Fig. 2, Fig. 3, Fig. 4) show that RA transforms to martensite, in agreement with Refs. [3,[5], [6], [7], [8]]. In the low stress regime, the high RA sample (50 % RA) does not readily transform to martensite compared to that of the low RA sample (14 % RA) (Fig. 2). Abudaia reported that the inability of RA to transform into martensite gave rise to poor fatigue properties in a high RA sample during the low stress regime [3]. Zaccone et al. have also reported that high RA content decreased the fatigue life of a high carbon steel in the low stress regime as the applied stresses were unable to transform RA into martensite [4]. In the low stress regime, the additional mechanical energy supplied by the applied stresses is less and hence formation of new martensite requires significant amount of residual stresses that can facilitate more martensite formation (Fig. 2). In the sample with high RA (Fig. 2b), the internal residual stresses at the beginning of the stress cycling are less (535 MPa) and hence RA does not readily transform to martensite. Therefore, we observe less than 2 % increase in martensite volume fraction at the end of the stress cycling. In the low RA sample where the residual stresses at the beginning of the stress cycling are slightly large (635 MPa), formation of new martensite is relatively easy compared to the previous case and hence 5 % increase in martensite volume fraction at the end of stress cycling is observed.
In the high stress regime, the high RA sample gives rise to more martensite volume fraction compared to that of a low RA sample. The results are in good agreement with Ref. [37] where it was reported that a TRIP steel with higher RA showed a higher potential to transform to martensite under plastic cyclic strains (high stress regime), whereas a TRIP steel with lower RA showed a higher transformation potential under elastic cyclic strains (low stress regime). In the high stress regime, where significant amount of mechanical energy is supplied by the applied stresses, martensite forms readily in the high RA sample as the residual stresses at the beginning of the stress cycling are relatively less (580 MPa). Therefore, we observe 6 % increase in martensite volume fraction at the end of the stress cycling (Fig. 2b). The results are in good agreement with Da Silva et al.’s observations that the improved fatigue properties of 8620 steel with high RA content in the high stress regime was due to the ability of RA to transform into martensite during fatigue loading, where martensite can effectively act as an obstruction for crack propagation [5]. Ooi et al. reported that the improved rolling contact fatigue life of 8620 steel with high RA content is due to the stress-induced transformation of RA to martensite during fatigue loading, which can inhibit crack propagation [6]. The compressive residual stresses generated due to the volume expansion caused by martensitic phase transformation was also reported as one of the reasons for the retardation of crack growth [5,8,38,39]. Hu et al. have shown that high RA in a three phase steel is beneficial during the crack initiation and early crack propagation stages, but is a drawback during the stable and fast propagation stages [7]. During the initiation and early stages of crack propagation, the work performed on the material is mostly consumed by the transformation of austenite to martensite and the stress concentration ahead of the crack tip is relaxed [7,8,37]. During later stages of the crack propagation when the stress concentration ahead of the crack tip is very large RA can easily transform into martensite, which can easily crack near the martensite boundaries and leads to faster crack propagation [7].
In the case of low RA sample in high stress regime, the relatively large residual stresses (660 MPa) and the large external stresses lead to considerable amount of martensite formation during each stress cycle. However, during the unloading part of each stress cycle, a fraction of martensite reverts to austenite (Fig. 2c). Due to this reverse transformation of a small fraction of martensite to austenite, the net increase in martensite volume fraction is 3 % at the end of the stress cycling in low RA sample. The reversion of some martensite variants is also observed in the high RA sample during the low stress regime (Fig. 3a and b). The reversion of martensite to austenite during uni-axial tensile loading was also observed in an earlier work by the present author, where the phase-field simulations showed that the local internal stresses can cause the reversion of martensite [19]. Therefore, high residual stresses can be beneficial to martensite formation during the low stress regime, whereas low residual stresses can be beneficial to martensite formation during high stress regime.
Qi et al. reported that RA improved the high-cycle fatigue strength of a TRIP steel mainly by suppressing crack initiation and providing resistance to propagation through the transformation induced plasticity (TRIP) effect [8,40,41]. The local stress concentration is relaxed due to TRIP effect and the initiation of microcracks gets delayed, which in turn increases the number of cycles for crack initiation, i.e. improved fatigue life. The phase-field results show that the highest percentage increase in plastic strain per 1% increase in martensite volume fraction is observed in high RA sample in the low stress regime (Fig. 2d).
3.3. Macroscale fatigue modeling
A spur (driving) gear is designed with the following specifications using the Spur Gear Component Generator in Autodesk Inventor software (Fig. 5) [22]. The specifications used in the gear design are taken from experimental data [42]: Module = 6 mm, number of teeth = 15, profile shift factor = 0.133, standard meshing angle = 20°, operation meshing angle = 22.439°, diameter of generating pitch circle = 90 mm, center distance = 91.5 mm, contact ratio = 1.406, Width = 10 mm. A single gear tooth with carburized case is considered (Fig. 5). Using ANSYS software, fatigue analysis was performed for a case depth of 0.9 mm as predicted by the diffusion model explained in Sec. 3.1. The top surface of the gear tooth is excluded from fatigue analysis since copper plating is typically used in the gear manufacturing to prevent an excess carbon concentration that could result in carbide formation [2].
Fig. 5.
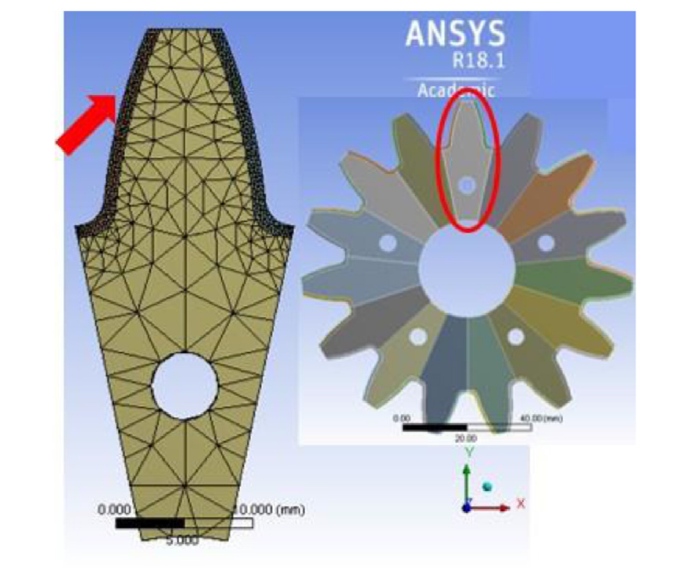
Fig. 5.
Spur gear (inset) designed using Inventor and the gear tooth considered for fatigue analysis (ellipse). Carburized case can be clearly seen in the single gear tooth (left). Arrow indicates the loading direction and location.
A finite element mesh was produced with refinement around the carburized layer (Fig. 5). The simulated load on the gear tooth varied between zero and a maximum load ranging between 10 kN-100 kN applied at an angle of 45° to the X-axis (arrow in Fig. 5). The experimental S-N data corresponding to SAE8620 steel, for both uncarburized [43] and carburized [25] gears, is provided as the input material data (Table 1). The effect of RA on fatigue behavior of the gear tooth under different loads mentioned above is studied by using ANSYS with input data (Table 2) acquired from the experimental S-N data of 17CrNiMo6 steel with different RA contents [3].
Table 1 Experimental data of stress (S) (in MPa) and the number of cycles to failure (Nf) used in fatigue analysis of uncarburized [43] and carburized [25] gear with 0.9 mm case depth using Ansys.
| Uncarburized | Carburized | ||
|---|---|---|---|
| S | Nf | S | Nf |
| 425 | 11818 | 850 | 1 ×10⁶ |
| 396 | 17150 | 900 | 3.5 ×10⁵ |
| 365 | 46349 | 1000 | 7.5 ×10⁴ |
| 327 | 129619 | 1100 | 1.9 ×10⁴ |
| 300 | 294496 | 1100 | 8.7 ×10⁴ |
| 279 | 449772 | 1200 | 4.8 ×10³ |
| 262 | 733053 | 1300 | 1.5 ×10³ |
Table 2 Experimental data of stress (S) (in MPa) and average number of cycles to failure (Navg) used in fatigue analysis of gears with different RA content using Ansys [3].
| Low RA | High RA | ||
|---|---|---|---|
| S | Navg | S | Navg |
| 1750 | 9 ×10³ | 2100 | 1.5 ×10⁴ |
| 1500 | 1.95 ×10⁴ | 1950 | 2.17 ×10⁴ |
| 1250 | 7.33 ×10⁴ | 1650 | 2.2 ×10⁴ |
| 1100 | 1.5 ×10⁵ | 1350 | 5.93 ×10⁴ |
| 950 | 2.38 ×10⁵ | 1100 | 8.7 ×10⁴ |
| 900 | 7 ×10⁵ | 900 | 5.13 ×10⁵ |
| 800 | 2.75 ×10⁶ | 800 | 3.39 ×10⁶ |
| NA | NA | 750 | 6.41 ×10⁶ |
| NA | NA | 700 | 6.73 ×10⁶ |
| NA | NA | 650 | 107 |
3.3.1. Macroscale fatigue modeling: results and discussion
The fatigue simulation results show that the carburized gears have better fatigue life than the uncarburized gears (Fig. 6a and b), especially the area of poor fatigue life around the surface of the gear tooth has decreased. Fig. 6c shows the equivalent alternating stress in the gear tooth shown in Fig. 6b. The equivalent alternating stress is the stress that is compared with the S-N curve in order to determine the fatigue life after accounting for fatigue loading type, mean stress effects, multi-axial effects and any other factors [44,45]. The equivalent alternating stress considered in the present work is given by
where ${{\sigma }_{a}}\left( =\frac{{{\sigma }_{max}}-{{\sigma }_{min}}}{2} \right)$ is stress amplitude, ${{\sigma }_{m}}\left( =\frac{{{\sigma }_{max}}+{{\sigma }_{min}}}{2} \right)$ is mean stress, σu is ultimate tensile stress, σmax is maximum stress and σmin is minimum stress in a stress cycle [45]. A high equivalent alternating stress at the tooth root can be seen, where crack initiation and propagation could be expected. The range of equivalent alternating stress values, both within the carburized case as well as just below the case, are in agreement with the range of stresses applied in the high stress regime of the phase-field simulations (Fig. 2a).
Fig. 6.
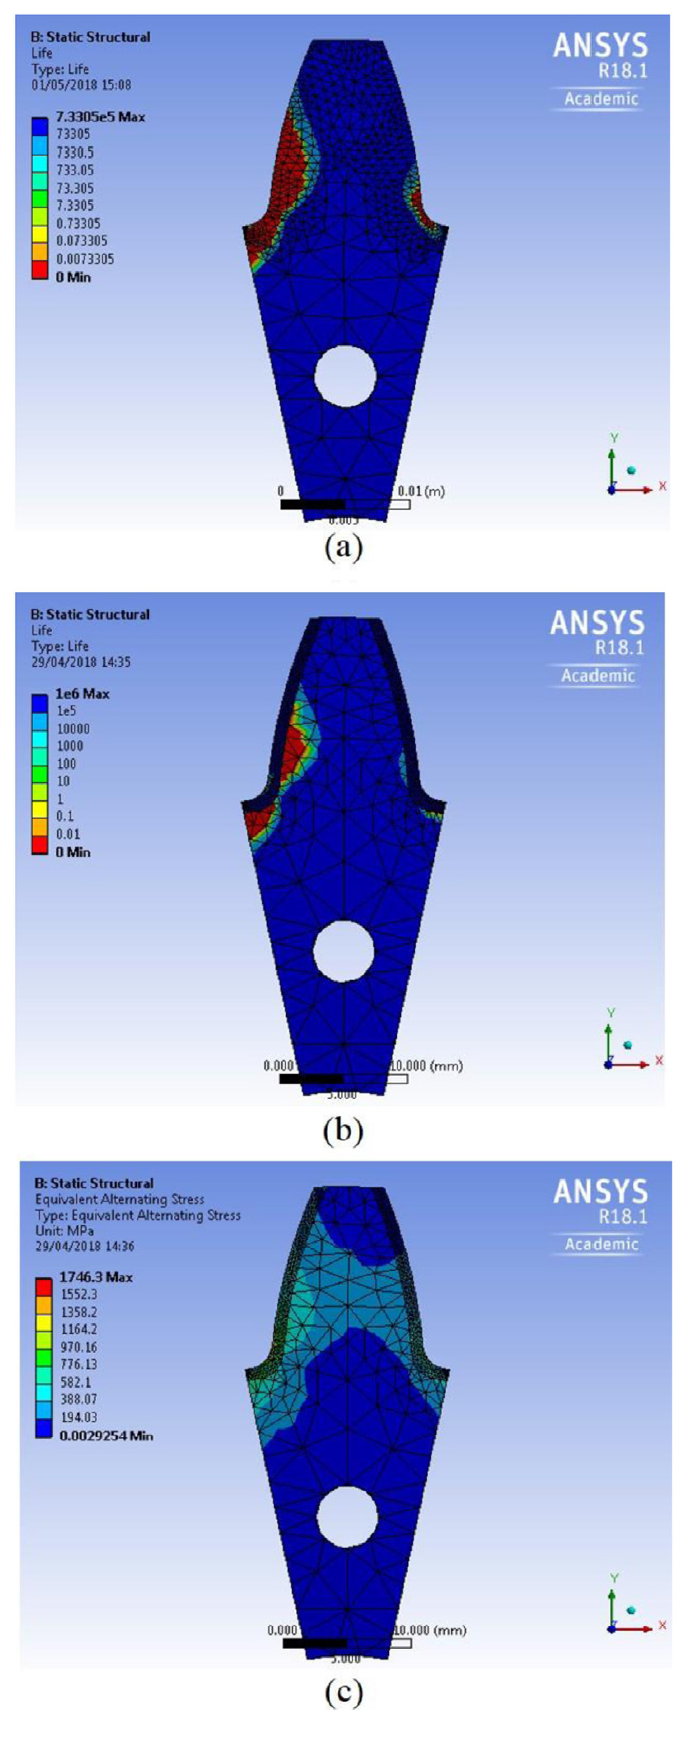
Fig. 6.
ANSYS results of fatigue life of (a) uncarburized and (b) carburized gear tooth with case depth of 0.9 mm under a force of 50 kN at 45º with X-axis, (c) corresponding equivalent alternating stress of gear tooth shown in (b).
The equivalent alternating stress values (Fig. 7a) obtained in a carburized case containing high RA content under a force of 10 kN are in agreement with the range of stresses studied in the low stress regime by using the phase-field model (Fig. 2a). The corresponding von Mises equivalent stress values, i.e. 500 ̶ 645 MPa (Fig. 7b), just below the surface are also in agreement with the mean equivalent stresses, i.e. 515 ̶ 630 MPa (Fig. 2b), observed in the low stress regime of the phase-field simulations of an austenite grain, where the grain is assumed to be at a depth of 0.17 mm below the surface.
Fig. 7.
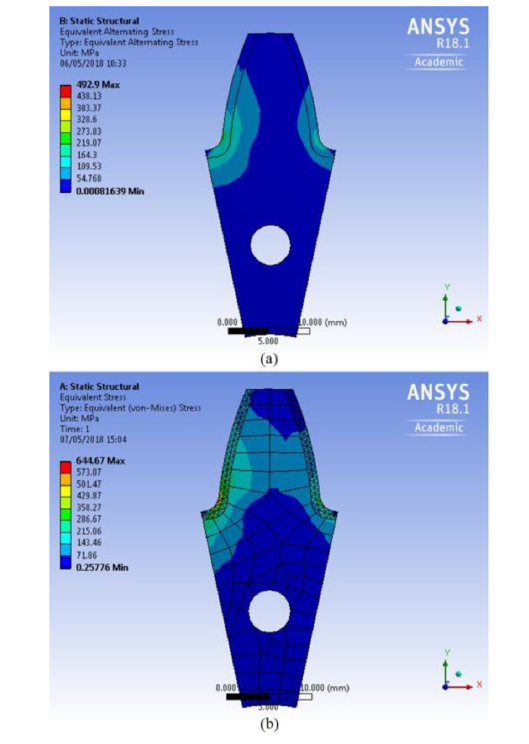
Fig. 7.
ANSYS results of (a) equivalent alternating stress and (b) von Mises equivalent stress in gear tooth with a carburized case containing high RA content under 10 kN force at 45º with X-axis.
The stress contours obtained in Figs. 6c and 7 are qualitatively in agreement with those observed in photoelastic studies [46] and finite element (FE) analysis [2]. Li et al. studied the effect of carburization and residual stresses on bending fatigue of a spur gear using FE model [2]. The equivalent alternating stress plots (Figs. 6c and 7 a) show that the maximum stress is experienced at the tooth root, in agreement with Li et al.’s bending stress analysis [2]. The von Mises equivalent stress contours are also in agreement with those obtained by Li et al. [2]. The maximum von Mises equivalent stress is observed immediately below the contact surface, in agreement with Li et al. However, Li et al. observed that the maximum von Mises equivalent stress was obtained at the point of contact, whereas the present results show it at the tooth root. The differences in the results are attributed to the magnitude of the load, location of loading and other simulation parameters. Fig. 8 shows that the carburized case with high RA (Fig. 8b) gives rise to a better fatigue life compared to that with low RA (Fig. 8a). The regions with lowest fatigue life (red) are less in the carburized case with high RA compared to the one with low RA. The larger depth of minimum life in Fig. 8a shows that the case with low RA would be more prone to crack propagation at lower stresses and at fewer cycles.
Fig. 8.
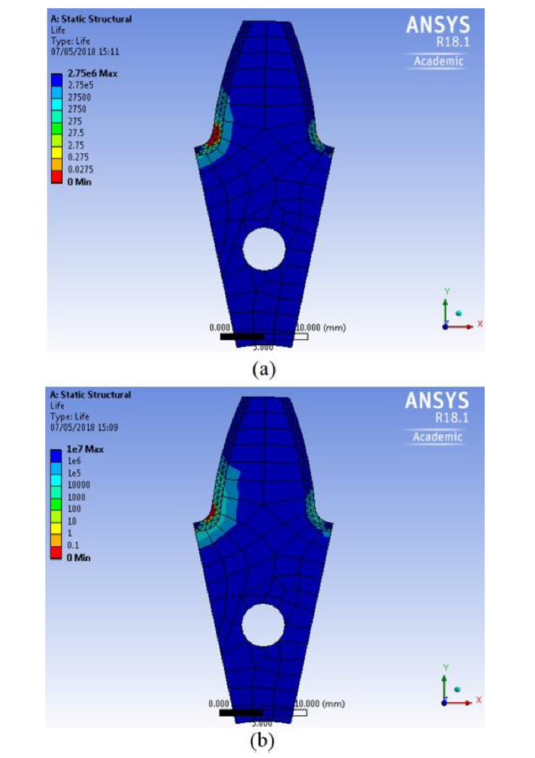
Fig. 8.
ANSYS results of effect of RA on fatigue life. (a) Low RA and (b) high RA gear tooth under a force of 100 kN at 45º with X-axis.
4. Conclusions
In the present work, different modeling approaches are used at different length scales to study the carburization process of SAE8620 steel spur gear, microstructure evolution as well as its effect on macroscopic fatigue properties of the gear. The diffusion model based on Fick’s second law of diffusion predicted a case depth of 0.9 mm when carburized at 1173 K for 2 h, which is in good agreement with experimental data. The case depth increases with increasing heat treatment time as well as heat treatment temperature, in agreement with experimental results [21,25,26].
The phase-field simulations show that the martensitic microstructure is of lath-type. The simulations show that retained austenite (RA) transforms to martensite during stress cycling, in agreement with Refs. [3,[5], [6], [7], [8]]. RA does not readily transform to martensite in a high RA sample in the low stress regime, whereas in high RA samples it transforms relatively easily to martensite in the high stress regime, in good agreement with Ref. [37]. High residual stresses can be beneficial to martensite formation during low stress regime, whereas low residual stresses can be beneficial to martensite formation during high stress regime. Reverse transformation of martensite to austenite is also observed in the low RA sample during the unloading part of each stress cycle of the high stress regime, due to the interaction between high residual stresses and high external stresses. The highest percentage increase in plastic strain per 1% increase in martensite volume fraction is observed in high RA sample in the low stress regime (Fig. 2d).
The macroscale fatigue simulations using ANSYS show that the carburized gears have better fatigue life than the uncarburized gears. The carburized case with high RA (Fig. 8b) gives rise to a better fatigue life compared to that with low RA. The range of microscopic stresses applied on the austenite grain studied in the phase-field simulations as well as the mean von Mises equivalent stresses are in agreement with the respective macroscopic stress values observed in ANSYS simulations.
Acknowledgments
This work made use of the HPC resources at Newcastle University, UK.
Reference
Microstructure and Fatigue Strength of High Performance Gear teels
Ph.D. Thesis,
Carburizing - Processing nd Performance

AbstractA phase field model is presented for simulating grain growth in materials containing small incoherent second-phase particles that are constant in time. The model of [L.-Q. Chen, W. Yang, Phys. Rev. B 50 (1994) 15752] for grain growth in single phase materials, that represents a polycrystalline microstructure with a set of phase field variables ηi(r,t), has been modified to incorporate the presence of second-phase particles by adding an extra term to the free energy expression, with Φ a spatially dependent parameter that equals one inside the particles, and zero elsewhere and ? a positive constant. The interaction between a particle and a diffuse interphase is analyzed from an energetic point of view and the effect of pinning particles on the shape and the evolution of an initially spherical grain is studied for two-dimensional and three-dimensional systems.]]>
AbstractThe Phase Field Microelasticity theory is developed for proper multivariant martensitic transformations. The model is based on the exact solution of the elasticity problem in the homogeneous modulus approximation. The model takes into account the transformation-induced coherency strain and provides for the strain compatibility throughout the system. Computer simulations are performed for a dilatationless cubic→tetragonal martensitic transformation and for the transformation with parameters corresponding to a martensitic transformation Fe–31%Ni alloy. The development of the martensitic transformation through nucleation, growth and coarsening of orientation variants is simulated at different levels of undercooling. The simulated martensitic structure has a complex polytwinned morphology. Simulation demonstrates that the presence of a non-zero volumetric component in the transformation strain in the Fe–31%Ni system significantly affects the martensitic transformation.]]>
In the present work a 3-D elastoplastic phase-field (PF) model is developed, based on the PF microelasticity theory proposed by A.G. Khachaturyan and by including plastic deformation as well as anisotropic elastic properties, for modeling the martensitic transformation (MT) by using the finite-element method. PF simulations in 3D are performed by considering different cases of MT occurring in an elastic material, with and without dilatation, and in an elastic perfectly plastic material with dilatation having isotropic as well as anisotropic elastic properties. As input data for the simulations the thermodynamic parameters corresponding to an Fe-0.3%C alloy as well as the physical parameters corresponding to steels acquired from experimental results are considered. The simulation results clearly show autocatalysis and morphological mirror image formation, which are some of the typical characteristics of a martensitic microstructure. The results indicate that elastic strain energy, anisotropic elastic properties, plasticity and the external clamping conditions affect MT as well as the microstructure. (C) 2011 Acta Materialia Inc. Published by Elsevier Ltd.
Martensitic Transformations in Steels - a 3D Phase-Field Study
h.D. Thesis, KTH Royal Institute of Technology,
Fundamentals of Materials Science and Engineering, John iley and Sons
Computational Methods for Plasticity Theory and Applications, John Wiley and Sons Ltd
.,
Atlas of Stress-Strain Curves
2nd ed.,
Simulation of Precipitation Kinetics in Interstitial-Free and ake-Hardening Steel
Ph.D. Thesis,
roceedings of International Conference on Fatigue and Fatigue Tresholds, atigue’90
Fatigue Life Evaluation of Heat Treated and PVD Coated Low Alloy Steels
Ph.D. Thesis,
Calculating and Displaying Fatigue Results
Properties and Manufacture

 WeChat