

1. Introduction
Cobalt-chromium-molybdenum (CoCrMo) alloys have wide applications in manufacturing dental implants [1,2] and orthopedic implants such as hip and knee implants [3] due to the CoCrMo’s superior strength, resistant to corrosion, and stress fatigue. The fabrication processes will influence the mechanical properties of the work materials. The fabrication of CoCrMo alloys includes casting, cutting, and forging, which are usually difficult to perform due to the material’s high melting temperature, hardness, and limited ductility. In addition, casting produces large grains and metallurgical imperfections which lead to reduced mechanical properties. Traditional lost-wax casting is regularly used in the manufacturing of near net shape orthopedic implants. But the complex casting process chain consists of wax pattern making, investing, wax elimination, casting, devesting, finishing, and polishing. Forging used for manufacturing medical implants typically involves sophisticated presses and complex tooling, which makes the process very time-consuming and labor intensive. Efforts to reduce manufacturing cost and improve productivity are needed since CoCrMo medical devices are expensive.
The flexibility of selective laser melting (SLM) enables it a powerful process to produce customized, geometrically complex medical implants directly from CAD models in terms of reduced operation error, cost, and improved repeatability compared to traditional manufacturing processes [4]. Some studies have shown that the SLM produced superior mechanical [[5], [6], [7], [8]] and biocompatible properties [9] are better than those by conventional manufacturing processes. Takaichi et al. [2] confirmed that the mechanical properties were higher than those of an as-cast alloy. Metal elution in the as-SLM builds was less than that of as-cast alloy due to the unique fine cellular dendrites with elongated grains in the building direction. It is also found that the SLMed dental CoCr alloy exhibited better microstructures (γ + ε, no harmful needle σ phase) and higher strength [5,10] than those fabricated by milling and casting. Kajima [11] found that SLMed CoCrMo alloy also exhibited significant longer fatigue life than that of the as-cast material.
SLM often produces severe residual stress gradients due to its unique thermal cycle of rapid melting, cooling, and melt-back, which may deteriorate part performance and even lead to microcrack or part distortion. Therefore, post-heat treatment to relieve residual stress and tune the microstructures and mechanical properties are required. On the other hand, the presence of residual stress in the high density of dislocations may significantly affect the hardness and wear resistance. Therefore, appropriate heat treatment should be chosen for specific applications.
As-cast CoCrMo alloy has two phases: γ-FCC phase and ε-HCP phase, which are stable at low and high temperatures, respectively. Heat treatment can be employed to improve the mechanical properties via altering both the volume fractions of the two distinct phases and tuning microstructural features such as grain size, orientation texture, and second phase precipitation [[12], [13], [14], [15]]. The transition from γ-FCC phase to ε-HCP phase would have a significant influence on mechanical and wear properties [16,17]. Several studies have reported that the formation of hexagonal ε phase caused the increase of wear resistance for Co-based alloy [13,16,18] despite the inherent HCP brittle behavior compared to the FCC phase.
The literature analysis has shown that some tensile properties and anisotropy have been investigated for the as-SLM and heat-treated CoCrMo alloys [2,6,19]. However, the microstructural evolution and its implication on wear performance or scratch resistance remain to be understood for CoCrMo alloy from selective laser melting to heat treatment, which is critical to orthopedic applications. This work aims to investigate the microstructural evolution induced from SLM to subsequent heat treatment and the microstructure effect on scratch resistance and anisotropic frictional characteristics.
2. Experimental
2.1. CoCrMo powders
The material used in this study is CoCrMo alloy power (BEGO, German) with the chemical compositions (Table 1). The SEM morphology (Fig. 1) shows nearly spherical powders with some satellites on the particle surfaces. The distribution of particle size (Fig. 2) was characterized by a laser particle size analyzer with the particle size distribution of d10 = 17.1 μm, d50 = 30 μm, d90 = 155 μm based on volume distribution. This shows that 10%, 50% and 90% of the particle size distributions are less than the nominal diameters, respectively.
Fig. 1.
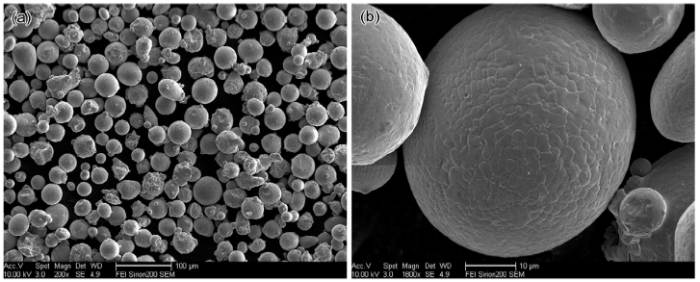
Fig. 1.
SEM images of CoCrMo alloy powders at low (a) and high (b) magnification.
Fig. 2.
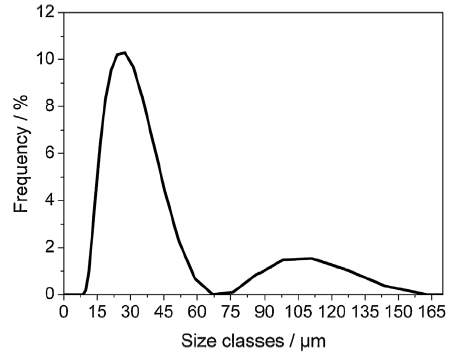
Fig. 2.
Powder particle size distribution.
2.2. Sample fabrication
All samples were prepared by SLM on an EOS M270 machine on the 316 L stainless steel baseplate of 250 mm × 250 mm at the deposition conditions in Table 2. The scanning strategy and the corresponding building direction (BD) are shown in Fig. 3(a). A 67° rotation of the laser vector between successive layers was employed. The chessboards with each having an area of 3000 μm × 3000 μm can be seen on the last layer morphology in Fig. 3(b).
Table 2 SLM setup and process parameters.
| Layer power | Spot size | Scan speed | Layer thickness | Preheating | Scan spacing |
|---|---|---|---|---|---|
| 195 W | 100 μm | 1200 mm/s | 20 μm | 80 °C | 90 μm |
Fig. 3.
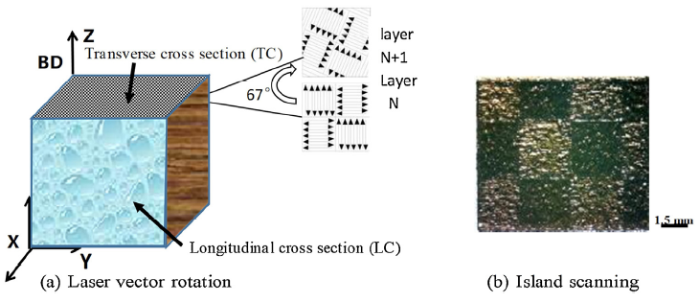
Fig. 3.
Scanning strategy and sample build direction (BD).
After SLM fabrication, three subsequent heat treatment routes HT1, HT2, and HT3 (Fig. 4) were performed in an argon atmosphere to minimize oxidation. The HT1 samples were heated up to the 450 °C with a rate of approximately 30 °C/min and held for 45 min., and then reheat the sample to 750 °C and held for 60 min. Furnace cooling to room temperature was employed. Additional aging for 100 min. at 450 °C was conducted for HT2 samples. The recrystallization annealing at 1150 °C for 120 min. was employed for the HT3 samples.
Fig. 4.
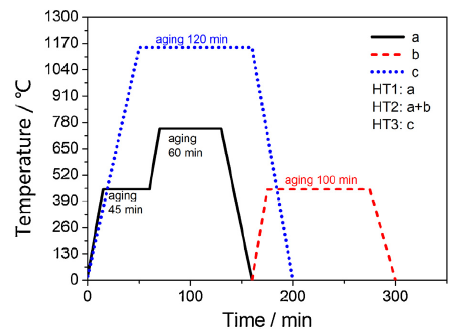
Fig. 4.
Aging heat treatment routes.
2.3. Microstructural characterization methods
The cross-sectional microstructures in transverse and longitudinal directions (see Fig. 3) were examined by means of optical microscopy (OM), scanning electron microscopy (SEM), and electron backscatter diffraction (EBSD) for the as-SLM and aged SLM samples. The examined samples were ground, polished, and then electropolished in the mixed solution of CH3CH2OH (80%) and HClO4 (20%). EBSD mapping was performed (step size 0.5 μm) to map EBSD orientation using EDAX OIM associated with the SEM (Apreo S) to obtain the Kikuchi patterns. Inverse pole figures (IPF) maps were used to analyze the grain texture. In addition, GB misorientation angles were used to reconstruct the grain boundary (GB) character distributions.
For further microstructural details, the polished surfaces were further etched in the solution HCl and H2O (1:9 vol.%) under 4 V for 5 s. OM and field emission SEM was used to examine the microstructure. Bruker D8 X-ray diffractometry (XRD) was employed to identify the phase and precipitation.
2.4. Nanoindentation
Hardness and scratching resistance were measured using a Berkovich nanoindenter (Nanotest Vantage Alpha) for the as-SLM and aged samples at room temperature. The indents were made using load-controlled mode at 200 mN with the loading and unloading rate of 10 mN/s and 8 mN/s, respectively. The dwell time is 10 s at the target load. In order to generate the data with a statistical nature, at least 5 indentations were selected at the bottom, middle, and top locations to generate a total of 15 measurements performed on the longitudinal cross-sections.
At least three loading paths on both the longitudinal cross-section (LC) and transverse cross-section (TC) were selected to perform the nano scratching tests (Fig. 5). The nanoindenter with a penetration load of 200 mN and a constant loading speed of 10 mN/s was used. The scratching length was 600 μm and the first 20 μm length from the start point was not loaded. The load increased along the path varying from 20-40 μm at a speed of 10 mN/s and then the load of 200 mN was uniformly applied on the sample surface as shown in Fig. 5.
Fig. 5.
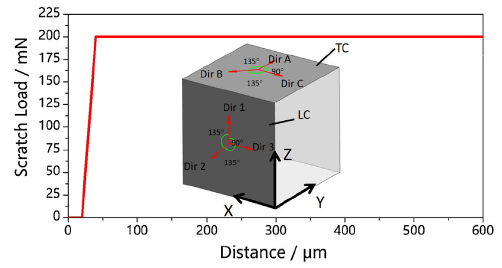
Fig. 5.
Details of scratch loading and the locations of scratch testing.
3. Results and discussion
3.1. Microstructural characterization
3.1.1. Microstructural morphology
Fig. 6 shows the surface microstructure after etching in the four sample types. It is clear to see the track segments and fish scale morphology on the cross-sections in transverse and longitudinal directions, respectively. The width of melt track is approximately 95 μm, a little larger than the scanning space (90 μm). The reason may lie in that a certain width of the heat-affected zone was formed when the laser beam spot diameter of 100 μm acted on the metal powder layers due to heat irradiation and conduction, which slightly made the track wider than the scanning space. The largest width of melt track is around 120 μm comparable to the laser spot size (100 μm). The track segments are not continuous due to the laser penetration from the subsequent layer re-melted the previously solidified track.
Fig. 6.

Fig. 6.
Surface morphologies on the transverse cross-section (TC) ⊥ to build direction and longitudinal cross-section (LC in two different scales) // to build direction of the samples after polishing and etching.
After heat treatments, HT1 and HT2, the track segment and fish scale morphology remain on the transverse and longitudinal cross-sections, respectively. However, more microstructural details are observed, which might be due to element enrichment along the grain boundary and slight grain growth during heat treatment. It can be seen that some columnar structures typically formed across 2-3 melting pools via epitaxy growth during solidification labeled by the red arrows in Fig. 6(c, f and i). The abrupt termination of columnar grains might be caused by the variation of the heat flux direction during SLM. The heat flux direction depends on the morphology of melt pool, which becomes relatively irregular and tends to make the heat flux direction diverges when the scanning speed (1200 mm/s) is high. Upon heat treatment at 1150 °C (HT3), the homogeneous equiaxed grain microstructure mixed with the second phase appeared instead of traces of melt track and melt pool boundary as evidenced in Fig. 6(j-l), suggesting the occurrence of recrystallization.
To have a close-up examination of the microstructure, SEM maps with high magnification are given in Fig. 7 for all the samples. It can be seen fine cellular dendrites or columnar dendritic structures were found in the as-SLM and HT1 and HT2 samples. The cell size or dendrite space is approximately 0.2-0.5 μm. It seems that the size and the growth direction of the cells have changed considerably when grains crossed the track boundary. However, the close-up examination revealed that the growth direction of some cells around the track boundary is either continuous along the same cell growth direction or rotated by 90° in as-SLM CoCrMo alloy as indicated by green arrows in Fig. 7. The same phenomena were also found in the literature [20]. It is well understood that the cell growth direction was typically parallel to the largest temperature gradient perpendicular to the boundary of the melting pool [21]. However, this is not always the case as shown in Fig. 7. It is because the cell growth direction is also influenced by crystal orientation constraint. That is, the inherent preferential orientation, for example, <001> direction in a cubic structure, was not always consistent with the normal direction of the melt pool bottom, from which the heat flux direction deviated when scanning speed is high as described in the previous paragraph. The magnified SEM maps also indicated that bright ultra-fined precipitation-like zone (indicated by red arrows in Fig. 7(d), (h), (l)) with the size ranged from tens of nm to several hundred nm along the cell or dendrite boundaries was formed in the as-SLM, HT1, and HT2 samples. By comparison, some larger bright precipitates with the size of 1 μm were also observed along the grain boundaries and relatively finer precipitate with the averaged size of 300 nm inside grains are distributed within grains in the HT3 sample. It should be noted that many less bright spheres with the size of a few hundred nanometers as indicated by blue arrows in Fig. 7(d), (h), (l) might be the result of balling formed during SLM.
Fig. 7.

Fig. 7.
SEM images of longitudinal cross sections // build direction after etching. (a-d) as-SLM; (e-h) HT1; (i-l) HT2; (m-p) HT3.
CoCrMo alloys have two main equilibrium phases: FCC (γ) and HCP (ε), which are equilibrium phases at high and room temperatures, respectively, according to the phase diagram. However, the γ→ε phase transformation is unlikely to occur at normal cooling conditions, the γ phase is typically remained at room temperature. It was assumed that a variety of precipitates be formed inside the grains and along the grain boundaries after different heat treatments [22]. EBSD, EDS and XRD analyses were integrated to determine the precipitate phases in this study. Fig. 8 shows the two main phase distributions based on the EBSD measurement in the as-SLM and aged samples. The fraction of ε phase was quite different among these samples. Nearly 1.8% ε phase was produced during SLM. After aging, the amount of ε phase increased and reached as much as 10% in the HT1 and HT2 samples. The treated sample at 1150 °C (HT3) contains a very limited ε phase. For the as-SLM sample, there is a possibility to obtain thermally transformed ε phase because of the rapid cooling rate from the melting temperature during SLM.
Fig. 8.

Fig. 8.
Phase distribution for the samples.
However, the extremely small amount of ε phase suggested that the ε phase might be resulted by the in-situ aging heat treatment. That is, the previous build layer was repeatedly heated by the subsequent melting layers. Upon subsequent aging (HT1 and HT2), nearly 10% ε phase is induced, which should be isothermally phase transformation when aging at a temperature between 650 -950 °C [[23], [24], [25], [26], [27]]. A very limited ε phase in the sample HT3 suggested that nearly no ε phase transformation occurs upon high-temperature annealing. Kajima’s study [22] also evidenced that the amount of ε phase decreased when increasing the heating temperature and approached to zero at 1150 °C.
To determine the bright ultra-fined precipitation-like zones observed along the cellular boundaries in the as-SLM, HT1, and HT2 samples and bright regular-shaped precipitates in the HT3 sample, SEM-EDS analysis was conducted in the interested regions as denoted by digital numbers 1-10 in Fig. 7. The results were listed in Table 3. It is revealed that little chemical compositional difference was found between the bright ultra-fined precipitation-like zones such as those denoted by numbers 5-8 and the matrix except for a relatively higher content of element W and Mo. Such microsegregation zones were induced by constitutional supercooling upon rapid cooling in SLM. The addition of W or Mo typically has a purpose of grain refinement and thereby enhancing mechanical properties [28]. The absence of intermetallic compounds might enhance the favorable effect [29] and contribute to the ultra-fined cell size (0.2-0.5 μm) in this study. In contrast to this study, σ precipitates are determined by the compositional examination using SEM-EDS along the cellular boundaries in the study [2], in which the cell size is about 2.7 μm. High-resolution EBSD was also performed and found no ε phase occurred along the cellular boundaries (Fig. 9). Instead, more ε phases are prone to occur along the grain boundary (GB).
Table 3
EDS results of different areas corresponding to
| No. | Phase | Co | Cr | Mo | W | Si |
|---|---|---|---|---|---|---|
| 1 | Matrix | 62.12 | 25.95 | 5.09 | 6.52 | 0.68 |
| 2 | Matrix | 61.12 | 27.07 | 4.96 | 6.03 | 0.81 |
| 3 | Matrix | 63.52 | 25.46 | 5.03 | 4.98 | 1.01 |
| 4 | Matrix | 61.56 | 28.13 | 4.62 | 4.08 | 1.61 |
| 5 | Microsegregation zone | 57.97 | 24.02 | 5.87 | 11.07 | 1.07 |
| 6 | Microsegregation zone | 57.20 | 25.65 | 5.55 | 10.98 | 0.62 |
| 7 | Microsegregation zone | 56.40 | 24.82 | 5.65 | 12.23 | 0.90 |
| 8 | Microsegregation zone | 59.13 | 24.01 | 6.21 | 9.90 | 0.75 |
| 9 | Laves | 42.50 | 18.01 | 10.13 | 22.92 | 6.44 |
| 10 | Sigma | 42.60 | 34.98 | 14.12 | 7.32 | 0.98 |
Fig. 9.
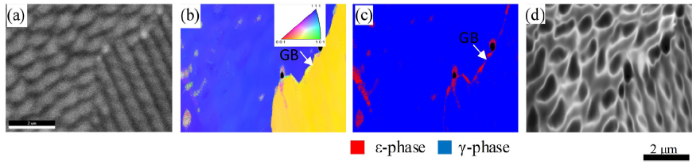
Fig. 9.
High-resolution EBSD map in the HT1 sample: (a) cellular grain morphology. (b) OIM based on IPF; (c) two phases distribution; (d) EBSD image quality.
For the HT3 sample, two kinds of precipitation were observed in Fig. 6. One is located inside the grains (for example site #10) with an average size of 300 nm and the other (for example site #9) is larger with an average diameter of 1 μm and precipitate along the grain boundaries. The EDS results showed that fine precipitation with a high content of Cr within the grains is assumed to be σ phase as listed in Table 3. The larger precipitation along grain boundaries possesses extremely low Cr content and high W content and assumed as laves phase [14,22].
X-ray examination was performed on the longitudinal cross-sections of the samples. The results are shown in Fig. 10. A weak peak from ε phase emerges in addition to the dominant γ phase peak in the HT1 and HT2 samples. The absence of ε peak is due to the very small amount of ε phase that cannot be readily detected in the SLM and HT3 samples. The result is consistent with that obtained by the EBSD measurement as shown in Fig. 8.
Fig. 10.
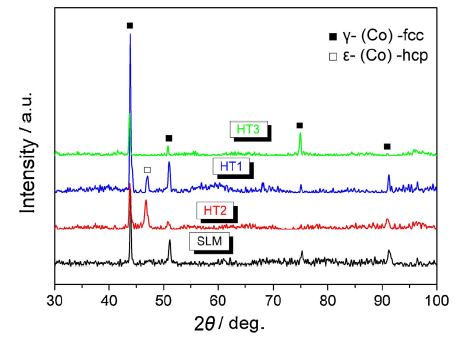
Fig. 10.
XRD patterns of the samples.
3.1.2. Orientation image microscopy (OIM) and grain boundary character distribution (GBCD)
Fig. 11 shows the EBSD-reconstructed OIM and GBCD maps on the cross-sections in transverse and longitudinal directions, respectively. There are no remarkable OIM differences among the samples from as-SLM to HT1 and HT2 (Fig. 11(a-c) and Fig. 10(e-g)). The equiaxed grains morphology with an average size of 25 μm is found in the transverse cross-sections perpendicular to building direction (BD). The elongated columnar grain morphology is clearly seen in spite of the aspect ratio of less than 4:1 in the longitudinal cross-sections parallel to BD.
Fig. 11.

Fig. 11.
EBSD reconstructed OIMs (a-d and e-h) and GBCDs (a’-d’ and e’-h’) on the transverse cross-section (TC) and longitudinal cross-section (LC) for the samples. The grain boundaries of different misorientations were labeled by the color lines in
A similar GBCD result was also obtained for the as-SLM, HT1, and HT2 samples (Fig. 11(a’-c’) and Fig. 11(e’-g’)). Very dense sub-grain boundaries, as an indicator of dislocations, represented by purple lines were present due to the high residual internal stress during SLM. Post aging might lead to recovery to a certain degree, but the dislocation density is still very high. Only after annealing at 1150 °C, columnar grains disappear and homogenized microstructure (Fig. 11(d) and (h)) was resulted both in the transverse and longitudinal cross-sections. And the dislocations and therefore sub-grain boundaries are near completely dissolved and recrystallization grains containing many annealing twins emerge in Fig. 11(d’) and (h’). The fractions of various grain boundaries including twin boundary (TB) with the angle/axis pair of 60°/<111> are shown in Fig. 12. It was suggested that a large population of TBs is generated at the expense of sub-grain boundaries with misorientation of 1°-3° [30]. It is well recognized that twin boundaries, typically referred as special grain boundaries due to possessing the extremely low interface energy compared to general high angle grain boundaries, have the potential to enhance the intergranular corrosion resistance when they are highly populated in FCC metals [31,32]. It is expected to improve the corrosion resistance of CoCrMo alloys when used in biomedical applications.
Fig. 12.
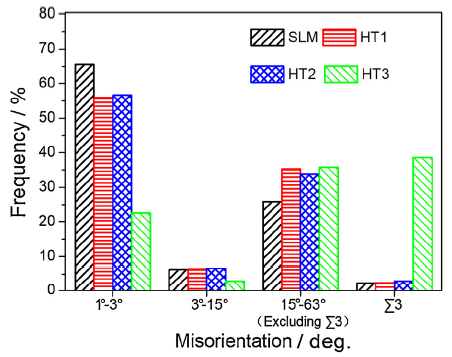
Fig. 12.
Fractions of various grain boundaries.
Fig. 13 shows the inverse pole figure (IPF) in BD, indicating that a very weak fiber texture of <110> // BD was present for the as-SLM sample with the intensity of less than 2. Upon subsequent heat treatment, the texture almost doesn’t change. The cubic texture (<001 > // BD) is usually found in FCC γ phase after SLM [2,[33], [34], [35], [36]] despite <110> //BD type fiber texture is also observed in the SLMed NiCr γ phase [[37], [38], [39]]. Takaichi et al. [2] analyzed the influence of input energy density on the SLMed Co-29Cr-6Mo alloy via modifying the laser powder from 75-200 W and laser scanning space 0.1-0.3 mm with the scanning speed of 50 mm/s. They observed that the γ phase has a preferential <001> orientation in the building direction at the lower input energy. In the current study, the input energy is approximately 90 J/mm3, which is lower than that (100-800 J/mm3) employed in Takaichi’s study. The nearly random texture is quite different from the results obtained in Takaichi’s study. The big discrepancy might come from two aspects. The first is the chemical composition difference in the material employed in the two studies. Higher Cr and Mo contents in the Takaichi’s study might have an influence on the resulted texture. The second one might be attributed to the difference in scan strategy and speed. In this study, the chessboard in every layer and a 67° rotation of the laser vector between successive layers were employed to change the melt pool orientation and therefore the solidification region between layers, especially at the high scanning speed of 1200 mm/s. As a result, the strong epitaxy growth might dissolve as shown in Fig. 11. It is expected that a larger and deeper melt pool caused by the higher energy density generates a strong columnar grain structure with significant <100> texture along the build direction [2,40,41]. However, the low energy density was produced in the current study due to the high scanning speed of 1200 mm/s, which is much higher than 50 mm/s employed in Takaichi’s study on the SLMed CoCrMo alloy. Therefore, the strong columnar grains with the <100> texture may not be sustainable and could be changed, for instance, into <110> direction.
Fig. 13.
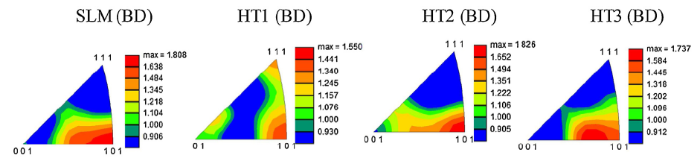
Fig. 13.
Inverse pole figure (IPF) maps of BD direction.
3.2. Nanohardness characterization
The hardness value for each sample was determined from the recorded load-depth curves and the average hardness value (Fig. 14) was calculated accordingly for the different locations of the longitudinal and transverse cross-sections. It shows that the hardness is increased after aging treatment (HT1 and HT2). In contrast, the hardness decreases significantly after HT3 route. According to the discussion on microstructural evolution, the HT1 and HT2 routes didn’t cause much change to the microstructure morphology in terms of dendritic cells and microsegregation zones along the cellular boundary except for the introduction of ε phase. So, the increased hardness should be mainly attributed to the presence of ε phase after HT1 and HT2. To verify this point, six nanoindentations were performed in each phase of the γ matrix and ε phase with a load of 100 mN in Fig. 15(b), the corresponding EBSD-reconstructed phase distribution is shown in Fig. 15(a). To ensure nanoindentation measurements were performed on the given phases, a micro-hardness indentation was taken prior to EBSD measurement and marked as a reference on the examined surface. It is found that γ matrix phase and ε phase have an average hardness value of 5.12 GPa and 6.26 GPa, respectively. Therefore, the presence of nearly 10% ε phase after HT1 and HT2 should be primarily responsible for the increased hardness in contrast to the as-SLM condition. The sharp decrease in hardness for the HT3 sample would be attributed to two main reasons. One is the complete relief of high residual stress introduced during SLM, and the other one is the limited ε phase despite other precipitations such as σ and laves phases are present. In addition, the hardness value is location-specific on the longitudinal cross-section. It slightly decreases from the bottom to the top along the building direction as given in Fig. 14. The position-dependent variation in hardness might be caused by the difference in cooling rate along the build direction during SLM. The relatively rapid cooling rate on the bottom (i.e., close to the baseplate) leads to relatively refined cell size and, therefore, higher hardness compared to the middle and top sections. A recent study indicated that the computed cooling rates decreased progressively with the addition of new layers. The observed refinement of cell structure and the consequent increase in hardness of the deposited 316 austenitic steel in the lower layers agree well with the computed variations of cooling rates in different layers [42].
Fig. 14.
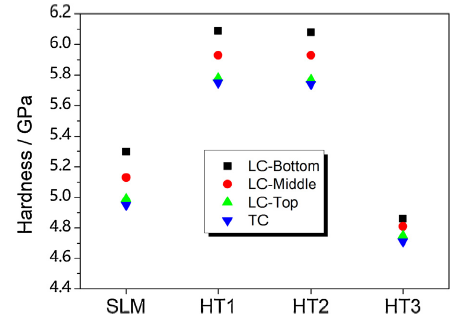
Fig. 14.
Nanohardness variations across the as-SLM, HT1, HT2, and HT3 samples.
Fig. 15.
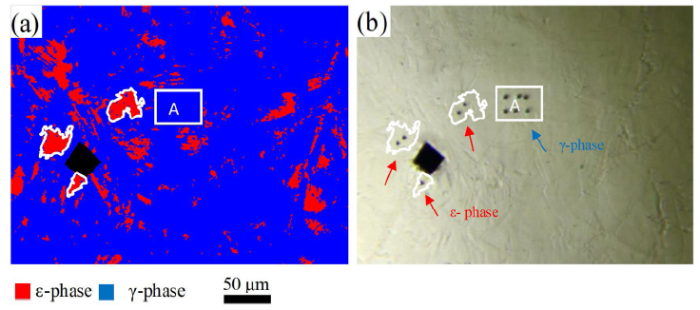
Fig. 15.
Nanohardness examination of ε-phase and γ-phase: (a) EBSD reconstructed phase distribution; (b) nanoindentation within the ε and γ phases.
3.3. Nano-scratch performance
Residual depth is a good indicator for investigating the tribological property of the deposited material. The profile of the residual scratch depth vs. length along three different directions on the longitudinal and transverse cross-sections are shown in Fig. 16. The averaged values of the residual depth vary from 960 μm to 1400 μm along with the different directions on both the longitudinal and transverse cross-sections as shown in Fig. 17. From the scratch profile (Fig. 16) and the calculated averaged residual depth (Fig. 17), it can be seen that the residual depth decreases from the as-SLM sample to the HT1 and HT2 samples but increases sharply for the HT3 sample. It suggests that the HT1 and HT2 samples exhibit the highest tribological properties, and the HT3 sample has the lowest tribological property. The as-SLM sample was a little inferior to the HT1 and HT2 samples but quite better than the HT3 sample. The variation trends are similar to the hardness in Fig. 14. Likewise, the presence of ε phase contributes a lot to the increased tribological property [43,44] in the HT1 and HT2 samples compared to the HT3 sample. And the high residual stress and refined cellular microstructure are key factors responsible for the better tribological property in the HT1, HT2, and as-SLM samples compared to the HT3 sample. It should be noted that the relative excellent tribological property for the HT2 sample might be due to the presence of a little more ε phase after long aging at 450 °C compared to the HT1 sample.
Fig. 16.
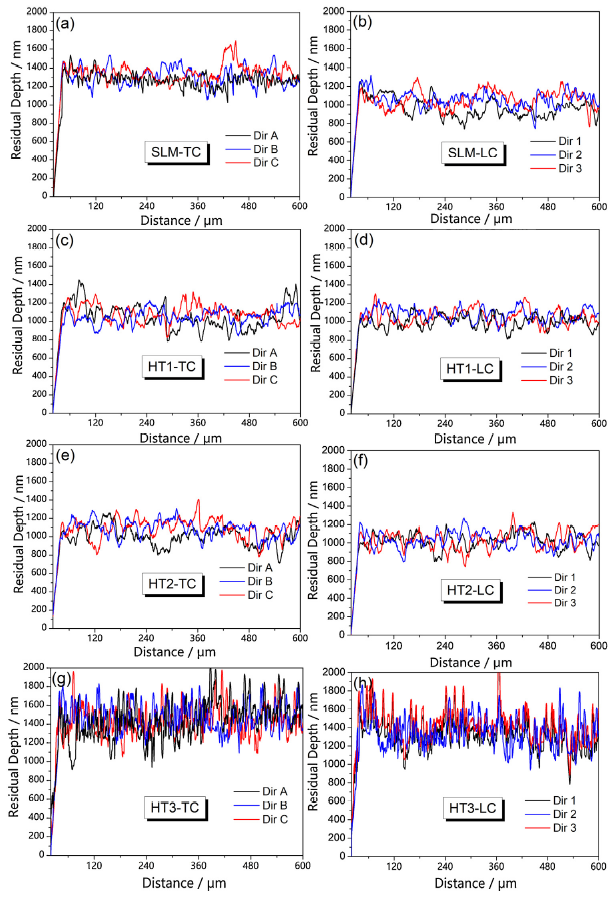
Fig. 16.
Residual scratch depth vs. length in the different directions on the transverse cross section-TC (a, c, e, g) and longitudinal cross section-LC (b, d, f, h).
Fig. 17.
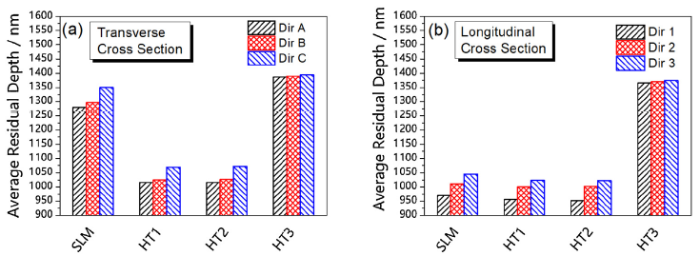
Fig. 17.
Average residual depth in different directions on the transverse (a) and longitudinal (b) cross-sections.
Based on the profile of residual depth, the corresponding coefficient of friction was also calculated and shown in Fig. 18, which varies from 0.29 - 0.37 at different tested sites. The same variation trend with the residual depth was found for the samples under different conditions.
Fig. 18.
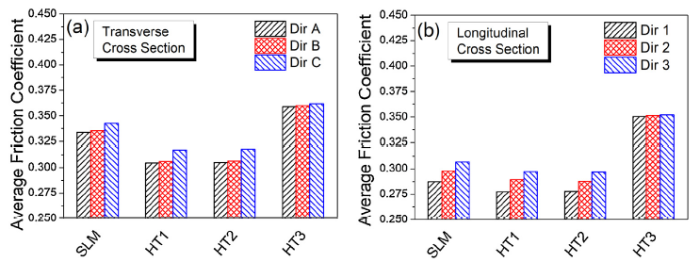
Fig. 18.
Average friction coefficients in different directions on the transverse (a) and longitudinal (b) cross-sections.
In addition, the anisotropy in residual depth was clearly observed in the as-SLM, HT1, and HT2 samples in Fig. 16, Fig. 17, Fig. 18. Overall, low residual depth and friction coefficient on the longitudinal cross-sections was obtained than those on the transverse cross-section. It suggests that the improved tribological property be achieved on the longitudinal cross-section parallel to the building direction. Dense elongated columnar grains and hardness gradient along the building direction on the longitudinal cross-section might contribute to improved tribological property. For the examined sections, the tribological property also has slight anisotropy along with different directions in the samples. Along the building direction, the residual depth is the lowest among the three different directions. The marginal improvement of the tribological property might due to the fine long columnar grain with weak <110> texture along the building direction. It should be noted that nearly no anisotropy in tribological property in the HT3 sample due to its homogeneous microstructure.
4. Conclusions
The evolution of microstructural characteristics and its impact on nanohardness of the CoCrMo alloy from SLM to three different aging routes have been investigated using SEM, EBSD, XRD, and nanoindentation in this study. The key findings are as follows:
(1) Weak <110> texture along building direction and microsegregation along cellular boundaries were detected in the as-SLM and aged samples.
(2) The dense sub-grain boundaries and fine cellular dendrite decorated by microsegregation have a profound hardening effect on the SLMed and subsequently aged alloy. The hexagonal ε phase transformation from the γ matrix occurred and became pronounced after subsequent aging and, therefore, caused the increased nanohardness and scratch resistance for the aged CoCrMo alloy.
(3) Aging at high temperature (1150 °C) induced homogenized recrystallization microstructure free of residual stress but with very limited ε phase, which sharply decreased material nanohardness and scratch resistance.
(4) The friction coefficients on the longitudinal cross-section are lower than the transverse cross-sections for the as-SLM and heat-treated samples. This anisotropy in friction performance may be considered when designing CoCrMo medical implants using laser additive manufacturing.
Acknowledgements
This work was supported financially by the Key R&D Plan of the Ministry of Science and Technology (No. 2018YFB1105900), the Shandong Province Key R&D Project (No. 2018GGX103017) and the Zibo City and SDUT Integration Project (No. 2018ZBXC154).
Reference
Biomaterials for Artificial Organs, second ed.

Methods. A multi-analytical approach has been employed by combining microscopic and bulk compositional tools with electrochemical techniques and chemical analyses of metals in biologically relevant fluids for three differently SLM fabricated CoCrMo alloys and one cast CoCrMo alloy used for comparison.Results. Rapid cooling and strong temperature gradients during laser melting resulted in the formation of a fine cellular structure with cell boundaries enriched in Mo (Co depleted), and suppression of carbide precipitation and formation of a martensitic epsilon (hcp) phase at the surface. These features were shown to decrease the corrosion and metal release susceptibility of the SLM alloys compared with the cast alloy. Unique textures formed in the pattern of the melting pools of the three different laser melted CoCrMo alloys predominantly explain observed small, though significant, differences. The susceptibility for corrosion and metal release increased with an increased number (area) of laser melt pool boundaries.Significance. This study shows that integrative and interdisciplinary studies of microstructural characteristics, corrosion, and metal release are essential to assess and consider during the design and fabrication of CoCrMo dental components of optimal biocompatibility. The reason is that the extent of metal release from CoCrMo is dependent on fabrication procedures. (C) 2014 Academy of Dental Materials. Published by Elsevier Ltd.]]>

 WeChat