

1. Introduction
Titanium alloys are widely used in many fields, including aerospace, marine, automotive, and weaponry, owing to attributes such as low density, high strength as well as good plasticity and toughness. For typical high-speed impact processes such as ballistic penetration and vehicle collision, these alloys are often subject to dynamic loads under service conditions [[1], [2], [3]]. Under such conditions, the alloy exhibits a high adiabatic shear sensitivity due to its low thermal conductivity (6-10 W/(m K)). The consequent severe deformation localization, or adiabatic shear band (ASB) formation, often occurs rapidly during the deformation process, leading to stress collapse and (inevitably) failure. Therefore, an understanding of the ASB evolution mechanism is essential for further development of high-performance titanium alloys.
In 1944, Zener and Hollomon [4] proposed the "thermoplastic instability" constitutive model. They proposed that adiabatic shear deformation occurs after thermal softening exceeds the effect of strain hardening and strain rate hardening, and this conclusion was widely accepted in subsequent related studies. Bassim [5] believed that the competition between work hardening and thermal softening plays an important role in ASB formation and growth. Bonnet et al. [6] studied the dynamic propagation of ASBs under different load conditions by changing the strain rate of compression. They found that the growth and extension of the ASBs are driven by thermal softening during the deformation process. With the development of characterization techniques, more details of plastic deformation have been captured (than in previous years), leading to further understanding of the adiabatic shearing process. Rittel et al. [[7], [8], [9]] found that dynamic recrystallization (DRX), rather than high temperature and high local strain, is likely to be a dominant micromechanical factor in the very initial generation stage of the band. Through microstructural characterization of Ti specimens after dynamic shearing, Landau et al. [10] found that the adiabatic shear zone is closely correlated with the nucleation and growth of DRX. Chen et al. [11] evaluated the relationship between DRX and ASB directly. In addition, the temperature elevation, ASB formation, and load-capacity loss of a pure Ti specimen were investigated using a split Hopkinson pressure bar (SHPB) and a high-speed infrared detector. The results revealed that the temperature rise of the specimen occurs after the ASB formation, confirming that thermal softening plays no role in this formation.
However, at the microsecond level, adiabatic shear expansion rates of 102-103 m/s occur during the deformation process [12]. Tracking the entire process through experimental observation is therefore difficult and, hence, limits further understanding of ASB formation. In contrast to experimental methods, numerical simulations can easily capture the intermediate details of the loading process, and are therefore helpful for investigating the ASB formation mechanism of titanium alloys. Peirs et al. [13] simulated the adiabatic shear behavior of TC4 hat-shaped specimens at high strain rates. The results revealed that the hydrostatic pressure in the sample is closely correlated with the sample shape, and the direction of the maximum shear force gradually becomes the final direction of the ASBs. Liu et al. [14] simulated the failure of TC4 armor to resist ballistic penetration, and found that a periodic change in the hydrostatic pressure will cause a periodic change in the stress triaxiality of the sample. This resulted in a periodic arrangement of ASBs after accumulation of the strain. Based on a series of theoretical physical models proposed by Longere [15], the competitive relationship between the hardening and the softening mechanism of materials under dynamic recovery and DRX was analyzed. In that work, the adiabatic shear behavior of TC4 under a simple shear load was simulated, and the results revealed that the nucleation of recrystallization affects whether thermal softening dominates ASB failure. However, ASB formation in titanium alloys is closely correlated with the microstructural characteristics (e.g., phase morphology, ratio, size, and distribution) of the material. To solve such problems, a multiphase model of titanium alloy, which consists of a homogeneous single phase, was established based on the quantitatively characterized three-dimensional (3D) microstructure. The microstructure was then assessed as one of the mechanical performance indicators [[16], [17], [18]].
Nevertheless, in-depth analysis of the microstructural softening occurring in ASBs is almost impossible if based on the aforementioned homogeneous phase microstructure, because the α and β phases are composed of grains with different orientations. In 1982, the crystal plastic finite element method (CPFEM), which combines the crystal plasticity theory and the finite element simulation method, was first proposed by Pierce [19]. The effect of different factors such as the crystal type, grain orientation, plastic slip mechanism, and hardening effect was taken into account in subsequent research. Wang et al. [20] simulated the microstructure and grain orientation evolution in α-phase titanium samples subjected to uniaxial dynamic compression based on CPFEM, and a 50-μm-wide ASB was modeled at a strain rate of 1500 s-1. In their study, the formation and extension of the band were attributed to the interaction between shear stress and the adiabatic temperature rise. Suo et al. [21] established a dynamic thermo-mechanical coupling single-phase model of crystal plasticity. The effects of different initial textures on the formation of ASB under the conditions of uniaxial compression and simple shear were investigated, and the grain-scale formation of ASBs was successfully simulated. However, in contrast to the macro samples, the stress conditions in the local micro region are usually rather complex, especially in an ASB, which is dominated by shear stress combined with other stress states. Quantitative analysis of microstructural softening and thermal softening in ASB is quite challenging, especially when α/β multiphase and multi-grain microstructure models are employed.
Ti20C, a new type of titanium alloy developed by Beijing Institute Technology, consists of 1-3 μm equiaxed α grains uniformly distributed in β matrix. This distribution contributes to the good combination of strength and plasticity, with a tensile strength of 1200 MPa and an elongation of 15 %. So it is necessary to study the relationships between the properties of Ti20C and its microstructure. In this work, a 3D multi-grain dual-phase Ti20C model is built based on a realistic microstructure. The microscopic evolutions under complex loading conditions are studied through a multi-scale CPFEM simulation proposed by our group. By virtually tracking the stress state, grain rotation, and temperature rise in the interior of ASBs, the effects of microstructural softening and thermal softening during the adiabatic shearing process are quantitatively compared and analyzed. This analysis is helpful for further understanding of the ASB formation mechanism.
2. Material and experimental procedures
2.1. Ti20C sample preparation and dynamic compression testing
The chemical composition (wt.%) of Ti20C is shown in Table 1. Ti20C is prepared by means of vacuum arc furnace melting. Fig. 1 shows an SEM image of the microstructure comprising the material after forging and isothermal annealing at 740 °C for 5 h. In the microstructure, equiaxed α grains (diameter: ∼3 μm) are homogeneously dispersed in the β matrix.
Fig. 1.
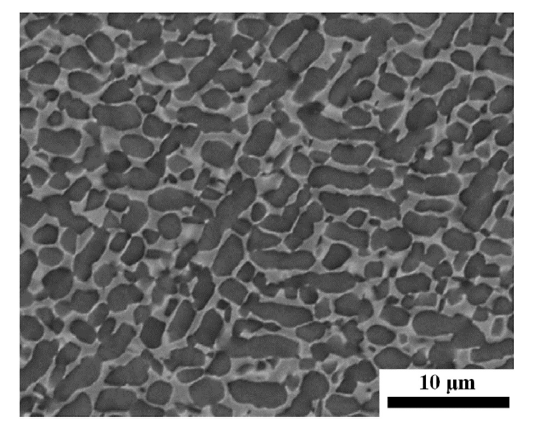
Fig. 1.
SEM image of Ti20C after heat treatment.
A Φ5 mm × 5 mm Ti20C specimen was subjected to dynamic compression at 298 K and 3000 s-1 during a SHPB test. The critical state of adiabatic shearing was obtained by limiting the specimen deformation with a stop ring [22]. Cross-sections of specimen containing ASBs were prepared by means of wire cutting. For subsequent characterization of the specimens, the surface residual stress of each specimen was eliminated via mechanical and electrolytic polishing. A Helios NanoLab 600i FIB/SEM dual beam system was used to obtain a 5000 nm × 4000 nm × 80 nm slice perpendicular to the ASB via cutting and lifting-out with a focused Ga+ ion beam (voltage: 30 kV). A Pt layer (thickness: ∼0.1 μm) was deposited as a protection layer of the specimen. The sampling position is shown in Fig. 2.
Fig. 2.
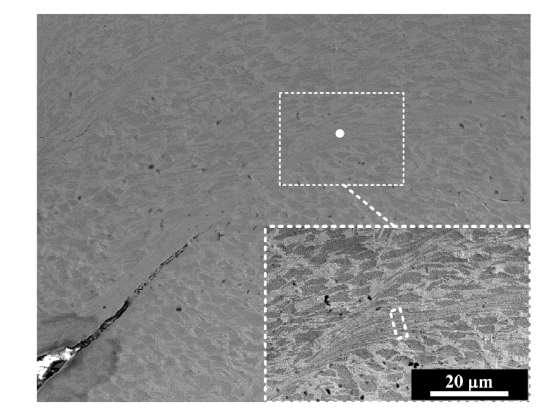
Fig. 2.
Microstructure of the ASB and high-magnification view of the sampling position.
2.2. Orientation characterization of the ASB
TEM images of the slice specimen inside the ASB were obtained using a FEI Tecnai G2 F20 transmission electron microscope (accelerating voltage: 200 kV). As electron backscatter diffraction (EBSD) is inadequate for investigating the small-scale deformation of grains, especially for heavily deformed materials, precession electron diffraction (PED) analysis was performed with a very high resolution (≤10 nm) by a NanoMEGAS SPINNING STAR system in the current study. A converged beam (diameter: ∼1 nm) was precessed about the optic axis at an angle of 0.65°, and with a step size of 7.8 nm. The PED pattern and nanoscale crystal orientation can be accurately obtained. Afterward, the collected data was imported into commercial software HKL CHANNEL5 (Oxford Instruments, UK) for analysis.
3. Numerical simulation methods
3.1. Constitutive parameters and finite element modeling at different scales
In order to simulate the adiabatic shear deformation process of Ti20C under dynamic compression, a Φ5 mm × 5 mm specimen is modeled using hexahedral elements. As shown in Fig. 3(a), all nodes on the bottom surface are fully constrained in the Z-axis direction, and forced displacements along this axis are applied to each node on the top surface. The displacement-time curve reveals a total displacement of 1.2 mm with a load time of 80 μs, corresponding to a strain rate of 3000 s-1 during the dynamic compression. The load curve of the forced displacements is shown in Fig. 3(b).
Fig. 3.
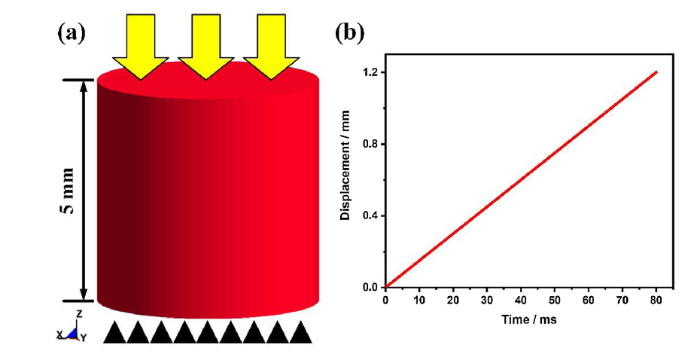
Fig. 3.
Finite element model of Ti20C: (a) schematic view; (b) load curve.
A reasonable dynamic constitutive model is necessary for the finite element simulation of metallic materials under high strain rate loadings. The Johnson-Cook constitutive model takes the effects of strain hardening, strain rate hardening, and thermal softening into account. This model can simulate the mechanical response of metallic materials exposed to high temperature and high pressure during large deformation. Therefore, this model is used to describe the material strength associated with dynamic microstructural processes in the present study. For this constitutive model, the dynamic strength may be expressed as:
where σy is the dynamic yield stress, εp is the effective plastic strain, ε* is the normalized effective strain rate, and T* is the homologous temperature ($T*=\frac{T-T_{ r } }{ Tm-T_{ r } }$, T, Tr, and Tm refer to the current temperature, room temperature, and melting temperature, respectively). In addition, parameters A, B, C, n, and m are the static yield stress, hardening parameter, strain rate parameter, hardening index, and temperature index, respectively. The *MAT_JOHNSON_COOK constitutive model in the LS-DYNA software is employed for Ti20C (the specific parameters are shown in Table 2). E, v, ρ, and ε0 listed in the table refer to the Young's modulus, Poisson's ratio, density, and reference strain rate, respectively, and D1-D5 are the failure parameters.
Table 2 Constitutive model parameters of Ti20C.
| E (GPa) | v | A (MPa) | B (MPa) | C | n | m |
|---|---|---|---|---|---|---|
| 113.74 | 0.323 | 1175 | 251 | 0.016 | 0.229 | 0.422 |
| P (kg/m3) | ε0 (s-1) | D1 | D2 | D3 | D4 | D5 |
| 4.67 | 103 | 0 | 0.33 | 0.48 | 0.004 | 3.9 |
The evolution of micro-scale α and β grains in Ti20C during dynamic compression is investigated in this work. However, the real loading conditions of the micro region, which is rather complex during deformation, is inaccurately reflected if the load is simplified to uniaxial tension/compression. Furthermore, due to the large number of elements (>108), the calculation will be very time-consuming if the entire macro model is meshed with micro-scale elements (∼10 μm). The calculations may be performed, however, by embedding the micro grain model directly into the macro model. However, significant differences between element sizes in the transition region, lead to serious problems in mesh matching (e.g., severe mesh distortion or complex sound speed). Another problem is that the minimum time step is closely correlated with the minimum mesh size and, hence, the solution time will be excessively long and, in turn, impractical in general cases. Therefore, a multi-scale modeling method that accurately reflects the dynamic mechanical response of the micro model is required. To this end, a multi-scale CPFEM method is proposed for extracting load information from the macro model, and then progressively applying this information to the micro grain models.
The process of this method and the micro grain model are shown in Fig. 4. Firstly, a 500 μm × 500 μm × 500 μm micro region of interest is selected from the interior of the ASB, and a set of the micro region boundaries is established in LS-DYNA. A macro simulation is performed and the interface file, which contains the load information of these boundaries, is exported through the keyword *INTERFACE_COMPONENT_SEGMENT. Secondly, a model with the same size as the micro region of interest, and a finer mesh method (than previously employed) is established. The boundaries in the micro model are correlated with the corresponding boundaries in the interface file through the keyword *INTERFACE_LINKING_SEGMENT, and then the 500 μm-sized micro model is simulated. According to the method mentioned above, the load was extracted from 500 μm to 50 μm, and then to 6 μm; thus, the load information of micro region can be obtained. The load is then applied to a 6 μm × 6 μm × 6 μm dual-phase micro grain model of Ti20C, which is established via 3D EBSD measurements based on our previous work [23]. The region near the edge of Ti20C sample was selected as the observation area, and SEM and EBSD measurements were performed after the edge of the sample was bombarded uniformly with focused ion beam. This process was repeated until the characterization for each layer is completed. After threshold segmentation and 3D reconstruction of these photos, a 3D grain structure with its initial orientation is established. The software TSL/OIM Analysis v5.4 was used for preliminary processing such as noise removal and normalization. Then, the 3D morphology and orientation distribution of the grain microstructure was reconstructed by the software HKL 3D Viewer, and the interface with the misorientation angle greater than 15° was considered as the grain boundary to segment the model. This model is divided into nine α phase grains and four β phase grains with different grain orientations, and is meshed into hexahedral elements (size: ∼200 nm). Elements inside a grain boundary are considered to belong to a same grain, and the initial orientation of each grain is set according to the orientation of its centroid from the 3D EBSD characterization. And single-phase constitutive parameters, such as the elastic coefficient matrix and critical shear stress of each slip system, are obtained based on our previous methods [24]. The relationship between the applied stress and the lattice strain along the tensile direction can be measured by high-energy synchrotron radiation XRD. The elastic constant Cij of single grain can be calculated by fitting the data during elastic stage, and the critical resolved shear stress (CRSS) and hardening parameters of each slip system can be obtained based on the initial yield stress of each crystal plane. An anisotropic linear elastic constitutive model (*MAT_ANISOTROPIC_ELASTIC) in LS-DYNA is used in this simulation (see Table 3, Table 4 for the constitutive parameters). Based on the grain orientation information, these parameters can be obtained through coordinate system transformation of the elastic coefficient matrix.
Fig. 4.
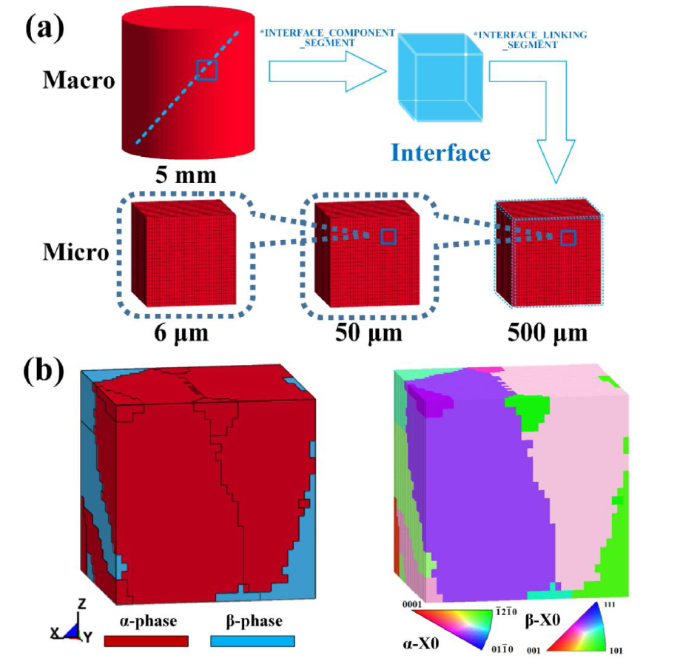
Fig. 4.
(a) Process of extracting load information from the macro to the micro model and (b) phase distribution and grain orientation distribution based on the grain microstructure.
Table 3 Crystal plastic constitutive parameters of the Ti20C α phase.
| Density (g/cm3) | Poisson’s ratio | C11 (GPa) | C12 (GPa) | C13 (GPa) | C33 (GPa) | C44 (GPa) |
|---|---|---|---|---|---|---|
| 4.4 | 0.3 | 160 | 86 | 55 | 183 | 54 |
| Slip system | CRSS (GPa) | τ1 (GPa) | θ0 (GPa) | θ1 (GPa) | ||
| <110> {0001} | 0.36 | 0.13 | 0.115 | 0.0021 | ||
| <110> {100} | 0.38 | |||||
| <110> {101} | 0.5 | |||||
| <113> {101} | 0.52 | |||||
Table 4 Crystal plastic constitutive parameters of the Ti20C β phase.
| Density (g/cm3) | Poisson’s ratio | C11 (GPa) | C12 (GPa) | C13 (GPa) | C33 (GPa) | C44 (GPa) |
|---|---|---|---|---|---|---|
| 4.8 | 0.3 | 130.2 | 70.6 | 70.6 | 130.2 | 45.8 |
| Slip system | CRSS (GPa) | τ1 (GPa) | θ0 (GPa) | θ1 (GPa) | ||
| <111> {110} | 0.45 | 0.13 | 0.105 | 0.0016 | ||
| <111> {112} | 0.46 | |||||
| <111> {123} | 0.47 | |||||
3.2. Simulation steps of CPFEM
In this work, the dynamic compression process is divided into 480 sub-steps, and a stepwise CPFEM method for large deformation is proposed. The main simulation steps are summarized as follows:
(1) A parameter file containing the typical slip systems, elastic coefficient matrix, CRSS, hardening index, Euler angle information (φ1, Φ, φ2), and stress-strain state are read into the system. The constitutive parameters in the sample coordinate system can be calculated through the coordinate transformation matrix R. The relationship between the matrix R and the Euler angles is shown in Eq. (2) [25]:
(2) The interface file that matches the micro-scale model is read as the load condition, and the dynamic compression process can be simulated in a stepwise manner. Afterward, the mechanical response of the model and changes in the stress and strain of each element in this sub-step can be obtained. The evolution of grain orientation can then be simulated through increments in the strain and Euler angles.
(3) The total stress Σσcij can be obtained from the sum of stress increments. In addition, the stress component of each slip system is calculated from τRSS=σij·cosφ1·cosφ2, where φ1 is the angle between Σσcij and the vector normal to the slip plane, and φ2 is the angle between Σσcij and the slip direction. The CRSS (τ0) of the slip system is used as a criterion for determining whether the slip system is activated. A τRSS>τ0 indicates that slip systems are activated and plastic deformation occurs.
(4) After the coordinate system transformation, the material constitutive parameters are updated and imported into the finite element model for the subsequent sub-step. These calculations are repeated until the dynamic compression process is completed. The stress-strain states of each element in each sub-step can be summarized, and the mechanical response and orientation evolution of the employed micro region during the entire deformation process is then simulated.
3.3. Thermal softening in crystal plasticity model
The general consensus is that 90 % of the plastic deformation work is converted to heat during plastic deformation [26], leading to the temperature rise. In this work, Ti20C exhibits high adiabatic shear sensitivity with low thermal conductivity, leading to insufficient time for heat transfer, owing to the short deformation time under high strain rate compression. This results in a local temperature rise and thermal softening inside the material. Therefore, the thermal softening effect should be considered in the constitutive model. The *MAT_ANISOTROPIC_ELASTIC model contains no temperature-related terms (see Eq. (1)), and hence, the constitutive model is modified by referencing the *MAT_JOHNSON_COOK constitutive model:
where σM is the stress calculated from the *MAT_ANISOTROPIC_ELASTIC model, and σc is the corrected stress. The room temperature Tr is 25 °C, the melting temperature Tm is 1663 °C, and m (a material constant) is 0.7. The adiabatic temperature rise caused by the deformation work transformation is given as follows:
where ρ, C, and η are the density, specific heat capacity, and coefficient of thermal conversion efficiency (in this case, 4.67 g/cm3, 0.51 J/(g K), and 0.9), respectively.
4. Results and discussion
4.1. Stress-strain curve of macro specimen
By applying dynamic compression, the true stress-true strain curve of a cylindrical specimen is simulated and compared with the experimental results obtained at a strain rate of 3000 s-1, as shown in Fig. 5. The horizontal axis macroscopic true strain (εT) refers to the true strain of the entire macroscopic specimen. As shown in the figure, the simulated stresses are consistent with the experimental results, thereby verifying the reliability of the macroscopic simulation. The entire loading process can be divided into four stages based on the trend of the true stress: (I) elastic stage (εT <0.02), (II) elastoplastic transformation stage (0.02 ≤εT <0.04), (III) plastic stage (0.04 ≤εT <0.20), and (IV) adiabatic shear instability stage (εT ≥ 0.20).
Fig. 5.
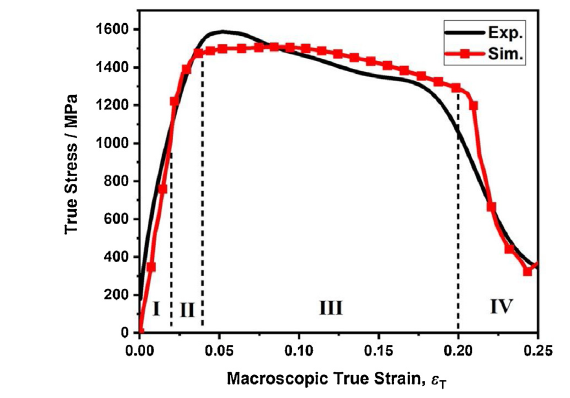
Fig. 5.
True stress-true strain curve of the macro samples under dynamic compression.
4.2. Simulation of the mechanical response during the early softening stage
The temperature rise and plastic deformation are extremely small during the initial stage of dynamic compression, and hence, the softening effect (which affects the mechanical performance of Ti20C) is negligible. Therefore, Stages I and II as well as the first half of Stage III can be considered the early softening stage. In Stage I, the stress on each grain is only correlated with the elastic modulus of the grain, and increases continuously with the deformation. The subsequent deformation of dual-phase multiple grains is relatively complex in Stage II. The mechanical conditions are described in detail via effective plastic strain and effective stress contour maps of the Ti20C microstructure model (see Fig. 6) at εT values of 0.02, 0.025, 0.04, and 0.10. When εT = 0.02 (Fig. 6(a) and (b)), the effective stress in the α grains reaches 1066 MPa, which is greater than that (878 MPa) of the β grains. A small plastic strain (0.0 %-0.3 %) occurs in the α phase (Fig. 6(b)). This indicates that some α grains enter the plastic stage at the end of Stage I, while β grains are still undergoing elastic deformation (plastic strain is zero). When εT = 0.025 (Fig. 6(c) and (d)), the α grains have entered the plastic stage. The corresponding stresses are released during plastic deformation, while the β grains are still in the elastic stage, and are characterized by effective stresses that increase linearly. Therefore in Stage II, the internal stress of the α phase is gradually transferred to the β phase, and the effective stress in both phases is ∼1050 MPa. When εT reaches 0.04 (Fig. 6(e) and (f)), plastic deformation also occurs in the β phase, and the effective stress is mainly concentrated in this phase (peak value: 1651 MPa). The average effective stress in the α phase is 1115 MPa. Subsequently, at εT = 0.10 (Fig. 6(g) and (h)), the effective plastic strains of both phases increase continuously. Moreover, the effective stresses decrease to ∼1100 MPa and negligible difference between the two phases (which are affected by different softening mechanisms) is observed. The softening effect will be considered further in a subsequent section.
Fig. 6.
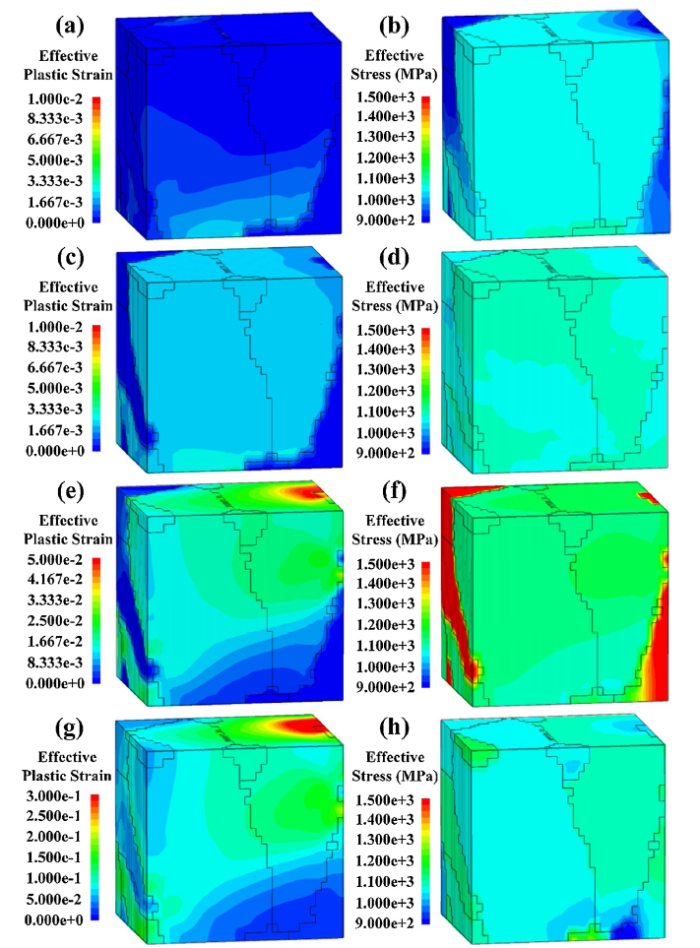
Fig. 6.
Effective plastic strain and effective stress contour maps of the dual-phase multiple grains: (a, c, e, g) effective plastic strain and (b, d, f, h) effective stress at εT = 0.02, 0.025, 0.04, and 0.10, respectively.
4.3. Micro-scale mechanism of material softening and instability
4.3.1. Microstructural characterizationof the ASB
The microstructure inside the ASB is characterized by means of TEM (see Fig. 7(a) for the obtained image). Micro regions consisting of multi-phase and multi-grain regions with large residual stresses occur in the ASB. Details of the grain orientation and grain boundary are captured accurately by means of PED (the measured grain orientation distribution is shown in Fig. 7(b)). Using the software Image-Pro Plus V6.0 reveals that the shapes of grains inside the ASB can be divided in two types: Type 1: elongated large grains with length of ∼4 μm (i.e., 2-5 times the grain width) along the ASB direction. The intragranular orientations are basically the same; Type 2: small equiaxed grains (diameter: 500 nm). Furthermore, the selected area electron diffraction rings in the inset of Fig. 7(a) confirm that the region inside the ASB is composed of many nanocrystals with different orientations.
Fig. 7.
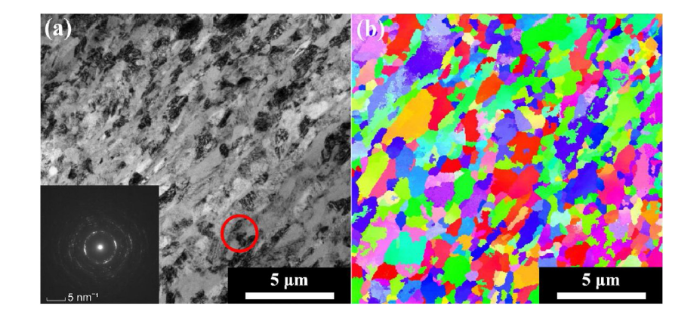
Fig. 7.
Microstructure inside the ASB of TI20C: (a) TEM image and diffraction pattern; (b) grain orientation distribution captured by means of PED.
4.3.2. CPFEM simulation of micro model with adiabatic shear deformation
The grain rotation and recrystallization in the ASB, as well as the plastic deformation and softening mechanism of the grains are analyzed via CPFE simulation. In the simulation, the large plastic deformation of the micro multiple-grain model under dynamic compression is reproduced. As shown in Fig. 8(a), two α-phase grains (Gα1, Gα2) and a β-phase grain (Gβ1) are chosen as research objects. The elements at the centroids of the grains are referred to as Eα1, Eα2, and Eβ1, respectively. The effective stress history of the centroid element is extracted (see Fig. 8(b)). As shown in the figure, these elements all undergo yielding, and the effective stress decreases with continued deformation, indicating that stress softening has occurred in these elements during the plastic deformation process. The softening effect is strong in Eα1 and relatively weak in Eα2 and Eβ1. When εT = 0.198, the stress associated with Eα1 decreases to 472 MPa, i.e., 33.5 % of the peak value (1407 MPa). However, the stress associated with Eα2 and Eβ1 (1045 MPa) corresponds to 71.6 % and 66.0 % of the respective peak stresses.
Fig. 8.
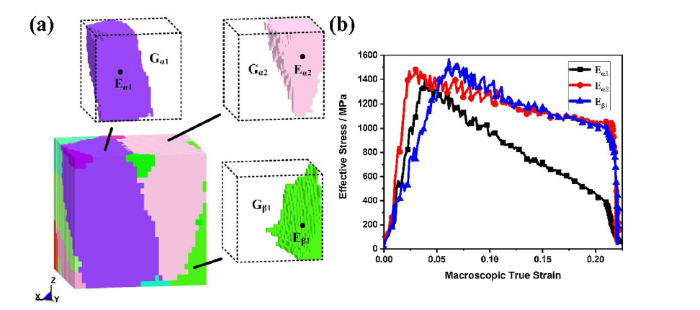
Fig. 8.
Simulation results of the micro model: (a) schematic showing the positions of grains Gα1, Gα2, Gβ1, and the centroid elements Eα1, Eα2, Eβ1; (b) effective stress history of the centroid elements.
The basis for the considerable differences in the softening effects of these elements is determined by extracting the effective plastic strain and temperature rise of the three centroid elements from the simulated results. As shown in Fig. 9(a), during the plastic deformation process, the increase in plastic strain differs significantly among the elements. For example, when εT = 0.2, the effective plastic strain of element Eα1 increases to a maximum of 2.02, and the local plastic strains of Eα2 and Eβ1 (0.38 and 0.84, respectively) are relatively low. The plastic strain of all three elements increases significantly when the adiabatic shear instability (or stress collapse) stage begins, i.e., at εT > 0.21. The temperature rise caused by the accumulated plastic deformation work of each element is shown in Fig. 9(b). These results reveal that, with continued compression, the effective plastic strain of element Eα1 is higher than that of the other two elements, and hence, the temperature rise is most rapid in this element. With continuous loading, the temperature of Eα1 reaches 950 °C when εT = 0.20. The temperature rise of Eα2 and Eβ1 is relatively slow, with temperatures of 269 °C and 430 °C, respectively, reached in these cases. At εT > 0.21, the temperature of the three elements in the shear zone rises rapidly to 1200-1600 °C, which is close to the melting point of Ti20C. Therefore, the stress of each element decreases quickly due to the effect of thermal softening, which may eventually lead to adiabatic shear failure.
Fig. 9.
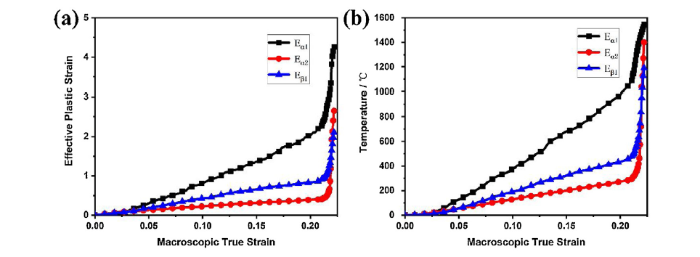
Fig. 9.
(a) Effective plastic-strain history and (b) temperature-rise history of centroid elements.
The rapid softening of Eα1 is further analyzed by evaluating the grain rotation process and the surrounding elements, as well as the recrystallization softening mechanism of Gα1, Gα2, and Gβ1. Fig. 10 shows the grain orientation distribution (as an IPF map [27]) and the histogram of the rotation angle distribution obtained for typical elements subjected to macroscopic strain εT of 0.15, 0.21, 0.214, 0.218, and 0.222. As shown in Fig. 10(a), compared with the initial grain orientation distribution (see Fig. 2), the lattice in Gα1 starts to rotate to different orientations when εT = 0.15. The numbers of elements that rotate 5°-10° and >10° account for 29.2 % and 6.7 %, respectively, of the total number of elements in Gα1. Simultaneously, most elements of the other two grains undergo a rotation of <5° (Fig. 10(b)), indicating that the orientation remains approximately the same. Fig. 10(c) shows the orientation distribution of the model corresponding to continued macroscale plastic deformation. Large plastic deformation will begin when εT = 0.21, and the number of elements with a rotation angle of >5° in the Gα1 increases to 52.1 % (Fig. 10(d)). Subsequently, the rotation in each grain becomes considerable. The orientation distribution in Fig. 10(e) shows that when εT = 0.214 grain Gα1 splits into many small grains with different orientations, and the distribution of the rotation angles in Gα1 is relatively discrete. The discrete distribution of the rotation angle in Gα1 (see Fig. 10(f)) indicates that 75.2 % of the elements is characterized by a rotation angle of >5°, illustrating the independence of the element rotation. Similarly, the fractions of elements with a rotation angle of >5° in Gα2 and Gβ1 increase to 8.9 % and 17.7 %, respectively, and the grain rotations are more apparent than previous rotations. When εT = 0.218, the model undergoes further shear deformation, and (as previously stated) Gα1 has split into many small grains with different orientations, as shown in Fig. 10(g). Gα2 and Gβ1 undergo no splitting, however, due to the relatively limited grain rotation. Specifically, elements with a rotation angle of >5° in Gα1 account for 88.2 % of the total number of elements comprising the grain. The rotation angle becomes more discrete in the range of 0°-45° (than in other angle ranges), and the elements with a rotation angle of 10°-20° account for 36.2 % of the total Gα1 elements. As the material approaches failure at εT = 0.222 (see Fig. 10(i)), Gα1 is still composed of small grains with different orientations, Gα2 is elongated and remains almost intact, and sustained grain refinement occurs in Gβ1. Calculations reveal that after large plastic deformation (Fig. 10(j)) the fractions of elements with rotation angles of 10°-20° increase from 4.5 % to 56.1 % and from 11.8 % to 52.5 % in Gα2 and Gβ1, respectively. This indicates that both grains have undergone significant rotation, with the rotation angle distribution range expanding from 0°-25° to 0°-45°, and therefore, becoming more discrete than the initial distribution. Similarly, the number of elements with a rotation angle of >5° constitutes 96.1 % of the total number of elements in Gα1, and this value represents a smaller increase than that occurring at small deformations. The elements with a rotation angle of 10°-20° account for 36.7 % of the total number of elements, and the distribution range (0°-55°) is similar to the previously obtained range. This indicates that after undergoing sufficient severe plastic deformation of the material, recrystallization occurs to a lesser extent in Gα1 than in the previous stage. The final simulation results show that the grains with the same orientation after stretching are ∼3.5 μm in length. These grains are surrounded by small grains (diameter: ∼400 nm) and different orientations, which are generated by severe shear deformation. The simulated microstructure and orientation are consistent with the experimental results shown in Fig. 7(b), thereby confirming the reliability of the simulation method. Analysis of the simulated grain-rotation history reveals that during the entire deformation process, different grains have different rotation histories, which are usually difficult to ascertain through traditional experimental methods.
Fig. 10.
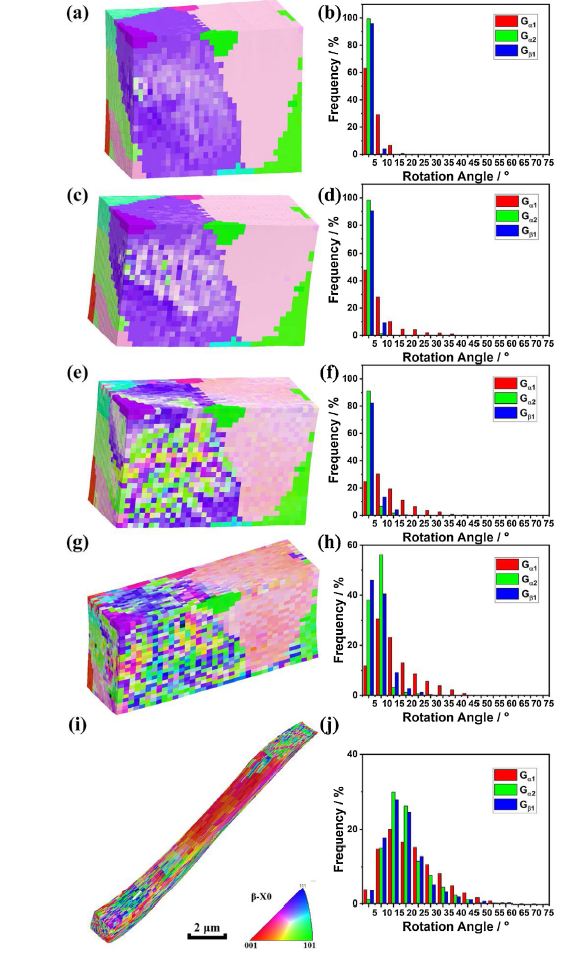
Fig. 10.
Orientation evolution of the three grains during the late stages of deformation: orientation distribution (a, c, e, g, i) and rotation angle distribution (b, d, f, h, j) at εT = 0.15, 0.21, 0.214, 0.218, and 0.222, respectively.
4.4. Analysis of the softening mechanism
The most intense softening of Eα1 occurs in the center elements of the ASB (see Fig. 8(b)). Therefore, the softening process and internal mechanism of Eα1 during the adiabatic shear failure process is investigated. The micro-scale dynamic mechanical response inside the ASBs is analyzed by decoupling the microstructural softening and thermal softening components of the stress. For this decoupling, the stress value σO, which occurs under ideal conditions without softening, is obtained by means of simulation. This value is then combined with the current effective stress value σE and the stress softening of each element can be obtained from σS=σO-σE. Based on the thermal softening coefficient fT (Eq. (3)) established in Section 3.3, the thermal softening value σT can be calculated. Furthermore, the stress reduction induced by the microstructural softening can be calculated as follows: σM=σS-σT=σO-σE-σO*fT. The stress softening of the element Eα1 is decoupled and plotted (see Fig. 11) for studying the role of these two softening mechanisms (i.e., microstructural softening and thermal softening) in the adiabatic shear failure process.
Fig. 11.
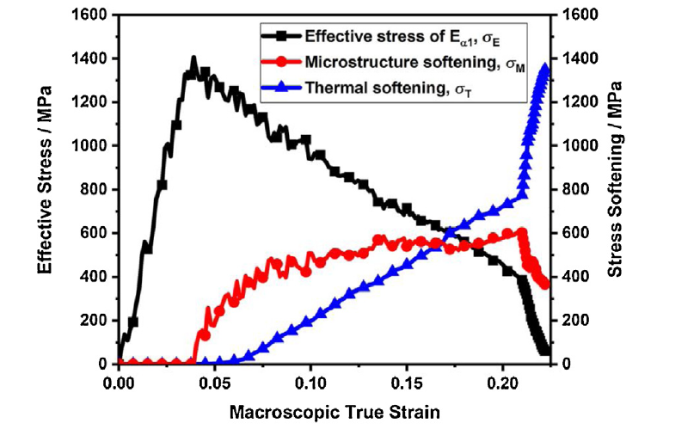
Fig. 11.
Effective stress and stress softening history of Eα1 during deformation.
The effective stress curve of Eα1 indicates that the stage encompassing elastic deformation and strain strengthening occurs in the model when εT = 0-0.04. In this stage, the effective stress rises rapidly, and microstructural softening and thermal softening are both negligible. Gradual rotation of the local lattice inside the grain begins with plastic strain accumulation in Eα1 after εT reaches 0.04, and the microstructural softening effect occurs. The temperature rise at the initial stage of deformation is almost zero, and hence, the thermal softening effect is negligible. Therefore, during this time, the effective stress softening is mainly affected by the microstructural softening effect. A comparison of the stress reduction caused by different softening mechanisms reveals that the microstructural softening starts at εT = 0.04, while the thermal softening starts at εT = 0.058. When εT = 0.04-0.07, the microstructural softening increases significantly with the lattice rotation caused by the relatively high effective plastic strain in Eα1 and the softening stress increases to 507 MPa. During the dynamic compression process, interactions and deformations occur between the elements, leading to a continuous fluctuation of the effective stress in Eα1. The deformation work transforms continuously into internal energy, and the consequent increase in the element temperature of the grain leads to a significant temperature softening effect. In the subsequent uniform plastic deformation (εT = 0.058-0.21) process, the softening stress affected by thermal softening increases almost linearly. The corresponding stress reduction caused by microstructural softening is relatively stable at 550 MPa for strains of εT = 0.07-0.21. This results from the fact that the effect of microstructural softening is kept at a relatively stable level by continuous grain rotation and recrystallization. Thermal softening becomes equivalent to microstructural softening when εT = 0.17. After this value is exceeded, the stress reduction caused by thermal softening exceeds microstructural softening, indicating that thermal softening becomes the main softening mechanism of the material in the late stage of plastic deformation. With continued compression, the thermal softening caused by the continuous temperature rise will accelerate the development of plastic deformation, leading to further heat generation and aggravation of the thermal softening. The temperature of the Eα1 increases by 1080 °C prior to the occurrence of ASBs (0.21< εT <0.222), and the local thermal softening effect is significantly enhanced (see Fig. 9(b)). When εT = 0.21, most regions of the grains undergo continuous rotation and the corresponding microstructural softening is quite significant. Under the effects of these mechanisms, the strength decreases significantly. Microstructural softening and thermal softening account for 43.7 % and 56.3 %, respectively, of the total stress softening. As adiabatic shear failure of the material is approached, the softening stress of Eα1 decreases rapidly from 605 MPa at εT = 0.21-366 MPa at εT = 0.222. That is, after various rotations and recrystallization of grains in the material, the effect of microstructural softening on the mechanical properties decreases considerably. This result is consistent with the apparent decrease in the recrystallization of Gα1 when failure is approached (see Fig. 10). Moreover, the plastic deformation of the entire model results mainly from the significant elongation of the grains, which leads to a rapid temperature rise and a sharp increase in thermal softening. The results show that when εT = 0.222, thermal softening leads to a stress reduction of 1350 MPa. In this case, the microstructural softening and thermal softening processes account for 21.6 % and 78.4 %, respectively, of the total stress softening. Under the combined effect of these two mechanisms, the softening effect exceeds the strain hardening and strain rate hardening effects, resulting eventually in the nucleation and growth of local ASBs.
5. Conclusion
In this work, the dual-phase multi-grain titanium alloy Ti20C is subjected to SHPB dynamic compression, and the microstructure is characterized by means of TEM and PED. Combined with experimental parameters, a multi-scale CPFEM simulation of the microstructural model under complex dynamic loads is proposed. The results revealed that the stress and strain are both initially concentrated in the α grains during the early elastic-plastic transition process. The stress is then transferred from the α phase to the β phase, because the former has a higher elastic modulus and a lower yield strength than the latter. Moreover, the severe plastic deformation and DRX inside the ASB are successfully simulated, and the results correspond closely to the grain morphology, size, and orientation investigated via TEM and PED. By virtually tracking the microstructural evolution of typical α grains, the inherent mechanism inducing stress instability and material softening during adiabatic shear behavior is revealed by decoupling the stress softening effects. The results revealed that during the early plastic deformation (εT = 0.04), microstructural softening stress is triggered and then stabilizes (in general) at a relatively high value. Subsequently, thermal softening occurs at εT = 0.058 and increases almost linearly, and at εT >0.17 exceeds the microstructural softening effect. Eventually, the thermal softening dominates the softening process due to the sharp temperature increase, thereby leading to stress collapse and potential shear failure.
Acknowledgements
This work was financially supported by the National Natural Science Foundation of China (No. 51571031). Dr. Zheng from ZKKF (Beijing) Science & Technology Co., Ltd is acknowledged for TEM and PED analysis.
Reference
DOI
URL
PMID
[Cited within: 1]

Dynamic recrystallization (DRX) is almost universally observed in the microstructure of adiabatic shear bands. It is usually admitted that DRX results from the large temperatures that develop in the band along with very high local strains. This paper reports the observation of dynamically recrystallized nanograins in Ti6Al4V alloy specimens that were impact loaded to only half the failure strain at which the adiabatic shear band develops. This observation shows that DRX not only precedes adiabatic shear failure but it is also likely to be a dominant micromechanical factor in the very generation of the band. This result means that adiabatic shear failure is not only a mechanical instability but also the outcome of strong microstructural evolutions leading to localized material softening prior to any thermal softening.
DOI
URL
PMID
[Cited within: 1]
Adiabatic shear banding (ASB) is a unique dynamic failure mechanism that results in an unpredicted catastrophic failure due to a concentrated shear deformation mode. It is universally considered as a material or structural instability and as such, ASB is hardly controllable or predictable to some extent. ASB is modeled on the premise of stability analyses. The leading paradigm is that a competition between strain (rate) hardening and thermal softening determines the onset of the failure. It was recently shown that microstructural softening transformations, such as dynamic recrystallization, are responsible for adiabatic shear failure. These are dictated by the stored energy of cold work, so that energy considerations can be used to macroscopically model the failure mechanism. The initial mechanisms that lead to final failure are still unknown, as well as the ASB formation mechanism(s). Most of all - is ASB an abrupt instability or rather a gradual transition as would be dictated by microstructural evolutions? This paper reports thorough microstructural characterizations that clearly show the gradual character of the phenomenon, best described as a nucleation and growth failure mechanism, and not as an abrupt instability as previously thought. These observations are coupled to a simple numerical model that illustrates them.
AbstractTo study the high strain rate shear behaviour of Ti–6Al–4V, hat-shaped specimens have been used in a compression split Hopkinson bar set-up. With this technique, highly concentrated shear strains are obtained which eventually cause strain localization and adiabatic shear bands (ASB). Because of the complex stress distribution in the specimen, interpretation of the experimental results is not straightforward. In this paper, results of a comprehensive experimental and numerical study are presented, aiming at a more judicious use of hat-shaped specimens and a fundamental understanding of the obtained results. Specimens with different dimensions are considered. It is found that the width of the shear region and the radius of the corners are the most important parameters. The first mainly affects the homogeneity of stresses and deformations in the shear zone and the presence of a hydrostatic stress next to the shear stress, while the latter primarily governs the initiation of the ASB. The relation between the global measured response and the local material behaviour is studied. It is shown that, within certain limits, the shear stress in the shear region can be extracted from the measured force. Several experiments which have been interrupted at a certain level of deformation have been carried out. The microstructure could thus be observed at different stages: onset of strain localization, formation of ASBs, initiation and propagation of micro-cracks.]]>

 WeChat