

1. Introduction
The corrosion and wear severely shorten the durability and reliability of metal materials, which causes huge economic loss and wasting of resources [1,2]. Organic coatings are widely used to protect the materials and equipments because of facile, low-cost and energy-saving advantage [3,4]. They can provide a physical barrier against external force or corrosive medium. Nowadays, the waterborne epoxy coating has become a hot research point due to low volatile organic compound and environmental friendliness. However, inherent brittleness and micro-pore of epoxy coatings lead to poor anticorrosion and anti-wear performance [5,6]. Fortunately, numerous references have reported the incorporation of two-dimension corrosion inhibitors or fillers into the epoxy coatings for improving the corrosion resistance and tribological property via increasing the corrosive ions pathway length and mechanical property [[7], [8], [9], [10], [11], [12]]. For example, Ye et al. reported that the addition of polyhedral oligomeric silsesquioxane functionalized graphene oxide with 0.5 wt.% into epoxy matrix could remain the best shielding ability in corrosive solution within 150 days, and significantly reduce wear rate compared to the pure epoxy coating [7]. Liu et al. observed that graphene oxide modified with ionic liquid can improve dispersibility in solvents and polymer matrix [8]. The well-dispersed graphene enhanced the integrity of waterborne epoxy coating and the impedance modulus was about 108 Ω cm2 during the immersion of 55 days. Cui et al. provided a facile strategy for synthesizing homogeneous dispersion of hexagonal boron nitride (h-BN) in epoxy matrix via carboxylated aniline trimer derivative as a dispersant, and found that only incorporation of 1 wt.% h-BN nanosheets can impede the diffusion of electrolyte [9]. Luo et al. evaluated the anticorrosion behavior of cationic reduced graphene oxide (RGO-ID+) [10]. Owing to the high surface area of as-prepared RGO-ID+, the composite coating exhibited the superior corrosion protection property. Corrosive species in saline environment, including H2O, O2 and Cl-, continuously attack the coating protection system, while these 2D fillers as shield can extend the diffusion path of ions. Nevertheless, these traditional 2D materials are chemical inertness and high cost (complex preparation and low yield), and their poor interaction with other materials cannot be answerable for high-performance anti-corrosive/wear coating.
A novel 2D material, so-called MXene, has received ever-increasing attention in broad range of application including hydrogen storage [13,14], water treatment [15], supercapacitors [16,17], batteries and catalysis [[18], [19], [20], [21]], since being discovered in 2011. Ti3C2 as a representative MXene phase with the laminated structure has good chemical stability and high mechanical properties (e.g., the out-of-plane Young’s modulus of single-layer Ti3C2 is higher than graphene) [[22], [23], [24], [25]]. Usually, hexagonal Ti3C2 MXene phase (P63/mmc) could be obtained from Ti3AlC2 MAX phase precursor, in which Al atom layers exist between stacked Ti3C2 layers. Thus, Ti-C bonds featuring metallic, covalent and ionic bonding are stronger than Ti-Al metallic bonds, leading to easily selective extraction of Al layer from Ti3AlC2 MAX. Hydrofluoric acid is commonly used as an etching agent, and then the surface of Ti3C2 generates active groups/elements like O, OH and F. These active terminals provide the possibility of further surface modification. Where after, the intercalation and delamination technology should be implemented via dimethyl sulfoxide (DMSO) and external shearing force.
The unique characteristics of Ti3C2Tx (T=O, OH and F; x is the number of terminal groups per unit) allow it to be added into polymer matrix for different applications [[26], [27], [28], [29]]. But the reports on the corrosion protection and tribology of Ti3C2Tx are rare. Moreover, good dispersity and chemical compatibility of Ti3C2Tx in epoxy coating are crucial to achieve the well protective effect [30,31]. Besides, adhesion strength of composite coatings on metal surface needs to be considered. Covalent functionalization of inorganic fillers is available for excellent interface interaction between additives and organic coating, while amino-functionalization is an effective approach. Parhizkar et al. used 3-aminopropyltriethoxysilane to covalently bond the graphene oxide [32]. The results showed the -NH2 groups can be bonded with -OH groups on the metal surface, which improves the adhesion property. Mo et al. investigated the tribological and anticorrosion properties of polyurethane coating with amino-graphene oxide, and confirmed the functional graphene with good dispersion and compatibility in PU coating [33]. Ramezanzadeh et al. developed hybrid nanocomposite coating system that combined the diamine-functionalized graphene oxide with epoxy coating, in which good covalent bonding was detected between graphene and epoxy resin [34]. Ti3C2Tx could well disperse in water, but it is inclined to precipitate in polymer slurry. Hypothetically, functional terminal of amino groups grafted on Ti3C2Tx can produce the interaction between amino (in functionalized Ti3C2Tx) and epoxy group (in epoxy resin) [35]. This effect could effectively promote the uniform distribution of the inorganic filler in the epoxy resin and the high compactness of composite. On the other hand, the amino groups serve as a ‘bridge’ in composite coating to link the coating and metal substrate for fine adhesion strength.
To confirm the above hypothesis and achieve high-performance corrosion/wear resistance of epoxy coating, few-layered Ti3C2Tx MXene sheets were obtained by etching Ti3AlC2 MAX with HF, and then intercalation/delamination technology via DMSO with ultrasonic treatment. The as-prepared Ti3C2Tx sheets were treated with 3-aminopropyl triethoxysilane to achieve amino-functionalization as shown in Fig. 1. Amino-functionalization of Ti3C2Tx is proposed by this work due to wonderful effect, easy achievement and simple conduct. The waterborne epoxy composites coatings were fabricated by the addition of amino-functionalized Ti3C2Tx sheets. Their anticorrosion and tribological properties were characterized in detail.
Fig. 1.
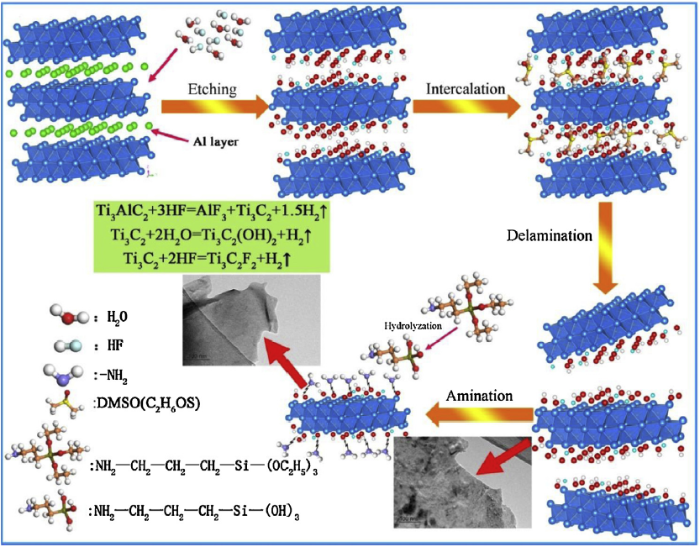
Fig. 1.
Schematic illustration of preparation of the amino functionalized Ti3C2Tx.
2. Experimental
2.1. Materials
Ti3AlC2 powder (purity of ≥98%, 200 meshes) was purchased from Ningbo Beijiaer New Material Co. Ltd. Dimethyl sulfoxide (DMSO), 40% hydrofluoric acid (HF), 3-aminopropyl triethoxysilane, acetone and ethyl alcohol absolute were purchased from Chengdu Kelong Chemical Co. Ltd. All commercial chemicals and solvents were used as received without further purification. Waterborne epoxy resin (H228A) and waterborne curing agent (H228B) were purchased from Shanghai Hanzhong Chemical Co. Ltd.
2.2. Etching and delamination of Ti3AlC2 MAX
Ti3AlC2 powders were immersed in 40% hydrofluoric acid solution at room temperature for 24 h under continually stirring. The weight ratio of Ti3AlC2 powders and 40% HF solution is 1:20. The resulting products were centrifuged at 3500 rpm for 20 min to collect precipitates. The as-prepared precipitates were washed with deionized water several times until the pH of supernatant liquid was 7. And they were freeze-dried to obtain multilayer stacked Ti3C2Tx MXene phase powders (named as m-Ti3C2). In order to intercalate DMSO molecule into the multilayer stacked Ti3C2Tx, the as-prepared m-Ti3C2 was soaked in DMSO solution (weight ratio of 1:20) under magnetic stirring at room temperature for 18 h. The intercalated Ti3C2Tx suspension was centrifuged at 3500 rpm for 20 min to remove the stacked nanosheets. Then the intercalated Ti3C2Tx slurry mixed with deionized water (a weight ratio of 1:300) and the mixture was sonicated for another 6 h for delamination. The suspension was finally freeze-dried to obtain few-layered Ti3C2Tx nanosheets (named as l-M).
2.3. Preparation of amino-functionalized Ti3C2Tx (named as f-M)
Firstly, 3-aminopropyl triethoxysilane (5 g) was added into the ethyl alcohol/deionized water (18 g/2 g) mixture and vigorously stirred. Then, precalculated l-M powders (250 mg) were immersed in the above mixed solution and were sonicated for another 1 h. After that, the mixture was poured into three-necked flask and stirred at 80 °C for 24 h under reflux condensation. The resulting products were then centrifuged using ethyl alcohol and deionized water to remove residual modifier. Finally, they were freeze-dried to obtain f-M.
2.4. Preparation of f-M/epoxy composite coatings
f-M/epoxy composite coatings were prepared as follows (shown in Fig. S1 in the Supplementary Material): (a) A given amount of f-M nanosheets were ultrasonically dispersed in 21 g deionized water for 1 h to obtained a homogeneous suspension; (b) 10 g waterborne epoxy resin was added into f-M/deionized water suspension, and then the mixture was stirred at a high speed for 30 min to achieve the uniform dispersion of f-M/epoxy; (c) 20 g waterborne curing agent was added, and was dramatically stirred under 4000 rpm for 10 min; (d) the as-prepared slurry was degassed in a vacuum oven at room temperature; (e) the mixture was painted on the pretreated 6082 aluminium alloys (15 mm × 15 mm × 3 mm) via a coater (80 μm). The coated aluminium alloys were cured under room temperature for 24 h. The additive amounts of f-M were 0.25 wt.% and 0.5 wt.% (percentage of mass of epoxy resin) and the coatings were named as f-M0.25% and f-M0.5%, respectively. Besides, pure epoxy coating and composite coating with 0.25 wt.% and 0.5 wt.% l-M were prepared using the same procedure and were named as pure EP, l-M0.25% and l-M0.5% for comparison.
2.5. Characterization
The microstructure and morphology of l-M and f-M was characterized using scanning electron microscope (SEM, JSM-6610, Japan) and transmission electron microscope (TEM, JEM-2010, Japan). The fracture surface of the coatings and substrate surface after corrosion were also observed using SEM. The phase composition of Ti3AlC2, m-Ti3C2, l-M and f-M was analyzed by X-ray diffraction (XRD, Bruker D8 ADVANCE A25X, Germany) using Cu Kα radiation at a speed of 5°/min in the scan range of 2θ = 5°-80°. The chemical structure of l-M and f-M was determined using Fourier transform infrared spectrophotometer (FTIR, Nicolet 6700, America). X-ray photoelectron spectroscopy (XPS, Escalab 250Xi, America) was carried out to analyze the chemical composition of l-M and f-M. Thermo-gravimetric analysis (TG, NETZSCH STA 449 C, Germany) was performed in N2 atmosphere with 5 °C/min heating rate from 40 to 750 °C, to evaluate the amount of amino grafted on the Ti3C2Tx surface. The storage modulus and loss factor (tan δ) of coatings were evaluated by dynamic thermomechanical analysis (DMA, Q800, America) in stretch mode over a temperature range from -40 to 160 °C at a heating rate of 3 °C/min.
2.6. Anticorrosion performance of composite coatings
The anticorrosion performance of composite coatings was studied through the electrochemical workstation (V38135, Ivium, Netherlands) in 3.5 wt.% NaCl solution. Three-electrode system was chosen to the electrochemical cell: (a) the coated 6082 aluminium alloys served as the working electrode; (b) a platinum plate served as the counter electrode; (c) a saturated calomel electrode (SCE) served as the reference electrode. Before the electrochemical impedance spectroscopy (EIS), the open circuit potential (OCP) must be at the balance state. And EIS was recorded in the frequency range of 105-10-2 Hz using an alternating current signal with the amplitude of 20 mV after 24, 48, 72, 96 h and 1, 2, 3, 4 week immersion. The EIS results were fitted with Z view software. Moreover, Tafel polarization curves were obtained under setting potential range of -250 mV to +250 mV vs. OCP at a scan rate of 0.5 mV/s after coatings were soaked in 3.5 wt.% NaCl solution for 4 weeks.
The water absorption of the composites coating was calculated by weighing the mass of the coatings. The samples were removed from 3.5 wt.% NaCl solution, quickly dried, weighed. The whole processes were taken less than 2 min. The water absorption (Wt) was then calculated according to the following equation [36]:
Where mt and m0 are the mass of composites coatings before immersion and at time t; and Wt is the water absorption (%) at time t.
The corrosion resistance of waterborne epoxy coatings with l-M and f-M was also evaluated by salt spray test according to ASTM B117-03. The measurement was carried out in salt spray chamber (HD-E808-90, China). The salt spray condition was 5% neutral NaCl fog and the temperature of chamber was 35 °C. Furthermore, the surface state of the composite coatings before and after testing of 30 days was recorded using optical camera.
2.7. Tribological performance of composite coatings
UMT-3 tribo-meter (CETR, America) with a ball-on-plate configuration under dry conditions was chosen to study the tribological performance of coatings. The tribological tests were conducted under a sliding velocity of 2 Hz, applied load of 3 N, test duration of 30 min and wear track length of 5 mm. And GCr15 steel balls of diameter 10 mm were used as the counterpart. Especially, the GCr15 steel balls were cleaned by ethyl alcohol and acetone before testing. White light interferometer (WLI) was taken to observe 2D profile and 3D morphologies of wear track. In addition, the specific wear rate Ws was calculated by the following equation [37]:
is the wear volume; F and L is the normal load and total distance, respectively.
3. Results and discussion
3.1. Characterization of amino-functionalized Ti3C2Tx
XRD patterns were shown in Fig. 2(a) to demonstrate the evolution of crystalline structures during the etching-intercalation-delamination process of Ti3AlC2 and amino-functionalized process of Ti3C2Tx. The bubbles (hydrogen gas) were produced when Ti3AlC2 powders were immersed in the 40% HF solution, implying the existence of chemical reaction. After that, most of the characteristic peaks of Ti3AlC2 within range of 34°-45° disappear. The (002) and (004) peaks of m-Ti3C2 became broadened and shifted to lower diffraction angles compared to their location before treatment, owing to successful extraction of Al layer from Ti3AlC2 [38]. Using intercalation and delamination technology, weaker (002) peak at the lower diffraction angle (2θ = 6.40°) illustrated the expanded interlamellar spacing of 1-M. But this weaker peak was transformed to higher angle (2θ = 7.82°) during the functionalized process. The interlamellar spacing of f-M sheets was shrunken to some extent, maybe due to the effect of bridging for silane molecules.
Fig. 2.
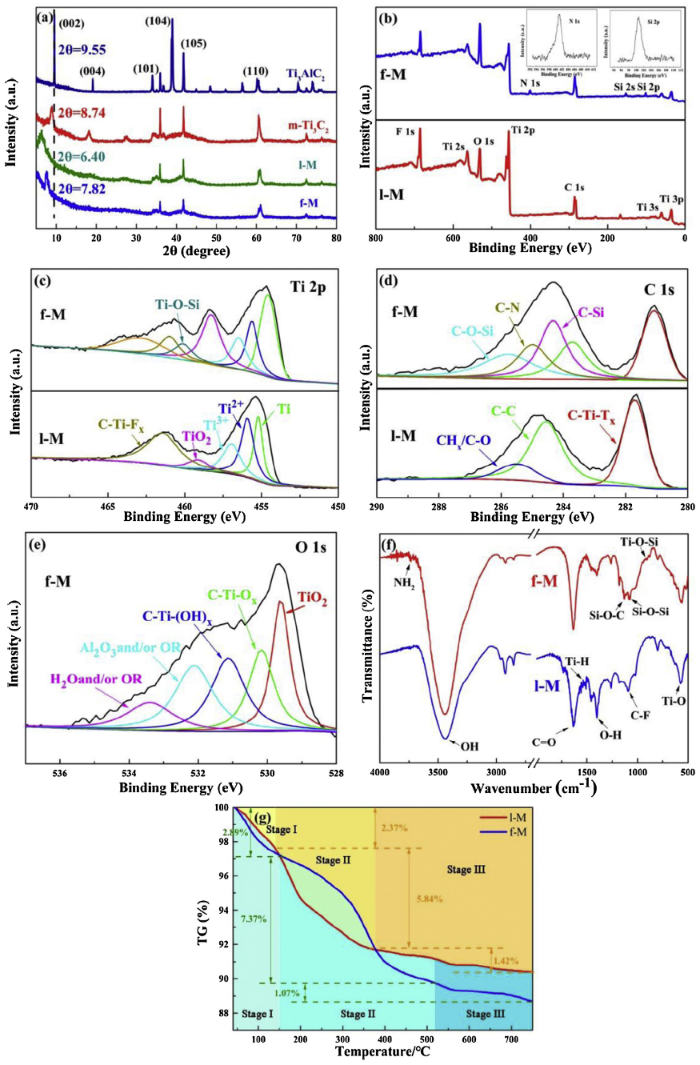
Fig. 2.
(a) XRD spectra of Ti3AlC2, m-Ti3C2, l-M and f-M; (b) survey XPS, (c) Ti 2p, (d) C 1s spectra of l-M and f-M; (e) O 1s spectrum of f-M; (f) FTIR and (g) TG spectra of l-M and f-M.
The chemical changes of Ti3C2Tx MXene sheets during the amino-functionalized process were further studied by XPS analysis. The survey spectra of 1-M and f-M were shown in Fig. 2(b), verifying the existence of Ti 2p (455.9 eV), C 1s (285.0 eV), O 1s (531.2 eV) and F 1s (684.6 eV). Especially, the N 1s (400.8 eV) and Si 2p (101.8 eV) of f-M appeared and the atom content were 4.72 % and 6.13 % (Table 1). As shown in Fig. 2(c), the Ti 2p spectrum of 1-M exhibited the five predominant peaks at 455.2, 455.9, 456.9, 459.1 and 461.4 eV, which correspond to the Ti, Ti2+, Ti3+, TiO2 and C-Ti-Fx bonds, respectively. It was indicated that the extraction of Al atoms layers happened and more electronegative surface terminations (such as O, OH and F) was obtained [39]. Obviously, the Ti-O-Si bond during the amino-functionalized process was grafted on the f-M. Fig. 2(d) showed the high-resolution scan of C 1s spectrum of f-M. It can be fitted into main peaks at 281.0, 283.7, 284.3, 284.9 and 285.8 eV, being assigned to C-Ti-Tx, C—C, C-Si, CN— and C-O-Si, respectively. Graphitic C—C and C-Ti-Tx bonds could be formed because of the selective dissolution of titanium atom and aluminum, respectively, during the etching and delamination [40]. The C-O-Si, C—N and C-Si species resulted from the hydrolysis of 3-aminopropyl triethoxysilane and chemical reaction between silanol group and terminal active groups of Ti3C2Tx. The O 1s spectrum in Fig. 2(e) further confirmed —CTiO ———atom sequence. And the N 1s spectrum of f-M was shown in Fig.S2 in the Supplementary Material. The fitted analysis of Ti 2p, C 1s, N 1s and O 1s XPS spectra implied that 1-M sheets successfully reacted with 3-aminopropyl triethoxysilane and the amination had been finished.
Table 1 Atomic concentration of l-M and f-M (percentage, %).
| Sample | Ti | C | O | F | Si | N |
|---|---|---|---|---|---|---|
| l-M | 19.70 | 41.28 | 20.14 | 18.89 | ||
| f-M | 12.76 | 34.30 | 32.31 | 9.78 | 6.13 | 4.72 |
The FTIR spectra of l-M and f-M were given in Fig. 2(f). Obviously, the OH (3437 cm-1), CO (1634 cm=-1), OH (1397 cm—-1), Ti-H (1540 cm-1), C-F (1092 cm-1) and Ti-O (569 cm-1) groups can be observed in all the samples, suggesting the process of etching and delamination [41]. The existence of OH and O—H groups provided favorable conditions for amination. Abundant hydroxyl retained in surface help l-M to have good dispersion in water. Compared with the l-M, the f-M exhibited four new peaks at 3736, 1131, 1079 and 911 cm-1, being associated with NH2, Si-O-C, Si-O-Si and Ti-O-Si groups, respectively. These groups represented the successful amino-functionalization [42].
The thermal decomposition behaviors of 1-M and f-M sheets were investigated as illustrated in Fig. 2(g). The weight loss of two samples can be divided by three stages [43]. For 1-M, the weight change was 2.37% over the temperature range from 40 to 140 °C, which was assigned to the loss of physically adsorbed water (Stage I). Stage II exhibited a large drop (5.84%) at the temperature range of 140-375 °C. This is due to the decomposition of chemically absorbed water formed by OH group in 1-M surface, which was summed up in the following chemical equation [44]:
Subsequently, a gradual weight loss in the Stage III can be found owing to the generation of O2 (according to Eq. (4)). The total weight loss of 1-M was 9.63%.
In the case of f-M, the percentage of weight loss in Stage II is 7.37%. In addition to the loss of chemically absorbed water, this phenomenon was attributed to the decomposition of amino functional groups on the surface. And the weight loss rate of f-M is higher than that of 1-M from 150 to 376 °C. The decomposition of organosilane molecular chains then led to continuous weight loss at temperature above 524 °C. The existence of amino on the surface of Ti3C2Tx was proved via the thermal decomposition, and its amount is approximately 8.44%.
Fig. 3(a) and (b) depicted the SEM images of 1-M and f-M. After etching and delamination, the closely packed layer structures of Ti3C2Tx sheets were transformed into exfoliated flakes with few-layer of several square micrometers in lateral size. And its surface was smooth and angular. Furthermore, there was no significant change in the size of f-M during the amino-functionalized process. As shown in Fig. 3(c-f), typical TEM images of 1-M and f-M demonstrated the generation of MXene phase with a 2D lamellar structure. The wrinkled and crumpled morphology was found on the surface of all the samples, because of drastic chemical reaction during etching and hydrogen bond existing between Ti3C2Tx sheets. The l-M sheet was almost transparent, implying a high degree of delamination for thinness. However, in term of f-M, its surface was darker and rougher. It was worth noting that some amorphous structure only appeared at the edge of the f-M as shown in the high resolution TEM image (Fig. 3(d)). In contrast, no other amorphous structure existed on the surface of the l-M, indicating the amino groups grew on the f-M. Meanwhile, the corresponding electron diffraction pattern was showed a spot pattern in the inset of Fig. 3(f), revealing that the samples had good crystallinity and were structural integrity. They maintained a complete hexagonal structure during the delamination and functionalization [45].
Fig. 3.
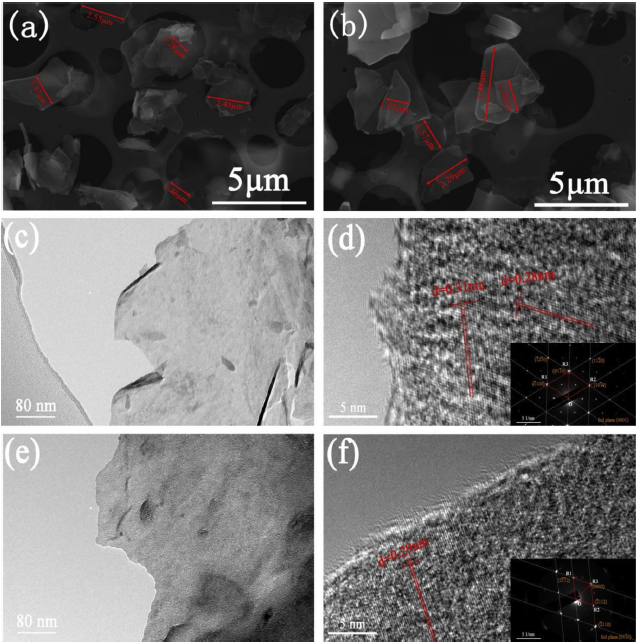
Fig. 3.
Microstructure characterization: SEM and images of l-M (a) and f-M (b); TEM images of l-M (c) and f-M (e); High-resolution TEM images of l-M (d) and f-M (f). Inset shows SAD pattern of relevant Ti3C2Tx.
Fig. 4 shows the digital photograph of l-M and f-M sheets with a concentration of 0.5 wt.% in epoxy resin at different time of 0, 3, 7, 15, 30 days. Both dispersions displayed a black solution after stir. The l-M/epoxy resin suspension was unstable and Ti3C2Tx sheets precipitated after standing of 3 days, while f-M remained well-dispersed in epoxy resin. In addition, the l-M sheets and epoxy resin were completely separated until 30 days. Meanwhile, f-M sheets still were uniformly dispersed in the epoxy resin. The presence of amino groups at the edges of f-M improved the dispersity and compatibility with epoxy resin.
Fig. 4.
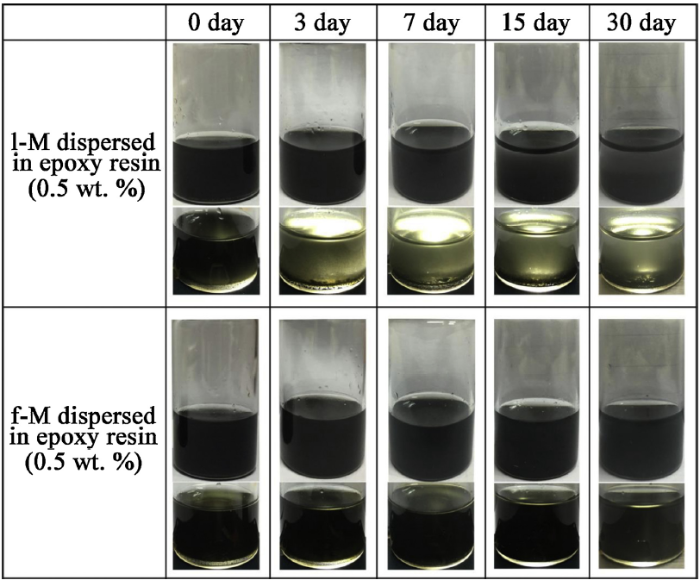
Fig. 4.
As-prepared dispersions of l-M and f-M (0.5 wt.%) in epoxy resin slurry at different standing time.
3.2. Water contact angle and morphology of composite coatings
The microstructure and contact angle of pure EP and as-prepared composite coatings were shown in Fig. 5. For pure EP coating (Fig. 5(a, b)), smooth surface and brittle fracture were observed. A lower contact angle value of 42.71° was presented. In case of l- l-M/epoxy coating (Fig. 5(c-f)), the introduction of -M into epoxy coating caused a relatively rough morphology and some exfoliation. The addition of 0.5 wt.% l-M showed large roughness with some exfoliation. Moreover, the contact angle of the epoxy coating with 0.25 wt.% and 0.5 wt.% l-M arrived at 52.33° and 62.78°, respectively. However, in term of the f-M/epoxy coating (Fig. 5(g-i)), the surface morphology exhibited damage-free, smooth and flexible surface, suggesting that the f-M sheets were well dispersed in epoxy matrix and retained good chemical compatibility with epoxy resin. And the compactness of f-M/epoxy coating increased as the content of f-M sheets rose to 0.5 wt.%. The water contact angle value of f-M0.5% was 82.49°, which was almost twice than that of pure EP. This may be attributed to the changes of surface chemical state caused by the incorporation of f-M sheets. f-M with larger contact angle value could better resist to the diffusion of corrosive medium than those with a smaller contact angle.
Fig. 5.
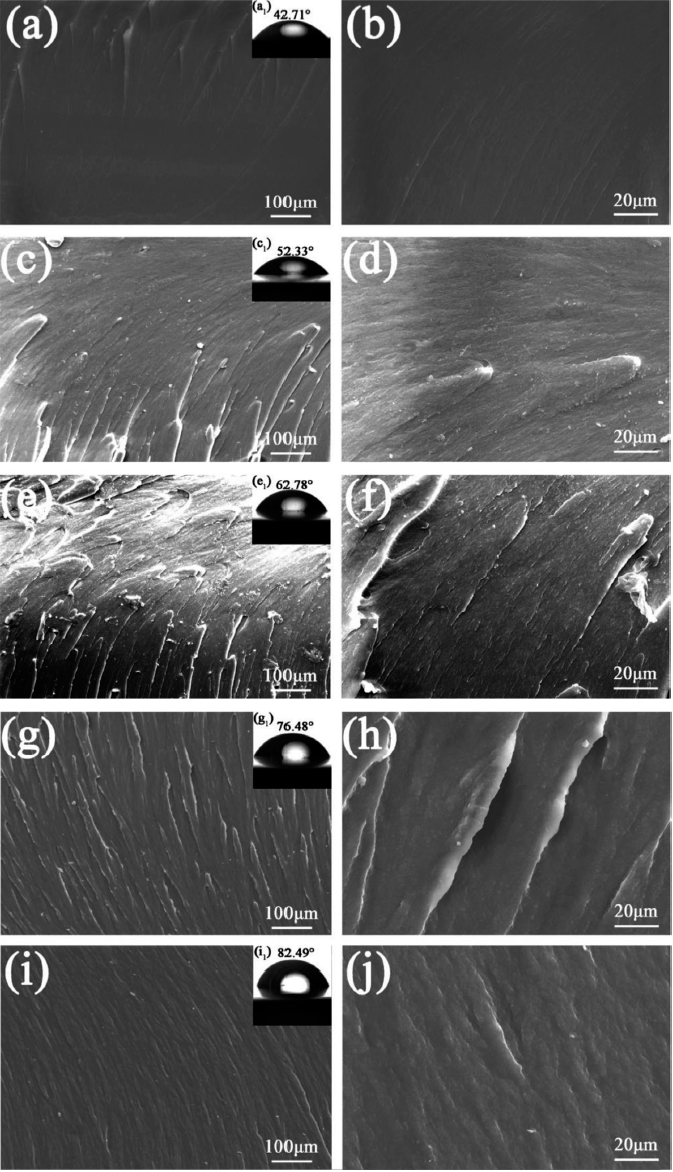
Fig. 5.
SEM images of the cross sections of pure EP (a, b), l-M0.25% (c, d), l-M0.5% (e, f), f-M0.25% (g, h) and f-M0.5% (i, j). The inset shows water contact angle of coating.
3.3. Adhesion strength and dynamic mechanical property of composite coatings
Pull-off test was applied to investigate the adhesion strength of pure EP, l-M0.5% and f-M0.5% as shown in Fig. 6. The adhesion strength of pure EP and l-M0.5% was 3.17 and 3.86 MPa, respectively. In this case, the nature of the epoxy resin was dominated. However, the adhesion strength was improved by about two times with the addition of f-M, because amino which was grafted on Ti3C2Tx sheets facilitated to form bonding force between the coating and substrate. Scratch testing is a speedy method to characterize the adhesion strength of coating on metal substrate. The pure EP, l-M0.5% and f-M0.5% were also evaluated by scratch testing (Fig. S3 in the Supplementary Material). The introduction of strong adhesion bonds between the coating and metal is another reason for the protection performance increment.
Fig. 6.

Fig. 6.
Pull-off strength of pure EP, l-M0.5% and f-M0.5%.
The storage modulus (E') and loss factor (tan δ) of composite coatings as a function of temperature were shown in Fig. S4 the Supplementary Material. The E' of these coatings showed a certain dependence on temperature. The E' value continually decreased during the temperature-rise period, and kept stable when the temperature was over 70 °C. And f-M0.5% presented the higher E' value over a wide range of temperature, indicating that the addition of 0.5 wt.% f-M into epoxy coating can signally increase the stiffness [46]. At the room temperature (25 °C), the E' of pure EP was only 1312 MPa, which was close to that of l-M0.25% (1337 MPa) and l-M0.5% (1400 MPa). These results meant the incorporation of l-M had a slight effect on E' at room temperature (but the difference in performance was still obvious at a low temperature). However, the E' of f-M0.25% and f-M0.5% exhibited higher values of 1572 and 1863 MPa, respectively, because amino-functionalized Ti3C2Tx sheets had the stronger interaction with epoxy resin. Therefore, the movement of epoxy resin molecule chains was restrained and the stiffness of f-M/epoxy coating increased. The tanδ and glass transition temperature (Tg) of all the samples were described in Fig. S4(b) in the Supplementary Material. There were no significant changes in tan δ and Tg for coatings with or without additive.
3.4. Anticorrosion performance of composite coatings
To further examine the impermeability of the as-prepared coatings in corrosion medium, the water absorption (Wt) was measured, and the results were shown in Fig. 7. Obviously, in whole immersion time, the water absorption of all coatings exhibited an upward trend. According to the degree of change of the Wt value, water absorption of coatings could be divided into two stages: (a) the coatings reflected a rapid water uptake rate in the initial immersion, which was due to inherent defects and development of defect in the coatings; (b) the growth of Wt values were gradually inclined to stable, implying saturation of water absorption. The pure EP coating exhibited the largest Wt value 5.11% after 672 h immersion time, indicating that the water can easily pass through the coating. After incorporation of 0.25 wt.% and 0.5 wt.% l-M into epoxy coating, the Wt value was largely reduced by 3.55% and 3.34%, respectively, which revealed the high barrier property of l-M/epoxy coatings. Furthermore, the Wt value of f-M0.25% dropped to 2.19% and a lower Wt value of 1.49% was also observed for f-M0.5%, confirming the better synergistic effect between f-M and epoxy matrix and significant contribution of amino-functionalized f-M sheets in water barrier property. The amino and hydroxyl functional groups in f-M sheets enhanced interaction between f-M sheets and epoxy chains. Therefore, more uniform organic-inorganic networks and the denser f-M/epoxy coating can be generated, which be beneficial to water resistance.
Fig. 7.

Fig. 7.
Water absorption curves for pure EP and composite coatings as a function of time in 3.5 wt.% NaCl solution.
The corrosion behaviors of the pure EP, l-M/epoxy and f-M/epoxy coatings were often evaluated by EIS technique. Fig. 8 presented the Nyquist and Bode plots of the aluminium alloy with the composite coatings under 3.5 wt.% NaCl solution. Scatters and black lines were experimental data and fitting results, respectively. For the Nyquist plots, a larger diameter of the capacitive arc manifests better anticorrosion property of coating [47]. Notably, the capacitive semicircle diameter of all coatings presented a shrunken trend during the immersion, suggesting the degradation in corrosion resistance. In the case of pure EP, Nyquist data displayed two capacitive loops after the initial immersion time (24 h), because of the occurrence of local dissolution and corrosion reaction on the coating/metal interface. Briefly, the meaning of two capacitive loops is that: (a) the high frequency loop stands for the resistance and capacitance of the coating; (b) the low frequency loop signifies the charge transfer resistance and double layer capacitance of the metal-electrolyte interface (for all coatings) [48]. As the soaking time increased, the characteristics of low frequency loop of the pure EP changed from finite layer diffusion by penetration of water and opening of diffusion channel (immersion of 24-72 h), to semi-infinite diffusion due to completely opening diffusion channel (immersion of 96 h to 4 weeks) [49]. Thus, pure EP exhibited a bad anticorrosion performance. For l-M/epoxy coatings, the diameter of the capacitive arc was higher than that of pure EP. And the impedance increased with the content of l-M from 0.25 wt.% to 0.5 wt.%. The finite layer diffusion happened in middle and later stage of soaking process, suggesting water and corrosive medium gradually invaded [50]. Furthermore, the largest capacitive arc radius was observed from f-M0.5% and only one time constant appeared throughout immersion. These results illustrated that the integrity of f-M0.5% coating can be retained and the epoxy coating with 0.5 wt.% f-M had the better anticorrosion performance.
Fig. 8.
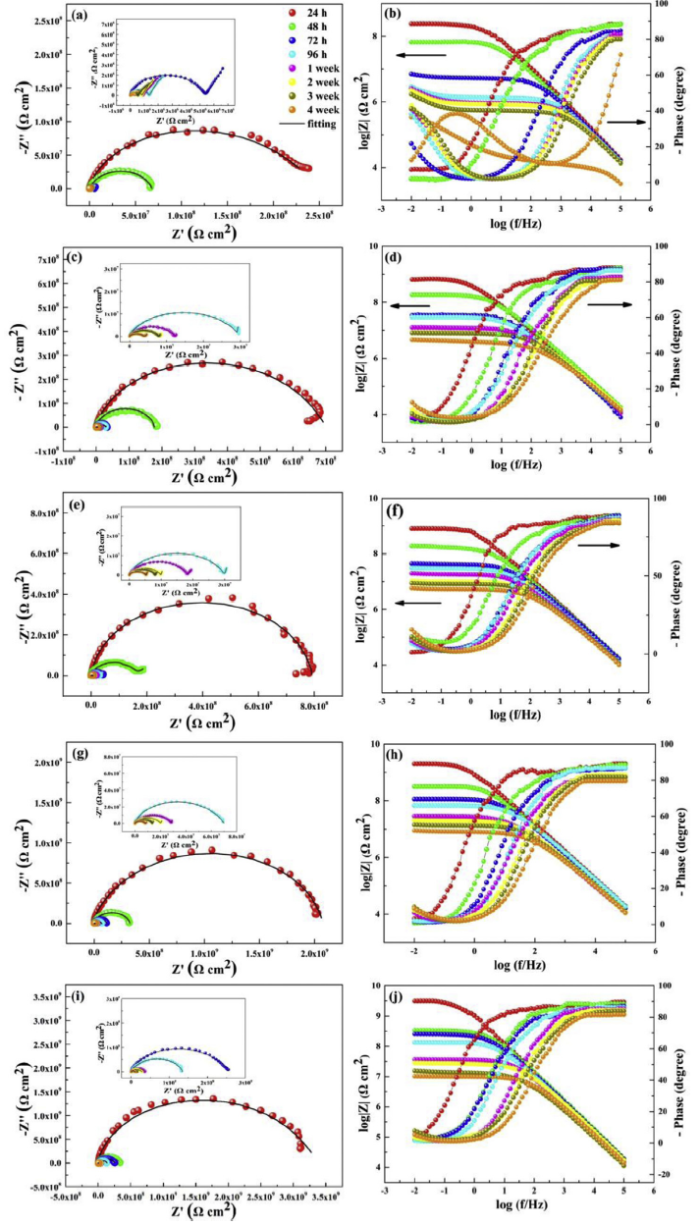
Fig. 8.
Time-dependent Nyquist and Bode diagrams for the 6082 aluminium alloy protected by (a, b) pure EP, (c, d) l-M0.25%, (e, f) l-M0.5%, (g, h) f-M0.25% and (i, j) f-M0.5%.
In case of Bode-impedance plots, the impedance modulus at the lower frequency (|Z|0.01 Hz) is commonly used as an important semi-quantitative indicator for assessing anticorrosion performance of coatings. Usually, the higher |Z|0.01 Hz represents better corrosion protection [51]. For pure EP, the |Z|0.01 Hz value was 2.34 × 10⁸ Ω cm2 (24 h) in the initial immersion. But the |Z|0.01 Hz value greatly decreased to 3.46 × 10⁵ Ω cm2 after 4 weeks of immersion, implying rapid destruction of coating. The plots also displayed two time constants. Plots at a high frequency represent the contribution of coating resistance and micro-porous resistance, while at a low frequency stands for the effect of double-layer capacitor and polarization resistance. In addition, the |Z|0.01 Hz value of l-M0.25% and l-M0.5% was respectively from 6.45 × 10⁸ and 7.94 × 10⁸ Ω cm2 (24 h) to 4.68 × 10⁶ and 5.89 × 10⁶ Ω cm2 (4 weeks), which was about one order of magnitude higher than that of pure EP. This improvement was attributed to 2D structure and large surface area of Ti3C2Tx MXene. For the f-M0.25%, the initial impedance modulus at |Z|0.01 Hz was 2.04 × 10⁹ Ω cm2, then decreased to 8.91 × 10⁶ Ω cm2 after 4 weeks of immersion, which is higher than that of l-M/epoxy coatings. Nevertheless, for epoxy coating with 0.5 wt.% f-M, the initial |Z|0.01 Hz value was up to 3.09 × 10⁹ Ω cm2 and the final |Z|0.01 Hz value was 1.02 × 10⁷ Ω cm2, which was 1-2 orders of magnitude higher than that of the other four samples. And the linear part of the f-M0.5% reflected a slope of -1 in a wider frequency range, suggesting the better corrosion resistance [52]. In case of Bode-phase angle plots, the higher phase angle at a high frequency suggests the lower degeneration of coating. The high-frequency phase angle of pure EP sharply decreased in the immersion process. However, the composite coating could still keep a high value compared to pure EP. And f-M0.5% exhibited a highly capacitive response in wider frequency range. As soaking time increased, the resistive behavior was observed from pure EP and occupied a wider area. The other coatings presented intermediate performance. The above results reveal that the incorporation of amino-functionalized Ti3C2Tx sheets into epoxy coating can effectively slow down the diffusion rate of corrosive media. The better chemical compatibility with epoxy resin chains and well dispersed f-M sheets could form compact barrier network.
To further estimate the corrosion behavior of all the coatings, the EIS results were fitted using Zview software through equivalent electric circuit (EEC) of R(Q(R(QR))) and R(Q(R(Q(RW)))). The fitted results were showed in Fig. S5 in the Supplementary Material. Among the EECs, the Rs, Rpo, Rct, Qc and Qdl represented solution resistance, pore resistance, charge transfer resistance, coating capacitance and double layer capacitance, respectively. And Zw is the Warburg element, standing for linear semi-infinite diffusion, which is not discussed in our work. When diffusion of barrier layer happened or corrosive medium reached (even the corrosion reaction occurred), the EEC could be selected as Fig. S5(a) in the Supplementary Material. Fig. S5(b) in the Supplementary Material was applied to describe corrosive behavior contained finite layer diffusion or semi-infinite diffusion. Theoretically, the higher value of Rpo and Rct means good corrosion protection, and Rpo inevitably decreases owing to a decrease of the coating resistance and/or an increase of corrosion area during immersion process [53]. The Rpo and Rct value of all the coatings displayed a decreasing tendency with immersion time, which was due to the penetration of corrosive medium through defects of coating. The Rpo value of the pure EP sharply decreased from 1.65 × 10⁸ Ω cm2 to 8.31 × 10⁵ Ω cm2 during 72 h immersion. The Rpo value stabilized at 5.62 × 10⁵ Ω cm2 to 3.09 × 10⁵ Ω cm2 after 3-week immersion, and then dramatically decreased to 1.09 × 10⁴ Ω cm2 at 4 weeks. Likewise, the Rct value of the pure EP decreased from 7.07 × 10⁷ Ω cm2 to 7.58 × 10³ Ω cm2 within 4-week immersion. The addition of l-M into epoxy coating visibly enhanced the Rpo and Rct value compared to pure EP. And these values of l-M0.5% were almost higher than that of l-M0.25%. Specially, the Rpo and Rct value of l-M0.5% was 8.51 × 10⁷ Ω cm2 to 8.70 × 10⁵ Ω cm2 and 6.91 × 10⁸ Ω cm2 to 2.18 × 10⁶ Ω cm2 in corrosion process, respectively. Notably, the incorporation of f-M further increased the resistance value and these of f-M0.5% were the largest. After 4 weeks of immersion, the Rpo value decreased gently from 8.91 × 10⁸ Ω cm2 to 4.16 × 10⁶ Ω cm2 and the Rct value only dropped to 7.08 × 10⁶ Ω cm2. Thus, the Rpo and Rct values of f-M0.5% were 1-2 orders of magnitude higher than that of the pure EP and l-M/epoxy coatings. In contrary, the Qc and Qdl value showed an increasing trend during the immersion time. The increase of Qc reflects the water uptake of coating. Therefore, the lower value of Qc and Qdl could exhibit better barrier of corrosive media. In keeping with the result of the Rpo and Rct, the order of Qc and Qdl value was pure EP > l-M0.25% > l-M0.5 % > f-M0.25 % > f-M0.5%.
Based on the results of EIS and water absorption, the pure EP, l-M0.5% and f-M0.5% were selected for Tafel polarization testing after immersion of 4 weeks in 3.5 wt.% NaCl solution. The Tafel polarization curves and correlative parameters were shown in Fig. S6 and Table S1 in the Supplementary Material. The lowest corrosion rate (CR) can be found in f-M0.5% and the CR value was quantized to 1.10 × 10⁻⁵ mm per year. And the CR of f-M0.5% is superior to that of the different reported coatings as shown in Fig. 9 and Table 2. Amino-functionalized Ti3C2Tx as anticorrosive additive in waterborne epoxy coating has some advantages by comparing different two-dimensional fillers, e.g., graphene, graphene oxide and boron nitride hexagonal [2,30,33,48,[54], [55], [56], [57], [58], [59], [60]].
Fig. 9.
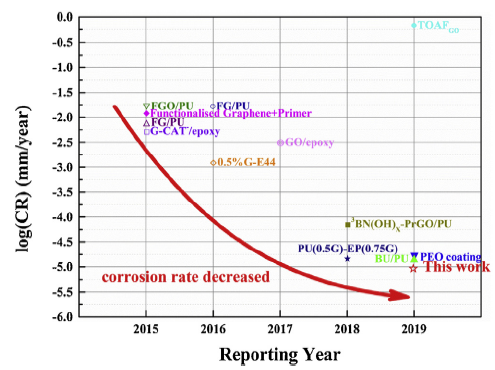
Fig. 9.
Comparison of the corrosion rate of various coatings obtained from the literature.
Table 2
References of coatings from
3.5. Characterization of corrosion morphology and production
Corrosion morphologies and chemical analysis of substrate after 4 weeks of immersion in 3.5 wt.% NaCl solution were further studied by using SEM-EDS and XPS technique. Before the test, the surface coatings were peeled off and substrates were exposed. As shown in Fig. 10, plenty of dense corrosion products were observed on the substrate surface coated with pure EP. The occurrence of corrosion mainly was due to electrochemical reaction of aluminium alloy with O2 in air and NaCl aqueous solution. Therefore, this work studied O, Na and Cl as major corrosion ions. A total of 23.57% O, 0.27% Na and 1.65% Cl elements were detected from pure EP, verifying that a poor anticorrosion performance. A large area of corrosion regions was distributed on the surface of aluminium alloy coated l-M0.25% and corrosion regions were gradually shrunken with the content of l-M arrived at 0.5%. With the addition of l-M sheets, the content of Na and Cl elements was decreased (l-M0.25%), and even vanished (l-M0.5%). However, the weight of oxygen elements stabilized at a high level from 19 wt.% to 25 wt.%. For the f-M/epoxy coating, there were no obvious corrosion regions. The substrate surface was smooth and integrity. Only O element can be seen in EDS analysis and the content was less than 10 wt.%. f-M0.5% still exhibited the better barrier ability. Meanwhile, the corresponding XPS results were shown in Fig. S8 in the Supplementary Material and representative pure EP, l-M0.5% and f-M0.5% samples were investigated. The Al 2p spectrum of pure EP can center at 74.7, 74.1 and 73.6 eV, corresponded to the AlCl3, Al2O3 and Al(OH)3 from substrate surface [61]. For the l-M0.5% and f-M0.5% samples, three main peaks of AlOOH, Al2O3 and Al(OH)3 were observed on the substrates. But 44.18% O and 1.38% Cl atomic amount were detected from the substrate coated with pure EP. And surface coated with f-M0.5% only produced 23.42% oxygen atomic amount.
Fig. 10.
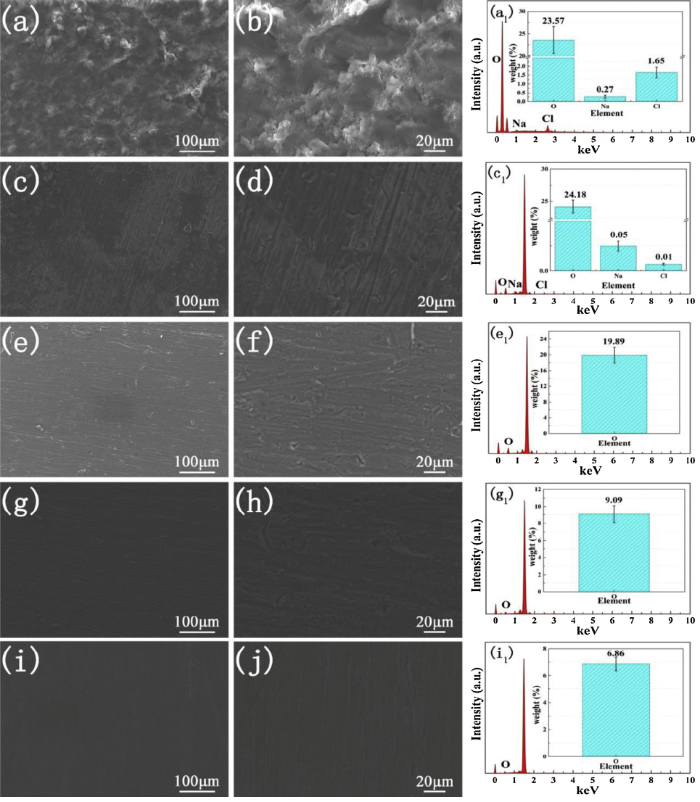
Fig. 10.
SEM images of surface of 6082 aluminium alloy coated by pure EP (a, b), l-M0.25% (c, d), l-M0.5% (e, f), f-M0.25% (g, h) and f-M0.5% (i, j). The EDS curves (the inset is content of relevant corrosive elements) of pure EP (a1), l-M0.25%(c1), l-M0.5%(e1), f-M0.25% (g1) and f-M0.5% (i1) are shown on the right.
3.6. Salt spray test
Salt spray test results were shown in Fig. S9 in the Supplementary Material. Before the coatings were exposed in the salt spray chamber, all the coatings displayed a neat and flat surface. Fig. S9(a2) in the Supplementary Material obviously exhibited some corrosion products and delamination around scribes and beneath of pure EP after exposure of 30 days, indicating poor corrosion resistance and adhesion strength. The incorporation of l-M into epoxy coating decreased the corrosion region around scribes and beneath (Fig. S9(b2, c2) in the Supplementary Material), but the blister and disbonding still appeared. More surprisingly, f-M sheets with amino groups showed better resistance against corrosion in salt spray test condition (Fig. S9(d2, e2) in the Supplementary Material). A small number of corrosion products generated in the scratch region, with pure EP and l-M/epoxy coating as a comparison. As the content of f-M increased, the delamination and blister of the coatings gradually disappeared, owing to good adhesion strength with substrate.
3.7. Protective mechanism for coatings
The pure EP coating system was easily eroded by corrosive medium due to itself brittleness and defects. The incorporation of l-M sheets could extend the diffusion path of O2, Cl- and water to a certain extent, which was attributed to 2D lamellar structure and its large surface area. However, the diffusion pathway was opened in the middle-long term immersion process (from Nyquist plots). Based on the above reasons, the amino-functionalized Ti3C2Tx can be as substitute. The f-M sheets can be dispersed in epoxy resin for a long time. Amino, grafted on Ti3C2Tx, kept a stronger interaction with epoxy groups in epoxy resin chains, thus improving chemical compatibility of f-M and epoxy resin. Good dispersion and interface compatibility led to a compact protective layer and formation of effective barrier network. The diffusion rate of corrosive medium greatly slows down and coating remained intact in the long-term immersion (Fig. 11). According to EIS and XPS results, the corrosion reaction can be divided into two stages:
Fig. 11.

Fig. 11.
Corrosion protection mechanism for pure EP (a), l-M/epoxy coating (b) and f-M/epoxy coating (c).
(a) The first stage:
(b) The second stage:
First corrosion reaction stage implies that the electrolyte reaches the surface and passivates with the substrate. Because chloride can destroy the passivation layer, Cl- infiltrates passivation layer and the chemical reaction occurs in the second corrosion reaction stage. Pure EP coating goes through two stages, while l-M0.5% and f-M0.5% only stop at the first stage. Long zigzag diffusion path will delay electrochemical corrosion reaction.
3.8. Tribological properties of the composite coatings
The coefficient of friction (COF) and wear rate of as-prepared coatings are shown in Fig. 12. As shown in Fig. 12(a), the COF curve of pure EP sharply rose in the initial stage of friction, and then kept relatively stable. The higher COF value was observed and the average COF reached 0.542. Clearly, the addition of l-M to the epoxy coating caused a decreasing trend of COF, which severally fell 6.09% and 16.42% for l-M0.25% and l-M0.5% compared to pure EP. Moreover, the composite coating with 0.25 wt.% f-M exhibited a mild reduction in average COF of 0.443. Besides, the incorporation of 0.5 wt.% f-M into epoxy coating showed the lowest average COF value (0.357) along with the progress of friction, which decreased by 34.13%. These results indicated that the amino-functionalized f-M could improve the tribological property of as-prepared composite coatings. Furthermore, the wear rates were calculated through Eq. (2) and the corresponding results were shown in Fig. 12(b). The wear rates displayed the similar trend with COF. The pure EP had a higher wear rate (7.11 × 10⁻⁴ mm3/N m than composite coatings. The wear rate of l-M0.25% (5.64 × 10⁻⁴ mm3/N m and l-M0.5% (4.84 × 10⁻⁴ mm3/N m samples was reduced by 20.68% and 31.93% in comparison with that of pure EP, respectively. The composite coating with 0.25 wt.% f-M sheets exhibited the decreasing wear rate (3.26 × 10⁻⁴ mm3/N m, which was reduced by 54.14% compared with the pure EP. The f-M with 0.5 wt.% led to the lowest wear rate (1.93 × 10⁻⁴ mm3/N m, suggesting higher wear resistance.
Fig. 12.
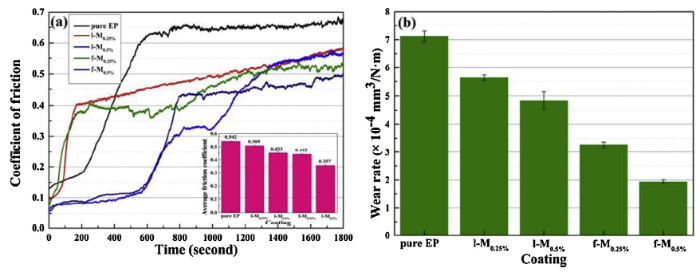
Fig. 12.
Tribological properties of as-prepared coatings: (a) time-dependence of coefficient of friction (the inset is average coefficient of friction) and (b) wear rate.
The 3D morphology, cross-sectional profiles and microscopic morphology of wear tracks on all coatings were shown in Fig. 13. The fatigue deformation and deep furrows were detected from pure EP and composite coatings sliding against the GCr15 steel ball counterpart. Some debris and stacks were distributed on the margin of all wear tracks, which was derived from the desquamation of epoxy coating. And the wear of epoxy coatings was adhesion wear and fatigue wear. As shown in Fig. 13(a1-a3), the worn surfaces of pure EP manifested the broadest width, the largest depth and sectional area (2134.36 μm2), exhibiting the poor wear resistance. By contrast, the wear width and deep from 2D surface profile gradually decreased with the addition of l-M and f-M. Intuitively, the sectional area of composite coatings with 0.25 wt.% and 0.5 wt.% l-M was 1694.08 and 1452.28 μm2, respectively. Again, the decrease in width and sectional area of wear track was observed for the coatings with 0.25 wt.% f-M compared to l-M/epoxy coatings. Under the same condition, those parameters of f-M0.5% showed the lowest value. The sectional area was about five times lower than that of pure EP and about 3-4 times lower than that of l-M/epoxy coating. This was in accordance with the result of wear rate, implying the better anti-wear ability of f-M0.5%.
Fig. 13.
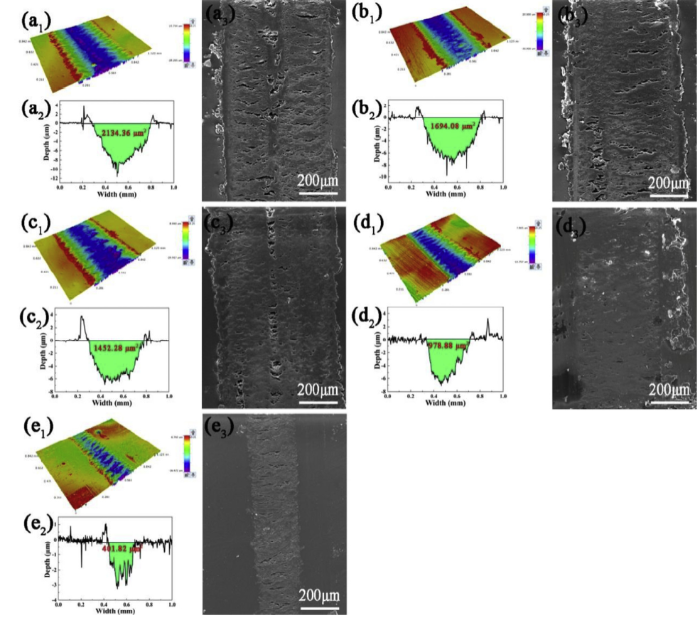
Fig. 13.
3D morphologies, SEM images and cross-sectional profile of wear tracks of pure EP (a1, a2, a3), l-M0.25% (b1, b2, b3), l-M0.5% (c1, c2, c3), f-M0.25% (d1, d2, d3) and f-M0.5% (e1, e2, e3).
3.9. Analysis of anti-wear mechanism
The anti-wear mechanism of the composite coatings was shown in Fig. 14. The waterborne epoxy resin is a normal thermosetting resin, dominated by severe plastic deformation and fatigue deformation during the friction process [62]. After the friction test, the deep and sequential furrows were observed in wear tracks and some epoxy resin scraps exfoliated from coating were attached to the steel ball counterpart. According to the previous literature and the experimental results acquired by this work, the adhesion wear and fatigue wear in this system can be confirmed [63]. For adhesion wear, the contact area of ball-on-plate configuration is one of the important factors affecting the tribological performance. Plastic deformation of epoxy coating causes a large contact area for the ball/coating contact, which could deteriorate the friction and wear. In the DMA test (Fig. S4(a) in the Supplementary Material), storage modulus as a parameter characterizes the stiffness of coatings. Normally, the higher storage modulus suggests the higher stiffness, thereby limiting the deformation ability of epoxy resin. The pure EP coating with the lowest storage modulus exhibited a larger deformation (Fig. 13) and terrible wear rate. Moreover, it can be supposed that the epoxy coating with 0.25 wt.% and 0.5 wt.% of l-M can strengthen its hardness and be beneficial to reduce the contact area. The stress transfer between Ti3C2Tx sheets and epoxy happens easily. On the other hand, the exfoliated l-M could enter in the worn surface and act as a thin lubricating film to decrease the shearing stress and direct contact of counterparts [64]. Furthermore, the Young’s modulus of Ti3C2Tx is 333 ± 30 GPa beyond the average values of other 2D nano-materials including graphene oxide, reduced graphene oxide and molybdenum disulfide [65]. The surface moieties have a weaker effect on the mechanical properties of Ti3C2Tx (theoretical value is 502 GPa) compared to graphene (graphene vs. GO : 1050 GPa vs. 210 GPa) [23,65]. Thus, Ti3C2Tx performs better tribological properties. Besides, amino-functionalized Ti3C2Tx sheets in epoxy coating offer the great improvement of storage modulus, which was attributed to the increase of interfacial interactions between the f-M and epoxy matrix. This effect brings about resisting plastic deformation and micro-cracking of the f-M/epoxy coatings. In addition, well dispersed f-M sheets hinder the occurrence of agglomeration and reduce the stress concentration. Therefore, the incorporation of amino-functionalized Ti3C2Tx sheets with optimal addition into matrix simultaneously improves the friction-reducing and anti-wear properties.
Fig. 14.
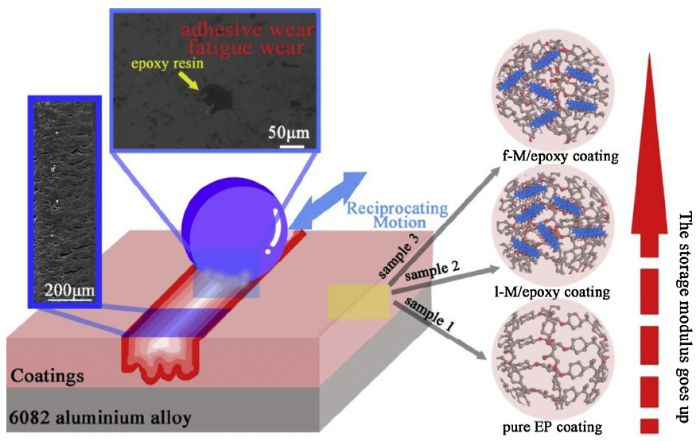
Fig. 14.
Anti-wear mechanism for pure EP (a), l-M/epoxy coating (b) and f-M/epoxy coating (c).
4. Conclusions
In summary, amino-functionalized few-layered Ti3C2Tx sheets were prepared via etching, intercalation/delamination technology and amination for affording good dispersity and interface interaction in waterborne epoxy coating. The anticorrosion and anti-wear properties of as-prepared composite coatings with functionalized Ti3C2Tx sheets were evaluated. The following conclusions can be drawn:
(1) The f-M sheets in epoxy resin slurry still maintain stable and uniform for 30 days, because amino groups could interact with epoxy groups. The adhesion strength between the coating and metal substrate is enhanced by the interaction between amino and hydroxyl groups on metal surface.
(2) f-M/epoxy coatings with 0.5 wt.% optimal addition exhibit the best corrosion property. Specifically, after immersion of 4 weeks, the impedance modulus of f-M0.5% was maximum and |Z|0.01 Hz value (1.02 × 10⁷ Ω cm2) was -2 orders of magnitude higher than that of pure EP coatings. The lowest icorr (1.01 × 10⁻⁹ A/cm2) and the corrosion rate are attributed to well dispersion of amino-functionalized Ti3C2Tx sheets and the formation of tortuous network in the epoxy coating for lengthening diffusion path of electrolyte. Moreover, the f-M could repair the defects and compact the coating.
(3) f-M0.5% also manifests good tribological performance (the average COF value of ∼0.357, the wear rate of 1.93 × 10⁻⁴ mm3/N m, mainly depending on good mechanical properties of MXene and the enhancement on stiffness of f-M/epoxy coating.
(4) Novel 2D Ti3C2Tx MXene as additive into organic coating expands the strategy of corrosion and wear resistance. In the future works, more practical and efficient modification of MXene should be developed on account of different needs.
Acknowledgements
This work was financially supported by the National Natural Science Foundation of China (Nos. 51705435 and 51575459) and the Key Project of Sichuan Department of Science and Technology (Nos. 2018JZ0048 and 2019YFG0292).
Appendix A. Supplementary data
Supplementary material related to this article can be found, inthe online version, at doi:https://doi.org/10.1016/j.jmst.2020.05.002.
Reference
DOI
URL
PMID
[Cited within: 2]

Graphene is impermeable to all molecules and has high chemical stability, which makes it an excellent anticorrosion coating for metals. However, current studies have indicated that galvanic coupling between graphene and a metal actually accelerates corrosion at the interface. Due to the insulating nature of polymers, graphene-polymer composite coatings with a strong interaction between the filler and the polymer matrix are an alternative means of addressing this issue. Nevertheless, such coatings require well-dispersed graphene flakes to lengthen the diffusion paths of gases or liquids, while preventing the formation of a conducting network from graphene to the metal. The difficulty in preparing such coatings was mainly due to problems with the control of the assembled phase during interfacial reactions. Herein, the interactions between the filler and the polymer were found to be a key factor governing anticorrosion performance, which has scarcely been previously reported. The advantage of graphene as a filler in anticorrosion coatings lies in its dispersibility and miscibility with both the casting solvent and the polymer. Electrochemically exfoliated graphene (EC-graphene) with appropriate surface functionalities that allow high miscibility with waterborne polyurethane (PU) and hydrophobic epoxy has been found to be an ideal filler that outperforms other graphene materials such as graphene oxide (GO) and reduced graphene oxide (rGO). Furthermore, a bilayer coating with EC-graphene additives for PU over epoxy has been found to reduce the corrosion rate (CR) to 1.81 x 10⁻⁵ mm per year. With a graphene loading of less than 1%, this represents the lowest CR ever achieved for copper and steel substrates and a diffusion coefficient that is lower by a factor of nearly 2.2 than that of the pristine polymer. Furthermore, we have shown that by controlling the amount of graphene loaded in the polymer galvanic corrosion favored by the formation of an interconnected graphene percolation network can successfully be limited. The present study, together with a facile and eco-friendly method of nanocomposite synthesis, may pave the way toward practical applications in the development of graphene-based anticorrosion coatings.

 WeChat