

1. Introduction
The reliability and durability of equipment are threatened by corrosion, particularly when the equipment is used in ocean environments where corrosion failure may be caused by stress corrosion cracking (SCC) [1]. Corrosion prevention and service life prediction are the main aspects to ensure equipment safety, and the latter is primarily performed based on the SCC mechanism and crack growth rate (CGR) [2,3]. As a cracking process involving constant and cyclic peak loading, low-frequency cyclic loading in an actual ocean environment is regarded as one of the main reasons for fracture failures in metal [4,5]. Most of previous studies on SCC are not suitable for analysing crack growth under cyclic loading, because of the variation of local environments and stress-strain concentration at crack tip during the crack growth process [4,[6], [7], [8]].
It has been proposed that the stress-strain concentration induce the deformation at crack tip [9]. The plastic deformation impacts the mechanical properties of metal [10]. Moreover, the deformation results in an increase of local potential, which accelerates the electrochemical reaction rate [11]. There is approximately no oxygen within the crack [12]. Some researchers have shown that the dissolved metal cations will hydrolyse to produce H+, resulting in the acidification at the crack tip [7,13,14]. Sandoz et al. [13] discovered that pH at the crack tip of various types of alloy steel was in the range of 3.6-3.8. Cooper and Kelly [14] identified that the crack tip pH of alloy steel was approximately 3.0 in a near-neutral solution. These studies show that the pH at crack tip varies under different conditions. The pH change is related to the reduction reaction of H+ to produce H [15]. The H generated by the reduction of H+ was absorbed on the surface and penetrated into the metal [16,17], which will induce the hydrogen embrittlement (HE), when the aggregation of H reaches the critical concentration, and thus increase the SCC susceptibility [[18], [19], [20]]. Because the pH influences both the corrosion and SCC behaviour [21], it is necessary to measure the crack tip pH when the crack growth factors are investigated.
Previous studies noted that pH in the crack is also affected by the environment outside the crack [7,14,21]. Cathodic potential has been widely applied to retard general corrosion [22]. However, an improperly selected cathodic potential would accelerate SCC propagation [19,23]. This phenomenon is mainly attributed to two causes. Under an insufficient cathodic potential, the synergistic effect of anodic dissolution (AD) and weak HE would increase SCC susceptibility [19]. In contrast, an excessive cathodic potential would deteriorate HE, resulting in higher SCC susceptibility [18]. Furthermore, the increase of dislocations would enhance HE susceptibility [10]. However, there has been very little research reported on the crack growth behaviour under cathodic potential.
In this work, the crack growth behaviour of E690 steel under cyclic loading was investigated in artificial seawater under cathodic potentials. During the tests, the pH and the Cl- concentration at the crack tip were measured in-situ with a mini pH electrode and a self-made Cl- electrode. Scanning electron microscopy (SEM), and electron backscatter diffraction (EBSD), were used to study crack growth behaviour. It is intended that the results of the study could provide useful information for the further investigation of crack growth behaviour and actual engineering applications.
2. Experimental
2.1. Material and solution
The sample used in the work was cut from an E690 low-alloy steel, which had the following chemical compositions (wt%): 0.15 C, 0.2 Si, 1.0 Mn, 0.0014 S, 0.99 Cr, 1.45 Ni, 0.0091 Cu, 0.37 Mo, 0.03 V, 0.036 Al and Fe balance. The microstructure of E690 steel is the same as that in our previous studies [20,21].
Artificial seawater was used in cyclic loading tests, wherein the composition (g/L) was 24.53 NaCl, 5.2 MgCl2, 4.09 Na2SO4, 1.16 CaCl2, 0.695 KCl, 0.201 NaHCO3, 0.027 H3BO3, 0.025 SrCl2 and 0.003 NaF, in accordance with ASTMD1141. The pH value was adjusted to 8.1 with 0.1 mol/L HCl and NaOH solution.
2.2. Crack growth tests
The crack growth behaviour of E690 steel in artificial seawater was studied under cyclic loading, with the tests according to ASTM E647 [24]. Fig. 1(a) and (b) shows the schematic diagram of equipment and the dimensions of the compact tension (CT) specimen used in the test. An electrochemical workstation with a traditional three-electrode system was used to apply cathodic potentials, where the specimen, platinum sheet and saturated calomel electrode (SCE) were used as the working electrode (WE), counter electrode (CE) and reference electrode (RE), respectively. The cyclic loading tests were conducted with a WDML-30kN materials testing system at a frequency of about 1.21 × 10⁻³ Hz. The tests were performed at the stress range of 14,000-24,000 N in artificial seawater and at the stress range of 14,000-26,000 N in air. The crack length of the CT specimens was continuously monitored in-situ with a high-performance charge-coupled device (CCD) camera system connected to a computer, with the method same with our previous study [21]. The image of the crack on the surface of CT specimen can be observed on computer with a software and the CCD system. The crack length on the image can be measured through the software, where the scale of the measurement can reach 0.001 mm. During the test, the crack length was recorded during the test. At the same time, the corresponding time was recorded. The difference value of crack lengths between two measurements was the crack growth length in the certain period of time. Furthermore, CGR was calculated by this method.
Fig. 1.
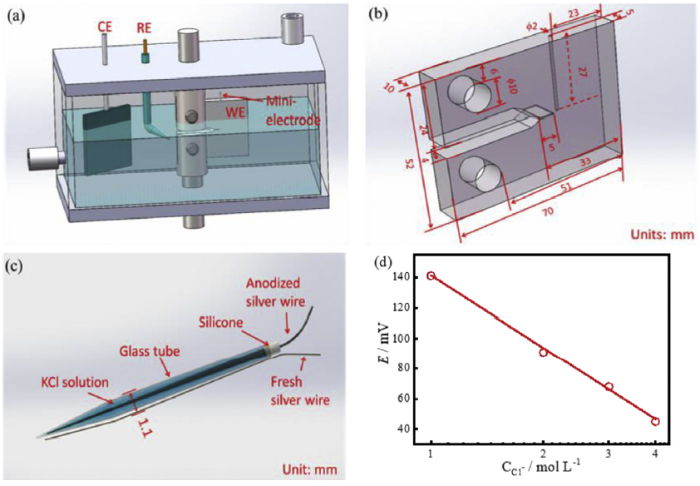
Fig. 1.
Schematic diagram of the device: (a) cyclic loading experiment equipment, (b) dimensions of the CT specimen, (c) mini-electrode and (d) calibration graph for the Cl- concentration.
Before the test, a pre-crack with a length of 2.1 mm was made to simulate the crack initiation in the fatigue loading test in air. The stress intensity factor (K) was used in the experiment to evaluate the crack growth behaviour, wherein K was calculated as follows [24]:
where P is the load; B and W are the thickness and the breadth of the sample, respectively; and α = a/W, where a is the crack length. The stress intensity factor range was given by ΔK = Kmax- Kmin, where Kmax and Kmin represent the maximum and minimum stress intensity factors in a load circle, respectively.
A hole was machined into the CT specimen to measure the pH value, Cl- concentration and potential at the crack tip, as shown in Fig. 1(b). The pH and the Cl- concentration at the crack tip were measured with the pH electrode and a self-made Ag/AgCl ion-selective electrode. The pH electrode is an AMANI-1000-L mini-electrode (by Innovative Instrument Company) with a diameter of 800 μm, which has a precision of 0.003-0.005 and the measuring range of 2-12. The Ag/AgCl ion-selective electrode was made of high-purity silver wire with a diameter of 0.5 mm, which was anodised in 0.1 mol/L KCl solution for 2 h with a current density of 0.1 mA/cm2, and then immersed in 1 mol/L KCl solution for 48 h. Afterwards, the anodised silver wire was inserted into a capillary glass tube to be used as the pony-size reference electrode. The capillary glass tube has a diameter of 1 mm and wall thickness of 0.1 mm. One end of the tube has tiny pores and another end was sealed with silicone. 1 mol/L KCl solution was injected into the tube. The open circuit potential (OCP) of the pony-size reference electrode was measured with a three-electrode system in a 1 mol/L KCl solution, in which a platinum sheet and SCE were used as the CE and RE, respectively. The pony-size reference electrode would be used only if its OCP is relatively stable. Fresh high-purity silver wire with a diameter of 0.1 mm was polished using 5000 grit SiC water sandpaper, and then attached to the tube wall in Fig. 1(c). The potentials between the fresh silver wire and the anodised silver wire were measured with a multimeter in KCl solution with different concentrations. The relationship between the potentials and the KCl concentration is shown in Fig. 1(d). It can be seen that the potentials had a linear relationship with the KCl concentration. Thus, the plot of Fig. 1(d) was used to calibrate the Cl- concentration. During the crack growth process, the potential between the fresh silver wire and the anodised silver wire in the electrolyte in the crack was measured to calculate the Cl- concentration at the crack tip.
After the fracture, the corrosion product film on the fracture surface was observed with SEM and its chemical composition was analysed via energy dispersive X-ray spectroscopy (EDS). Furthermore, the detailed phase compositions in the corrosion products were inspected with micro Raman spectroscopy. Raman analysis was performed using an InVia Reflex instrument with a YAG laser (532 nm). Raman shift is 1600 cm-1 and the acquisition time is 30 s. After the EDS and Raman tests, the corrosion products were removed from the fracture surface, and the fracture surface morphology was observed via SEM.
Additionally, in order to observe the crack propagation path during the crack growth process, the cross-section sample was cut from the CT specimen along the radial direction. The sample with the crack was embedded in electrically conductive toner and polished by hands and then with an oxide polishing suspension (OPS). After it was cleaned with ethanol and dried in cold air, EBSD analyses was conducted using a field emission scanning electron microscope with a step of 0.1 μm.
2.3. Hydrogen content test
In order to further analyse the SCC behaviour at the crack tip, the hydrogen content in different environments was measured. In this section, the solution with 3.5 wt% NaCl was used, which was de-aerated using a high-purity N2 atmosphere, with the pH value adjusted by 0.1 mol/L NaOH and HCl solution. The samples with the dimension of 8 mm × 8 mm × 3 mm was gradually polished to 1500 grit and cleaned with alcohol. One set of samples were immersed in the solutions with pH of 4.0, 5.0, 6.0 and 7.0 for 60 h, respectively. Another set of samples were immersed for 60 h with the applied cathodic potential of -0.75 V, -0.85 V, -0.95 V, -1.05 V and -1.2 V, respectively. Then, the samples were removed from the solutions and cleaned by first removing the surface rust, and then cleaned with deionised water and alcohol. After dried using cold air, the content of hydrogen within the sample was tested with infrared spectroscopy method, same with our previous study [25].
All the tests were repeated 3 times with care to ensure the accuracy of the results at room temperature (25 ± 1 °C). In this work, the potentials were measured with respect to the SCE potential.
2.4. Electrochemical tests
In consideration of the acidification and the concentration of Cl- measured in this work, electrochemical tests of E690 steel were conducted in a simulated crack tip electrolyte. According to the results, the simulated solution with pH value of 4.0 and the concentration Cl- of 4.0 mol/L was used to assess the electrochemical behaviour at the crack tip. Due to the lack of oxygen within the crack [12], prior to testing, the simulated solution was deaerated with a high-purity N2 atmosphere. During the tests, a N2 gas follow of 200 mL/min was deaerated into the simulated solution. The electrochemical measurement is the same as that in our previous studies [20,21]. The polarisation curves were conducted at a scanning rate of 0.5 and 50 mV/s.
3. Results
3.1. Acceleration effect of SCC on crack growth behaviour of E690 steel
3.1.1. Crack growth rate of E690 steel in air and artificial seawater
Fig. 2 shows the CGR of E690 steel in air and artificial seawater. It can be seen from Fig. 2(a) that the crack lengths increased steadily under both conditions as the soaking time increased, and the CGR in artificial seawater was obviously higher than that in air. To further analyse the dependence of the crack growth behaviour on K, da/dt (where t is the time) as a function of ΔK is plotted in Fig. 2(b). The da/dt value in artificial seawater is higher than that in air. And, the non-linear formula was used for fitting data, to obtain the fitting lines base on the testing data. And the stress intensity factor range threshold for crack growth (ΔKth) is obtained according to fitting results. ΔKth in artificial seawater is lower than that in air. These findings indicate that SCC enhances the crack growth and accelerates CGR. In Fig. 2(b), da/dt gradually increases with increasing ΔK in air or artificial seawater. Moreover, da/dt stays in a relatively stable range, so the mean CGR is used to represent the crack growth behaviour. The mean CGRs in air and artificial seawater are 2.26 × 10⁻² mm/h and 2.52 × 10⁻³ mm/h, respectively.
Fig. 2.
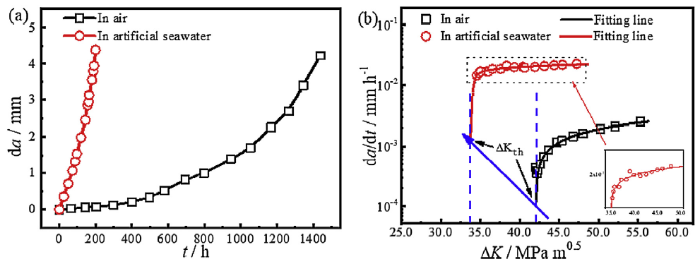
Fig. 2.
CGR of E690 steel in air and artificial seawater: (a) crack length as a function of time and (b) da/dt as a function of ΔK.
3.1.2. Crack growth path of E690 steel in air and artificial seawater
After the test, the part with main growth path was cut from CT specimen, so the fracture surface inside the main crack was observed. Fig. 3 shows the fracture morphology of the main crack growth path of E690 steel in air and artificial seawater. The fracture in air clearly exhibits a staircase-like surface. The further magnified view of this morphology in Fig. 3(a1) shows that in the early stage of crack growth, the local cleavage surface has stair-like morphology divided by the tearing ridges. In the later stage of crack growth in Fig. 3(a2), the area of the cleavage fracture decreases, the number of tearing ridges increases, and obvious dimples can be found on the fracture surface. These suggest that fracture becomes more ductile in the later stage of crack growth. Compared to the fracture surface in air, the fracture surface in artificial seawater in Fig. 3(b) has higher roughness, indicating that the occurrence of SCC impacts the crack growth behaviour. The further magnified morphology in Fig. 3(b1) and (b2) shows that the local cleavage fracture exhibits staircase-like morphology divided by the tearing ridges. Compared to the fracture surface in the early stage of the crack growth process in Fig. 3(b1), the fracture surface in the later stage in Fig. 3(b2) exhibits a smaller area of local cleavage and a larger number of tearing ridges because of the change of the K value with the extension of the crack length, according to Eq. (1).
Fig. 3.
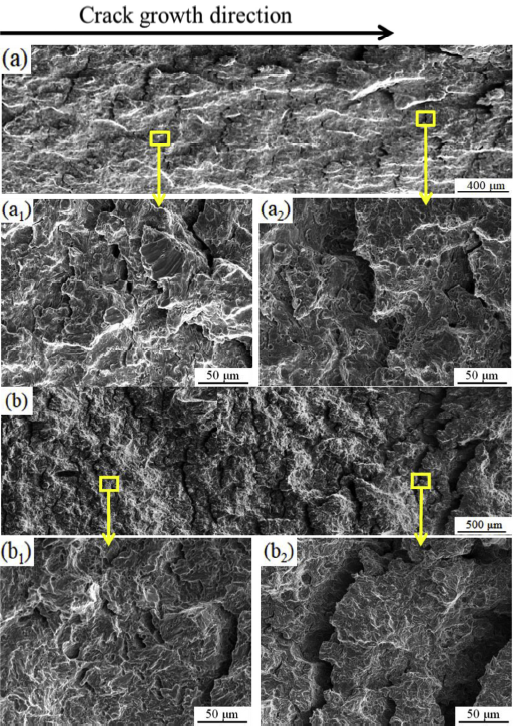
Fig. 3.
Fracture morphologies of E690 steel during the crack growth process in (a) air and (b) artificial seawater.
The crack growth path of E690 steel in air and artificial seawater was observed via EBSD, and the results are shown in Fig. 4. The inverse pole figure (IPF) map in Fig. 4(a1) shows a crack growth path crossing the prior austenite grain, indicating that E690 steel had transgranular fracture in air. For the further analyse of the crack growth behaviour, the corresponding image quality (IQ), kernel average misorientation (KAM), and KAM with grain boundaries are shown in Fig. 4(a2), (a3) and (a4), respectively. In Fig. 4(a2), lath bainite boundaries (LBBs) indicated by the white arrows are distributed in the prior austenite grains (PAGBs), whose grain boundary is marked by a yellow dotted line. In the KAM map in Fig. 4(a3), high values appear around the crack tip, indicating high density of dislocations and residual stress [[26], [27], [28]]. Further observation of the KAM with grain boundaries in Fig. 4(a4) reveals that high KAM areas are mainly surround the low-angle grain boundaries (0°-15°), which corresponds to the LBBs in Fig. 4(a2). Combining the results of the IPF, IQ and KAM maps in Fig. 4(a1-a4) shows that most LBBs belong to low-angle grain, and residual stress or local strain has a tendency to concentrate around LBBs in the crack growth process. Fig. 4(b1-b4) shows that the cracks propagate through prior austenite grains, micro residual stress and local strain primarily distributed near the LBBs around cracks, which is similar to the observations of Fig. 4(a1-a4). The concentration of residual stress or local strain will accelerate the stress corrosion cracking and cracking growth. Those suggest that the fracture cracks of E690 steel in both air and artificial seawater grow through the grains, that is, transgranular fracture.
Fig. 4.

Fig. 4.
Crack growth path of E690 steel in (a) air and (b) artificial seawater: (a1 and b1) IPF, (a2 and b2) IQ, (a3 and b3) KAM and (a4 and b4) KAM with grain boundaries (white arrows indicate LBBs and yellow circles indicate PAGBs).
3.2. Crack growth behaviour of E690 steel in artificial seawater at various potentials
3.2.1. Crack growth rate of E690 steel under applied potentials
Fig. 5 shows the CGR of E690 steel in artificial seawater under various potentials. It can be seen from Fig. 5(a) that the crack expands steadily and gradually under different potentials, and propagation rate gradually increases with time. Fig. 5(b) is a plot of the CGR as a function of ΔK, used to estimate the crack growth properties. In Fig. 5(c), the average CGR is used to estimate the crack growth characteristics of E690 steel at various potentials. As applied potential moves negatively, CGR decreases first and then increases, and a critical value occurs at -0.75 V, which indicates that the external potentials have the influence on the crack growth behaviour of E690 steel in artificial seawater.
Fig. 5.
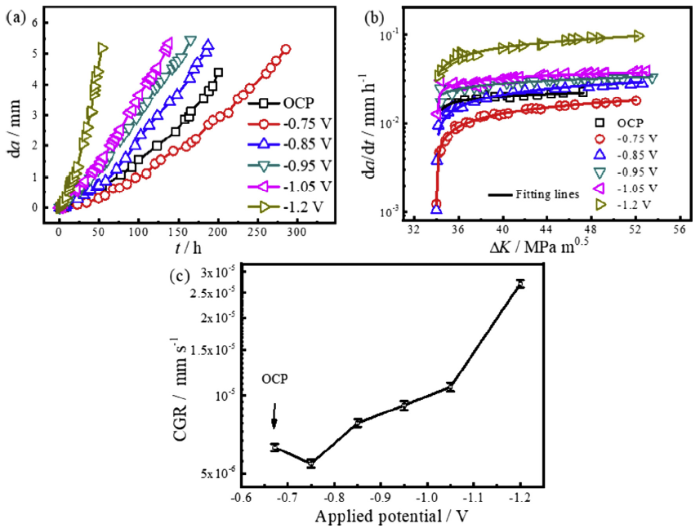
Fig. 5.
CGR of E690 steel under various potentials: (a) crack length as time elapses, (b) da/dt as a function of ΔK and (c) CGR as a function of the applied potential.
3.2.2. Fracture surfaces of E690 steel under various potentials
Fig. 6 shows images of the corrosion products and the corresponding EDS results and in situ Raman spectra on the fracture surface of E690 steel under different potentials. Fig. 6(a-d) are the morphologies of the corrosion products on the fracture surface. OCP sample has a compact and relatively uniform corrosion film with some globular particles in Fig. 6(a). Under the influence of the external cathodic potentials, the corrosion products decrease as the native potential increases. The corrosion products distributed on the local of fracture surface are marked with the red line in Fig. 6(b-d). The elements of the corrosion products marked are analysed, and the EDS results are shown in Fig. 6(e). The EDS results show that the higher the negative potential, the lower the content of Cl and S, the higher the content of Mg and Na. As the negative potential increases, the content of O decreases first and then increases, and the lowest O content is observed at -0.85 V.
Fig. 6.
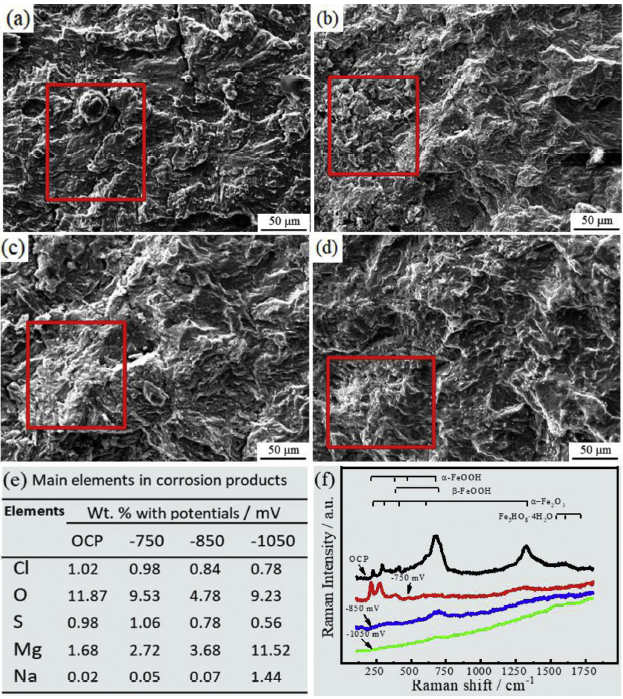
Fig. 6.
Images of corrosion products on the fracture surface of E690 steel at various potentials: (a) OCP, (b) -0.75 V, (c) -0.85 V, and (d) -1.05 V. (e) EDS results and (f) in situ Raman spectra on the fracture surface of E690 steel.
The Raman results presented in Fig. 6(f) show that the applied potential affects the compositions of the corrosion products. According to the previous studies [29], the corrosion products on fracture surface are mainly α-FeOOH, β-FeOOH and α-Fe2O3 at OCP and -0.75 V external potential. At -0.85 V and -1.05 V, the Raman spectra only show weaker peaks of β-FeOOH, indicating that the electrochemical reaction of the corrosion is inhibited. Previous studies have reported that the applied cathodic potential will restrain the oxidizing reaction of Fe [19,30]. Thus, the increase of the negative cathodic potential promotes inhabitation of the corrosion products formation in Fig. 6(f), which leads to the decrease of the O content in Fig. 6(e) and the thickness of the corrosion film in Fig. 6(a-d). As the negative cathodic potential increases further, the reduction reaction of H2O is enhanced to generate OH- [12], which relates to the increase of the O content in Fig. 6(e).-0.85 V is a critical cathodic potential of electrochemical reaction.
Fig. 7 shows SEM images of the fracture surfaces of E690 steel under various potentials after derusting. All images show quasi cleavage characteristics, and the local cleavage fracture has staircase-like morphology divided by tearing ridges. Comparing with OCP structure, applying -0.75 V in Fig. 7(b) potential causes the increase of the coverage ratio of the tearing ridge and the decrease of the area of each local cleavage fracture, indicating a decrease in SCC susceptibility at the crack tip. As the negative cathodic potential increases further in Fig. 7(c-f), the area of local cleavage gradually increases, and the number of tearing ridges decreases, suggesting that the SCC susceptibility at the crack tip increases. At -1.05 V and -1.2 V, the fracture surfaces show obvious brittle fracture characteristics in Fig. 7(e) and (f), and the second cracks are larger than those at other potentials, indicating the increase of brittle fracture.
Fig. 7.
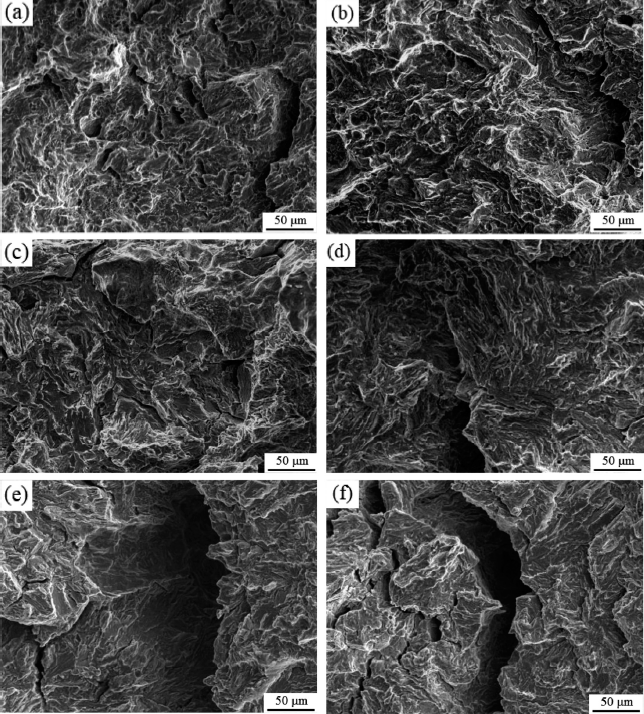
Fig. 7.
Fracture images of E690 steel under various potentials after derusting: (a) OCP, (b) -0.75 V, (c) -0.85 V, (d) -0.95 V, (e) -1.05 V and (f) -1.2 V.
3.2.3. Crack growth path of E690 steel under cathodic potentials
The crack growth path of E690 steel in artificial seawater under cathodic potentials of -0.75 V and -1.05 V was analysed via EBSD, and the results are shown in Fig. 8. The IPF maps in Fig. 8(a1) and (a2) indicate the transgranular fractures. The KAM maps in Fig. 8(b1) and (b2) show that the microscale residual stress and local strain mainly distribute at grain boundaries with low rotation angle (0°-15°) along the crack growth path, which is the same as the results in Fig. 4. It indicates that cyclic loading leads to the concentration of microscale residual stress and dislocations around the crack tip during the crack growth.
Fig. 8.
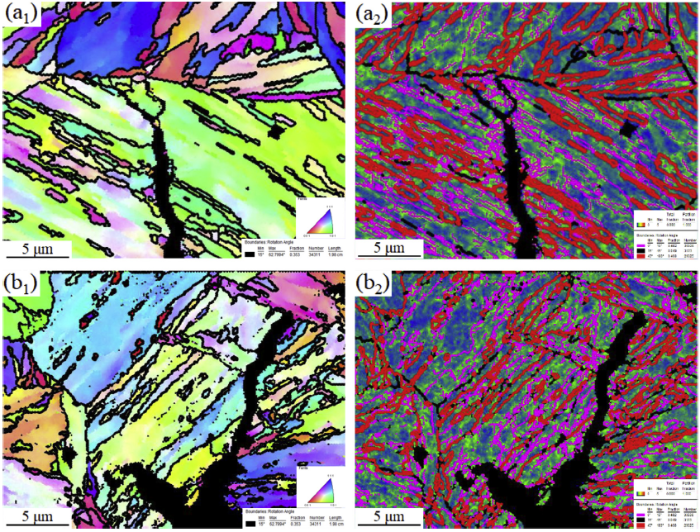
Fig. 8.
Crack growth path of E690 steel at (a1 and a2) -0.75 V and (b1 and b2) -1.05 V: (a1 and b1) IPF and (a2 and b2) KAM with grain boundaries.
3.3. pH value and Cl- concentration at the crack tip
The SCC behaviour of low-alloy steel is affected by the environment, especially the pH value and ion concentration. Thus, the environment at the crack tip of E690 steel was analysed with an in-situ measurement method during the crack growth in artificial seawater. Fig. 9 shows the pH and Cl- concentration in the crack vs the distance from the crack tip at OCP. The crack tip has the lowest pH at 4.1, and the pH increases with increasing distance from the crack tip in Fig. 9(a). The concentration of Cl- is approximately 3.8 mol/L at crack tip, which decreases gradually as the distance from crack tip increases. The previous works have noted that the electrochemical reaction affected the electrolyte acidification in the crack tip [14], and the degree of acidification controlled the SCC susceptibility [21]. Our previous studies demonstrated that the applied cathodic potential had influence on the electrochemical reaction on the surface of metal [19]. Therefore, if the electrochemical reaction in the crack is affected by the cathodic potential, the pH value in the crack will be influenced too.
Fig. 9.
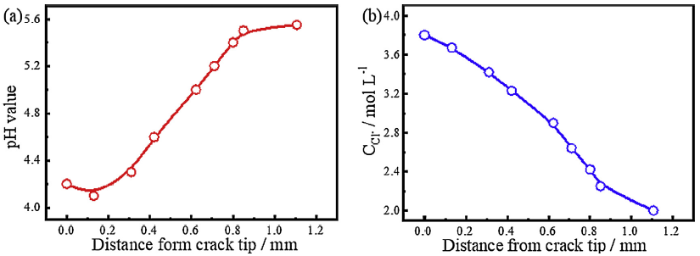
Fig. 9.
Dependence of the environment within the crack on the distance from the crack tip at OCP: (a) pH value and (b) Cl- concentration.
Fig. 10 shows the pH in the crack under various applied potentials. Fig. 10(a) shows the pH in the crack under various potentials and the cyclic loading, which shows that the crack tip pH values under various potentials are acidic and increase with decreasing cathodic potential. In Fig. 10(b), the crack tip pH was measured once the crack tip reached the hole in front of the pre-made crack in Fig. 1(b). At this point, the cyclic loading stopped and the constant stress was applied. It can be seen that the crack tip pH gradually increased under all potentials, and the higher the negative potential is, the faster the increase of pH. It even became alkaline when time is long enough. After 72 h, the constant stress was switched back to the cyclic loading, and the crack tip pH started to decrease for all potentials, as shown in Fig. 10(b). This phenomenon indicates that the stress and strain states influence the crack tip pH value.
Fig. 10.
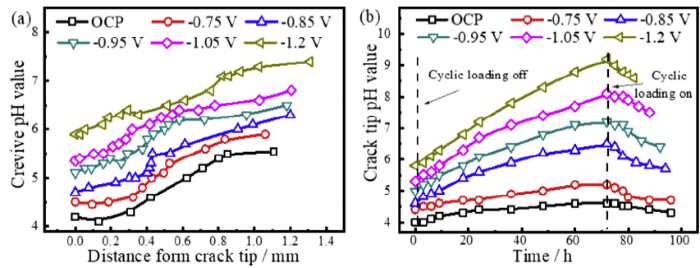
Fig. 10.
Environment within the crack at various potentials: (a) pH value depending on the distance from the crack tip under cyclic loading, (b) crack tip pH value as a function of time with and without cyclic loading.
3.4. Hydrogen content in E690 steel
The hydrogen content in E690 steel was measured in 3.5 wt% NaCl solution with various pH and potentials, with the results shown in Fig. 11. With the increase of pH, the hydrogen content decreases rapidly from approximate 2.2 ppm at pH 4.0 to 1.3 at pH 5.0 and continues the trend in Fig. 11(a), which indicates that the reduction reaction rate of H+ decreases. When the negative applied potential increases, the hydrogen content gradually increases. The hydrogen content reaches 6.5 ppm at -1.2 V. It suggests the positive effect of cathodic potential on hydrogen evolution reaction.
Fig. 11.

Fig. 11.
Hydrogen content of E690 steel in 3.5 wt.% NaCl solution with various (a) pH and (b) cathodic potentials.
4. Discussion
4.1. The electrochemical behaviour within the crack tip at cathodic potentials
Previous studies [12] have noted that the dissolved oxygen concentration in the crack was close to zero, which is impacted by geometrical factors. The main reactions at the crack tip can be summarised as follows:
where the generated Fe2+ will further participate in the hydrolysis reaction, which can be expressed as follows:
Subsequently, the decomposition of Fe(OH)2 will occur:
During the crack growth of E690 steel at the OCP, the concentration of stresses and strains at the crack tip will accelerate the electrochemical reaction, leading to the acceleration of the anodic reaction (Eqs (2) and (3)) and the higher concentration of Fe2+ at the crack tip. The H+ generates from the anodic reaction and the further hydrolysis reaction of Fe2+ accumulate at the crack tip, resulting in a low pH value (Fig. 9). The deformation decreases accordingly as the distance from the crack tip increases, which reduces the anodic reaction. Moreover, the consumption of the generated Fe2+ and H+ in the reactions of Eqs. (4) and (5) and their diffusion to the outside of the crack will decrease the concentrations of Fe2+ and H+. Therefore, the pH value in the crack increases with the distance from the crack tip in Fig. 9(a). The generated Fe(OH)2 and its decomposition products (Fig. 6) accumulate and form the blocks within the crack, resulting in a relatively obstructed region. Due to the abundance of Fe2+ and H+ at the crack tip, a large amount of Cl- outside the crack is driven into the crack to ensure the electric neutrality of the electrolyte within the crack [7,14]. The concentration of Cl- inside the crack decreases with increasing distance from the crack tip in Fig. 9(b).
As the cathodic potentials were applied, the pH (Fig. 10) and the corrosion product composition inside the crack (Fig. 6) of E690 steel in artificial seawater were significantly altered. Fig. 12 outlines the reaction and ion migration to demonstrate the combined effect of cathodic potential and cyclic loading. From the analysis above, as the crack expands, the anodic reaction of metal under the OCP brings many anions (Cl-, SO42-) into the crack to ensure the electric neutrality of the electrolyte within the crack (Fig. 6, Fig. 9). As the negative applied potential increases, AD reaction in Eqs (2) and (3) at the crack tip is restrained [22], and the correlative reactions in Eqs (5), (6), (7) are also inhibited. This phenomenon inhibits the formation of corrosion products, resulting in a decrease of the O content in corrosion products from the OCP to -0.85 V (Fig. 6). Furthermore, as negative cathodic potential increases, the inhibition of the AD reaction and the generation of Fe2+ leads to an increase of pH in the crack (Fig. 10), which further limits the transport of anions into the crack (Fig. 6).
Fig. 12.
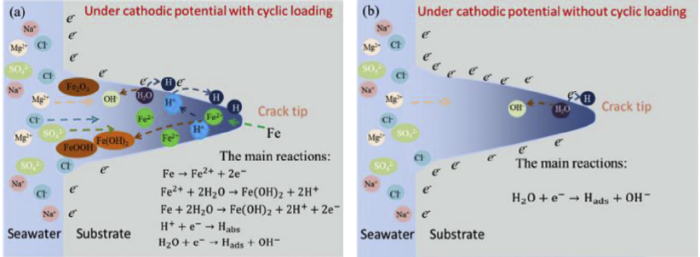
Fig. 12.
Schematic illustrations of the electrochemical reactions at the crack tip under cathodic potential: (a) with and (b) without cyclic loading.
With negative cathodic potential further increases, the corrosion products are primarily influenced by the reduction reaction of H2O, which can be expressed as follows [19]:
With the generation of OH-, the pH within the crack increases and even becomes alkaline in Fig. 10(a). Due to the increase of the OH content within the crack, Mg2+ and Na+ diffuse into the crack to ensure the electric neutrality of the electrolyte. The increase of the negative applied potential increases the contents of Na and Mg in the corrosion film. Additionally, compared with Na+, Mg2+ has more valence electrons and a smaller ionic radius, and thus has a higher driving force and lower resistance in the diffusion of ions into the crack. As a result, the Mg content in the corrosion film is higher than the Na content (Fig. 6). Due to the increase of the OH-concentration, the content of O obviously increases as well at -1.05 V (Fig. 6).
During the crack propagation in E690 steel under cathodic potentials, the electrolyte acidification occurs at the crack tip in Fig. 10(a), which indicates that the AD reaction of Fe (Eqs (2) and (3)) still happens inside the crack under the cyclic loading and cathodic potentials. As the distance from the crack tip increases, the pH in the crack increases and even becomes alkaline, as shown in Fig. 10(a), indicating that the reduction reaction of H2O occurs on the crack wall. Fig. 12(a) shows that the AD reaction mainly occurs at the crack tip, and the reduction reaction of H2O occurs on the crack wall under cathodic potential. The reason for this phenomenon is that the stress-strain in the cyclic loading process facilitates the electrochemical reaction. Fig. 10(b) shows that the crack tip pH gradually increases under various potentials without cyclic loading, which indicates that the AD reaction is restrained and that the reduction reaction of H2O occurs at the crack tip, as listed in Fig. 12(b). It confirms that the acidification at the crack tip is caused by the stress-strain during crack growth.
4.2. Mechanism and process of crack growth
According to the analysis above, electrochemical corrosion occurs at the crack tip of E690 steel under cyclic loading in artificial seawater. Fig. 2 demonstrates that the artificial seawater assists the crack growth under cyclic loading. A classic model was proposed to illustrate the environmentally assisted crack growth under cyclic loading [31]:
where (da/dt)CF represents the total CGR in artificial seawater, which is treated as the algebraic sum of the CGR caused by pure fatigue in an inert environment (da/dt)F and SCC in the identical aggressive environment (da/dt)SCC. As previous studies concluded, the SCC behaviour is mainly controlled by AD and HE mechanisms [22,30]. Thus, (da/dt)SCC can be further proposed herein as follows:
where (da/dt)AD and (da/dt)HE represent the rate of crack growth in AD and HE, respectively. Note that (da/dt)AD can be calculated with the following formula:
where A represents the molar mass of the metal, i is the corrosion current density, and 〉 is the density of the metal.
Parkins [6] and Liu et al. [23] noted that the fresh metal was exposed at the crack tip during the SCC process, and the nonstationary electrochemical reaction occurred at the crack tip. The nonstationary electrochemical behaviour can be reflected by the electrochemical polarisation curve with a fast scanning rate. Fig. 13(a) shows a comparison of the electrochemical polarisation curves with fast and slow scanning rates in the oxygen-free simulated solution of 4.0 mol/L NaCl with pH = 4.0. It can be seen that the corrosion current density with the fast scanning rate (ifcorr) is higher than that with the slow scanning rate (icorr). And, Eq. (11) can be expressed as:
where A is 55.85 g/mol, z is 2 (according to Eqs. (3) and (4)), 〉 is 7.85 g/cm3, and ifcorr is 1.875⋅10-4 A/cm2, which was acquired by Tafel fitting, (da/dt)AD can be calculated to be 6.935⋅10-8 mm/s. The CGR in air is used to represent (da/dt)F, as shown in Fig. 4, the value of which is 7.01⋅10-7 mm/s. Using Eqs. (9), (10), (11), (12),(da/dt)HE can be calculated to be 5.52⋅10-6 mm/s. A comparison of the CGR with different crack growth factors is given in Fig. 13(b). It is obvious that (da/dt)HE is highest comparing with the other crack growth factors and is almost close to the total CGR, which indicates that HE is the main factor in SCC during the crack growth of E690 steel in artificial seawater.
Fig. 13.
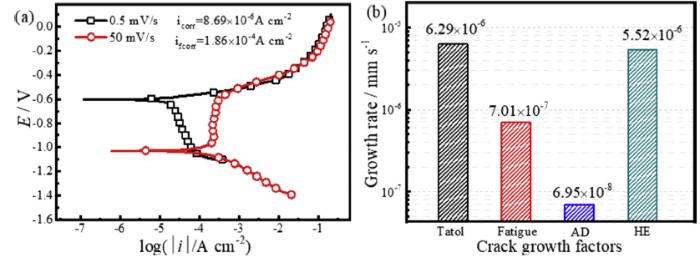
Fig. 13.
(a) Polarisation curves of E690 steel in simulated solution at slow and fast scanning rates and (b) the contribution of crack growth factors to the CGR.
Previous studies have shown that the HE behaviour was related to the accumulation of H and dislocations, especially at the crack tip [32,33]. In the crack growth process, the accumulation of the dislocations caused by corrosion and cyclic loading, as shown in Figs 6, 10 and 11, will reduce the critical fracture stress intensity factor [11,34,35]. The generated H absorbs on the surface of the cracks and then penetrates into the metal. The accumulation of the dislocations facilitates the H trapping, thus increases the concentration of H around the crack. In the crack growth process, a high stress-strain concentration forms around the crack tip, resulting in the dislocations accumulation, which promotes H trapping, and leads to an increase of the H content [36]. The dislocations caused by plastic deformation can irreversibly trap H, and the dynamic strain will accelerate the penetration and transportation of H [37], which cause the H concentration around the crack tip, thus increase the HE susceptibility [16,22], and result in a decrease in the stress corrosion cracking intensity factor (KSCC). Here, only if Kmax> KSCC will the crack propagate to a brittle rupture. The crack growth will not cease until Kmax< KSCC. Thus, the crack growth is not continuous in some short time frames. As seen in Fig. 3, the cleavage fracture surfaces have staircase-like morphology divided by the tearing ridges. Combining with our previous study [21], it can be concluded that the CGR is controlled by the decreasing rate of KSCC.
4.3. Effect of cathodic potential on crack growth behaviour
As analysis above, the rupture occurs in a brief period of time in the crack growth process. Hence, the CGR is controlled by the rate of accumulation of dislocations and H to the state of Kmax> KSCC at the crack tip. Due to the same cyclic loading factor in the process, the dislocations concentration around the crack tip can be considered as nearly consistent [4,5]. Thus, the crack growth is mainly influenced by the content of H affected by various applied potentials.
Fig. 14 illustrates the electrochemical behaviour at the crack tip and crack growth behaviour of E690 steel under various potentials. At OCP, the oxidation reaction of Fe and hydrolysis reaction of Fe2+ generate H+ (Eqs (2) and (5-7)). In Fig. 14(a), as the negative applied potential increases, the oxidation reaction of Fe (Eqs (2) and (3)) is inhibited [22], resulting in a decrease in the concentration of generated H+, which further inhibits the reduction of H+. At the same time, the increase of the negative cathodic potential will enhance the reduction reaction of H2O. The more negative the applied potential, the more content of H from the reduction reaction of H2O, as shown in Fig. 11.
Fig. 14.
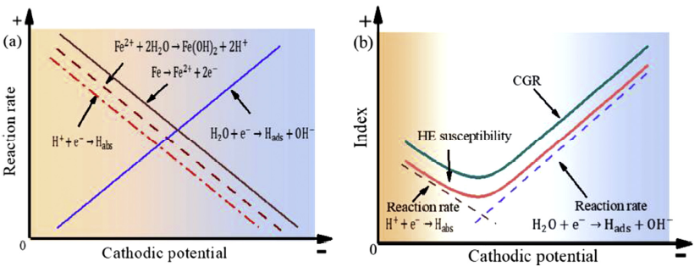
Fig. 14.
Schematic diagrams of (a) the electrochemical reaction that occurred at the crack tip and (b) the relationship between CGR and the reaction at various potentials.
With the negatively shift of cathodic potential from OCP to -0.75 V, the decrease of the concentration of H+ inhibits the oxidation reaction of Fe at crack tip, resulting in the decrease of the concentration of H, as shown in Fig. 11(a). Because of the linear relationship between hydrogen content and HE susceptibility [38], the decline in the concentration of H decreases the HE susceptibility, which further reduces the CGR, as shown in Fig. 14(b). With the further increase of negative cathodic potential from -0.75 V to -1.2 V, the augmentation of the reduction reaction of H2O increases the concentration of H in Fig. 11(b), resulting in an increase of HE susceptibility. Combine Fig. 15 (a) and (b), the hydrogen content tends to reach the minimum value at -0.75 V, which results in the lowest HE susceptibility [38]. In Fig. 9(b), the fracture surface exhibits many tear ridges, which demonstrates the low HE susceptibility at -0.75 V. As the analysis above, the SCC behaviour at crack tip is controlled by HE mechanism, and CGR is related to SCC behaviour at crack tip. Thus, with the increase of negative cathodic potential, the CGR first decreases and then increases, and the lowest CGR occurs at -0.75 V (Fig. 5). It can be concluded that the variation of electrochemical reactions at crack tip, which is impacted by cathodic potentials and cyclic loading, influence hydrogen content and HE susceptibility, resulting in varies crack growth behaviours. When the applied potential decreases to -0.75 V, AD at crack tip is inhibited, resulting in the increase of the crack tip pH and the decreases of the HE susceptibility, thereby reducing the CGR; when the applied potential is under -0.75 V, the negative shift of potential enhances the reduction reaction of H2O, increases the HE susceptibility, and further accelerates the CGR.
5. Conclusions
(1) The combined effect of cyclic loading and applied potentials influence the micro liquid environment and electrochemical reaction at crack tip, which affect the hydrogen content and HE susceptibility, and further impact the crack growth behaviour of E690 steel in artificial seawater.
(2) The acidification and the concentration of Cl- occur at the crack tip during the crack growth process of E690 steel. At cathodic potentials, the crack tip pH value still exhibits acidification under cyclic loading, reflecting the occurrence of AD, which is related to the dynamic strain at the crack tip.
(3) The SCC behaviour at crack tip promotes the crack growth of E690 steel in artificial seawater under cyclic loading. This process is mainly controlled by the HE mechanism. And, the crack growth path mainly exhibits transgranular fracture.
(4) As negative cathodic potential increases, the hydrogen evolution reaction occurs and the anodic dissolution is inhibited within the crack. And the combined effect of the reactions results in the first decrease and then increase of hydrogen content in E690 steel, which influences HE susceptibility and CGR. In this study, as negative cathodic potential increases, CGR first decreases and then increases, with a minimum rate at -0.75 V.
Acknowledgments
This work was financially supported by the Open Fund of Shandong Key Laboratory of Corrosion Science (No. KLCS201909) and the National Natural Science Foundation of China (Nos. 51771028, 51871024 and 51601182).
Reference
DOI URL PMID [Cited within: 1]

 WeChat