

1. Introduction
Conventional corrosion-resistant alloys, e.g., stainless steels extensively, which are used in nuclear-power industry and offshore platform facilities [[1], [2], [3]], can suffer from localized corrosion and thus premature failure [[4], [5], [6], [7], [8], [9], [10]]. The microstructures of the alloy and compositions of the passive film are the key factors influencing pitting corrosion [[11], [12], [13], [14], [15]]. High-entropy alloys (HEAs) tend to form disordered solid solutions rather than intermetallic compounds due to their high mixing entropy [16,17], which can be beneficial to the uniform distribution of various elements in the alloys, and it is worth exploring whether the characterization affects their corrosion resistance. Recently, the corrosion behavior of several types of HEAs with different components in various aqueous environments has been reported. Chen et al. [18] revealed that the Cu0.5NiAlCoCrFeSi HEA is more resistant to uniform corrosion than 304SS in H2SO4 solutions. However, this HEA is relatively vulnerable to pitting corrosion in a solution containing Cl-. Similarly, the corrosion resistance and the properties of passive films formed on 304 l SS and FeCoCrNiMn HEA in a 0.1 M H2SO4 solution were compared by Luo et al. [19]. They showed that the passive film formed on the HEA is enriched in Mn and Fe but depleted in Cr, which provides reasonable explanation for lower corrosion resistance of HEA than that of 304 l SS. Yet, FeCoCrNiCux (x = 0, 0.5, 1) HEAs exhibit high corrosion rate in a 3.5 % NaCl solution [20]. The corrosion resistance of these HEAs decreases with the increase of Cu content due to the galvanic effect of Cu segregation between the dendrite and interdendrite, which results in preferential attacks along the Cu-rich interdendrite [20]. Differently, excellent corrosion resistance in simulated acidic and marine environments was obtained in Co1.5CrFeNi1.5Ti0.5Mox (x = 0, 0.1, 0.5, 0.8) HEAs, showing that the addition of Mo can increase the pitting resistance in the NaCl solution [21]. Meanwhile, the corrosion resistance of the CoCrFeNiW1-xMox (x = 0, 0.5) high-entropy coatings in 3.5 % NaCl solution is remarkably enhanced by Mo addition [22]. Actually, the effect of Mo on the corrosion resistance of traditional alloys, e.g., stainless steels has been thoroughly investigated and many mechanisms have been proposed [[23], [24], [25], [26], [27], [28], [29]]. It is generally believed that the addition of Mo can improve the stability and repassivation abilities of the passive films in Cl- containing corrosive media [25,26,28]. However, Sigma (σ), Chi (χ) or Laves precipitates can be caused by the excessive Mo [30,31], which impairs corrosion resistance [[32], [33], [34]]. Therefore, it is extremely important to determine the range of Mo content for the single phase high-entropy alloys regarding the corrosion resistance.
Besides, the mechanical properties of Mo alloyed FeCoCrNi high entropy alloys and deformation mechanisms were investigated and the addition of Mo greatly enhances the strength of FeCoCrNi alloys by solid-solution hardening and precipitate strengthening [[35], [36], [37], [38], [39], [40]]. However, as an important performance indicator, the corrosion behavior of the (FeCoCrNi)-Mo system is rarely studied. Shang et al. [41] revealed the beneficial effects of Mo and the detrimental effect of σ-phase on the corrosion resistance of the CoCrFeNiMox in NaCl and H2SO4 solution. The correlation between microstructure and corrosion behavior and the corresponding corrosion mechanism should be further investigated.
Motivated by the above considerations, the corrosion behavior and mechanisms of casting FeCoCrNiMox high-entropy alloys in NaCl solutions were investigated by combining electrochemical and immersion tests. The microstructure revolution and elements distribution were observed by scanning electron microscopy (SEM) and electron probe microanalysis (EPMA). The phases and the compositions of the passive films were studied by X-ray diffraction (XRD) and X-ray photoelectron spectroscopy (XPS), respectively. This work aims to gain a further understanding about the effect of molybdenum on the microstructure and corrosion behavior of FeCoCrNiMox alloys, in order to provide basis for the development of highly corrosion resistant HEAs.
2. Experimental procedures
2.1. Sample preparation
The chemical compositions (wt%) of the FeCoCrNiMox (x = 0, 0.1, 0.3, 0.6) alloys are listed in Table 1. For convenience, they were referred as Mo0, Mo0.1, Mo0.3, and Mo0.6. Commercial pure Fe, Cr, Ni, Co, and Mo metals with purities up to 99.99 % were fabricated by arc melting under a high-purity argon atmosphere, and the ingots were melted five times to guarantee the compositional homogeneity. Finally, alloys were cast with dimensions of 10 mm × 10 mm × 60 mm by being poured into a water-cooled copper crucible. The alloys were cut into 10 mm × 10 mm × 3 mm specimens for different tests. The specimens were cold-mounted in epoxy with a 1 cm2 working area exposed to the solution for the electrochemical tests. Then, the samples were ground sequentially from 400 to 2000 grit SiC papers and polished with 1 μm diamond polishing paste. Then, the specimens were cleaned using alcohol and dried in cold air for SEM, XPS and immersion test.
Table 1 Chemical compositions of as-cast FeCoCrNiMox alloys (wt%).
| Alloy | Fe | Co | Ni | Cr | Mo |
|---|---|---|---|---|---|
| Mo0 | 24.77 | 26.14 | 26.03 | 23.06 | - |
| Mo0.1 | 23.76 | 25.07 | 24.97 | 22.12 | 4.08 |
| Mo0.3 | 21.97 | 23.18 | 23.08 | 20.45 | 11.32 |
| Mo0.6 | 19.74 | 20.82 | 20.74 | 18.37 | 20.33 |
2.2. Microstructural analysis
The microstructure was characterized by combining secondary electron imaging (SEI) and energy-dispersive X-ray spectroscopy (EDX) using SEM (Quanta 250). The samples for microstructural analysis were prepared with metallographic etching and electrochemical polishing, respectively. A mixture of 30 ml glycerol+10 ml HNO3 + 30 ml HCl was prepared for the metallographic etching. Electrochemical polishing was conducted in an HClO4:C2H6O = 1:9 solution at room temperature for 20 s and the value of imposed direct voltage is 30 V. XRD analysis was conducted with the X-ray equipment Rigaku S2 (Tokyo, Japan) with Cu-Kα radiation. The range of the diffraction angles (2θ) was from 10° to 100° with a step size of 0.02°. TEM sample was prepared by ion-beam thinning and TEM investigations were taken using JEOL JEM-2100 Apparatus at accelerating voltage of 200 kV.
2.3. Electrochemical measurements
Electrochemical measurements were carried out on a VersaSTAT 3 F workstation with a three-electrode cell and a saturated calomel electrode (SCE) as the reference. The auxiliary electrode was a Pt sheet, and the working electrode was the FeCoCrNiMox alloys. The electrolyte in the experiment was a NaCl solution with different concentrations (0.25 M and 1 M). Prior to the electrochemical test, the specimen was cathodically polarized at -1.3 VSCE for 300 s to remove the air-formed oxide film, and then the open circuit potential (OCP) was recorded for 5000 s to yield the steady-state potential. Potentiodynamic polarization curves were measured from -0.25 V vs. OCP to the final potential corresponding to the current density of 1 mA/cm2 at a scan rate of 0.5 mV/s. In addition, galvanostatic polarization tests in 1 M NaCl solution were carried out after reaching a steady-state potential to evaluate the anodic dissolution behavior of different alloys. The current density imposed on the alloys was 1 mA/cm2, and the polarization time was 600 s and 1800s.
2.4. Analysis of the passive film
To explain the performance difference, the compositions of the passive films formed on Mo0.1 and Mo0 alloys were investigated. The stable passive films were obtained by potentiostatic polarization in a 1 M NaCl solution at 0 VSCE for 4 h. The compositions of these films were measured by XPS (ESCALAB 250xi, Thermo Fisher) with an AlKα X-ray source (hv=1486.6 eV) operated at 150 W. All the peaks obtained by XPS analysis were calibrated using the standard peak (C 1s, 284.8 eV) and fitted with Xpspeak version 4.1 using Shirley background subtraction. Meanwhile, the depth profiles of the passive films formed on Mo0 and Mo0.1 alloys were measured by using a scanning Auger microprobe (PHI-700, ULVAC-PHI). Auger spectra were operated at 5 keV and the scanning rate, determined by a thermal oxide SiO2 /Si as the standard sample, was 2 nm/min.
2.5. Immersion test
The immersion tests of different alloys containing Mo were carried out at 60 °C for 36 h and 120 h in 6 wt% FeCl3 + 0.05 M HCl solution, respectively. The selection of the solution referred to the standard GB/T 17897-1999 (or ASTM G48) [[42], [43], [44], [45]], which was herein introduced to accelerate localized corrosion and reveal the corrosion behavior and corrosion resistance of the FeCoCrNiMox alloys. To avoid crevice corrosion, the specimens with 10 mm × 10 mm × 3 mm were sealed with silicone rubber leaving one side exposed to the solution after being polished.
2.6. Surface morphology characterization
The corrosion morphologies after immersion test and anodic dissolution morphologies after the galvanostatic polarization tests were characterized by SEM and laser confocal microscopy (LCM) (Keyence VK-X250). The 3D images of dissolution morphologies were obtained via a motorized Z-axis stage. To detect elements segregation and to determine the corrosion mechanism, the distributions of Cr and Mo elements were mapped using EPMA (JXA-8230, JEOL), operated at 20 kV and the diameter of the probe is 6 μm.
3. Results
3.1. Microstructure and phase compositions
XRD patterns of all the FeCoCrNiMox HEAs are shown in Fig. 1. The Mo0 and Mo0.1 alloys are the single face-centered cubic (FCC) phase, which is attributed to the high mixing entropy. However, with the increase of Mo content, the second phase appears in the Mo0.3 and increased in Mo0.6 alloys, which is verified to be the CrFe2.32MoNi phase, and also a few FeCo phases can be recognized.
Fig. 1.
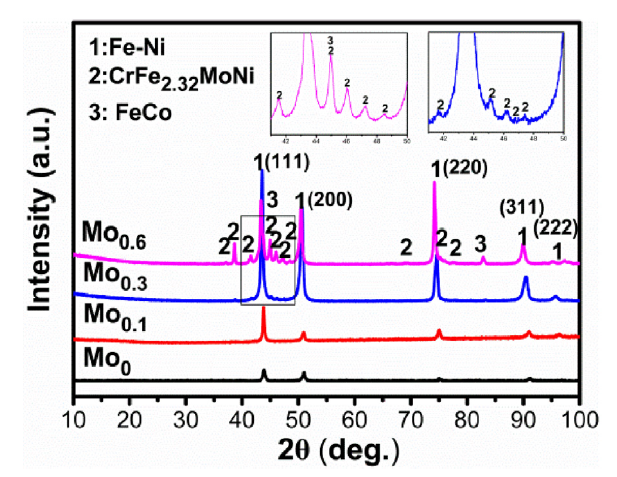
Fig. 1.
XRD patterns of FeCoCrNiMox HEAs with different Mo contents.
Fig. 2 shows the microstructures of Mo0, Mo0.1, Mo0.3, and Mo0.6 alloys after metallographic etching (a-d) and electrochemical polishing (e-h), respectively. As shown in Fig. 2(a-d), columnar grains are observed in the Mo0 alloy and the alloys containing Mo display a typical dendrite structure in the as-cast state. Combined Fig. 2(e-h) with the XRD results, a single phase formed in the Mo0 and Mo0.1 alloys. While the strip-shaped second phase clearly precipitated in the interdendrite (ID) region of the Mo0.3 and Mo0.6 alloys. The eutectic structure consisting of precipitates and matrix appeared in the Mo0.6 alloy. The chemical compositions of the marked regions in Fig. 2(b, c, h) are listed in Table 2, which reveals that the interdendrite region contains higher content of Mo and Cr than the dendrite (DR) region. Taking into consideration of the microstructures of Mo0 and Mo0.1, Mo0 alloy is more homogeneous than Mo0.1 alloy despite of element segregation. In addition to larger atom size of Mo possessing, FeCoCrNi itself owns higher solid solubility because of multi-principal elements. Therefore the microstructure is affected greatly even though a small amount of Mo is added. According to the data in Table 2, the second phase is enriched in Mo and Cr. Moreover, the volume fraction of the precipitates increases with the increasing of Mo content, accordant with the XRD results.
Fig. 2.
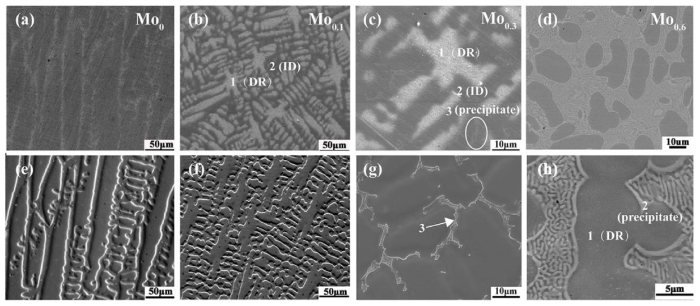
Fig. 2.
Microstructures of the FeCoCrNiMox alloys in different statuses: (a-d) SEM microstructure of the alloys after metallographic etching; (e-h) SEM microstructure of the alloys after electrochemical polishing. (a, e) Mo0, (b, f) Mo0.1, (c, g) Mo0.3 and (d, h) Mo0.6.
Table 2
Chemical composition analysis of the regions marked in
| Alloy | Structure and phase | Fe | Co | Ni | Cr | Mo |
|---|---|---|---|---|---|---|
| Mo0.1 | Dendrite, 1 | 24.27 | 25.52 | 24.94 | 21.23 | 4.04 |
| Inter-dendrite, 2 | 22.89 | 23.90 | 24.32 | 23.07 | 5.82 | |
| Mo0.3 | Dendrite, 1 | 22.51 | 24.44 | 24.07 | 19.95 | 9.03 |
| Inter-dendrite, 2 | 21.54 | 21.96 | 22.30 | 21.23 | 12.97 | |
| Second phase, 3 | 17.51 | 19.01 | 17.48 | 22.05 | 23.95 | |
| Mo0.6 | Dendrite, 1 | 22.03 | 22.69 | 22.78 | 18.61 | 13.89 |
| Second phase, 2 | 18.43 | 19.78 | 17.21 | 19.91 | 24.67 |
In order to meticulously distinguish the precipitate, the matrix and precipitates in Mo0.6 alloy were examined by selected-area diffraction (SEAD) patterns, as shown in Fig. 3. Fig. 3(a) clearly shows lamellar eutectic structure consisting of matrix and precipitates. Moreover the matrix and precipitate are FCC and (Cr, Mo)-rich σ phase [39,46], respectively, revealed by the SEAD patterns shown in Fig. 3(b, c). The tendency to form a second phase in FCC alloys was evaluated according to the equivalent chromium content (ECC) equation [12]:
Fig. 3.
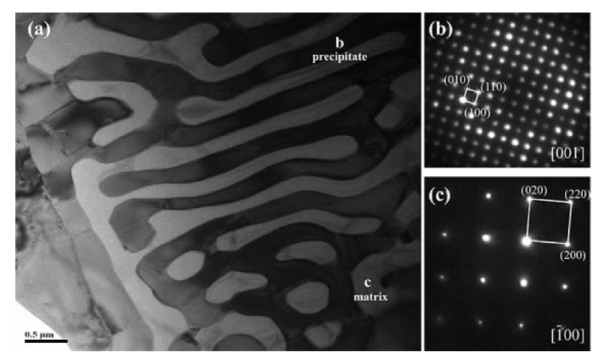
Fig. 3.
TEM image and SEAD patterns of the as-cast Mo0.6 alloy.
3.2. Potentiodynamic curves
Fig. 4 shows the potentiodynamic polarization curves of the FeCoCrNiMox alloys in 0.25 M and 1 M NaCl solutions (pH 6.6) tested at ambient temperature. In Fig. 4, the alloys exhibit typical passive behavior in the NaCl solutions with a wide passive region and low passive current density, indicating high corrosion resistance of the alloys. Notably, Mo0 alloy shows high corrosion resistance as Mo0.1 alloy in 0.25 M NaCl solution, even superior to the Mo0.3 and Mo0.6 alloys with more Mo while suffers from pitting at 0.2 VSCE in 1 M NaCl solution. In contrast, the alloys with Mo remain high resistance to pitting corrosion in 1 M NaCl solution. The results indicate that the addition of Mo significantly enhances the corrosion resistance of the alloys in Cl- concentrated environment. Besides, the addition of Mo enhances the stability of the passive film formed on Mo0.1 alloy compared to Mo0 alloy. The current density of Mo0.1 alloy in the range of 0.8-1 VSCE is smaller than that of Mo0 alloy in 0.25 M NaCl as clearly shown in the inserted graph in Fig. 4(a). The decrease of current density at about 0.8 VSCE is probably due to the adsorption of the molybdate or chromate, which enhances the deactivation of the active sites according to many literature [[47], [48], [49], [50]]. The action was strengthened by the addition of Mo.
Fig. 4.
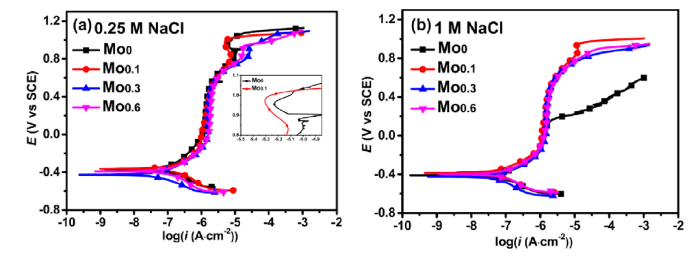
Fig. 4.
Potentiodynamic polarization curves of the alloys with various Mo contents: (a) 0.25 M NaCl solution, (b) 1 M NaCl solution.
It can also observed that the dissolution rate of Mo0.3 and Mo0.6 alloys is higher than that of the Mo0.1 alloy at above 0.8 mVSCE, and oxygen evolution occurs above 1.08 mVSCE according to the Ee-pH diagram [34,51]. The high dissolution rate can be associated with the Cr, Mo-depletion regions caused by precipitates enriched in Cr and Mo in the Mo0.3 and Mo0.6 alloys [34,52].
3.3. Corrosion morphology and anodic dissolution morphology
Fig. 5 shows the corrosion morphologies of Mo0‒Mo0.6 alloys after immersion in 6 wt% FeCl3 + 0.05 M HCl solution at 60 °C for 36 h and 120 h, respectively to survey the corrosion behavior of different alloys. In Fig. 5(a), Mo0 alloy is severely corroded even not in its integrity, as a result of surface spalling. The localized corrosion went in the pits layer by layer and many pits traces left on the surface. Therefore, it is inferred that the passive film cannot provide enough protection for the Mo0 alloy in 6 wt% FeCl3 + 0.05 M HCl solution at 60 °C. During the immersion process, the localized corrosion originates from pitting and eventually develops into active corrosion. Compared to Mo0 alloy, the typical pits were distributed on the Mo0.1 alloy shown in Fig. 5(b), caused by the breakdown of the passive film at these sites. Moreover, the pitting sites possess common feature revealed by the bottom morphology of the pits where several regions overlap, i.e., crystallographic pits, shown clearly in the inserted graph. Actually, the susceptible sites are indeed associated with the distribution of microstructure and elements, which was analyzed in the anodic dissolution morphology and EPMA mapping. Therefore, we can conclude that a small amount of Mo addition can greatly improve the protective effect of passive film formed on Mo0.1 alloy compared to that on Mo alloy. Different from Mo0 and Mo0.1 alloys, due to the formation of the precipitates, the regions surrounding the precipitates and the Cr- and Mo-depleted matrix are subject to corrosion in the Mo0.3 and Mo0.6 alloys, respectively as seen in Fig. 5(c-f). Also, few pits still exist in Mo0.3 alloy. Since the matrix regions of Mo0.6 alloy are corroded preferentially, there is a height difference between the matrix and the eutectic regions as directed by the arrows shown in Fig. 5(f), which can be further verified by anodic dissolution morphology (Fig. 6(b4, c4)).
Fig. 5.
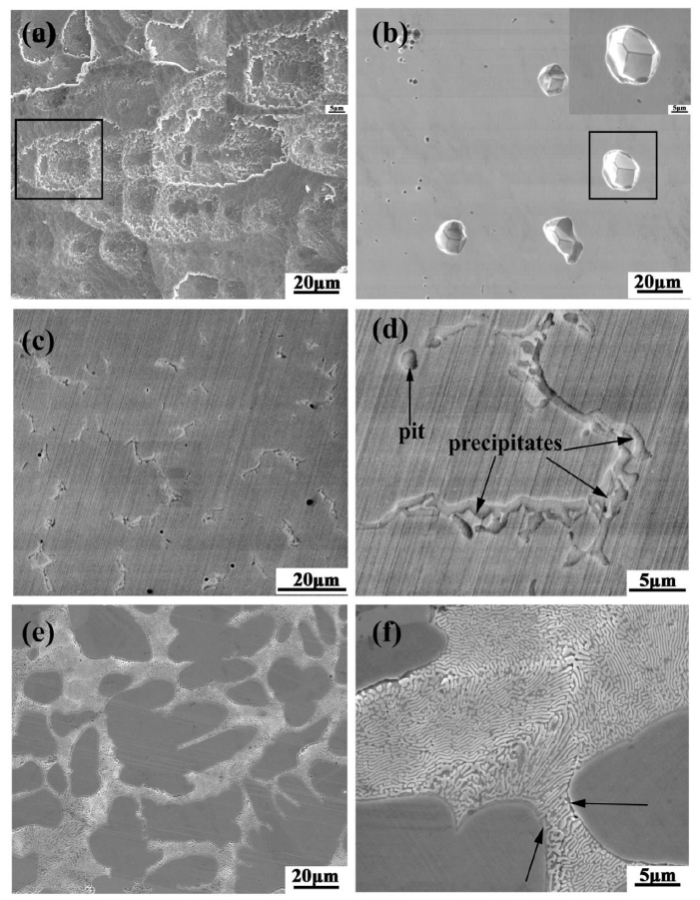
Fig. 5.
Corrosion morphology of Mo0 and Mo0.1‒Mo0.6 alloys after immersion in 6 wt% FeCl3 + 0.05 M HCl solution at 60 °C for 36 h and 120 h, respectively: (a) Mo0 alloy after immersion for 36 h, (b) Mo0.1 alloy after immersion for 120 h, (c, d) Mo0.3 alloy after immersion for 120 h, (e, f) Mo0.6 alloy after immersion for 120 h.
Fig. 6.
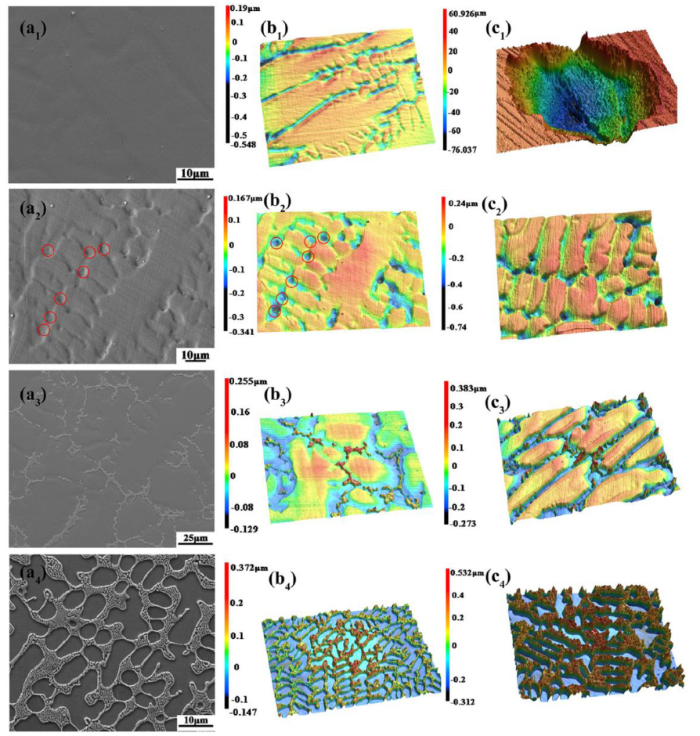
Fig. 6.
SEM and 3D images of the anodic dissolution morphologies of the FeCoCrNiMox alloy after polarization tests in 1 M NaCl at ambient temperature, (a1‒c1) Mo0 alloy (a2‒c2) Mo0.1 alloy, (a3‒c3) Mo0.3 alloy, (a4‒c4) Mo0.6 alloy. (a1‒a4) and (b1‒b4) SEM images and 3D morphologies after polarization for 600 s; (c1‒c4) 3D morphologies after polarization for 1800s.
For revealing the microstructure effect on pit initiation sites, galvanostatic polarization tests were carried out by imposing a current density of 1 mA/cm2 (the corresponding potential is about 0.92 VSCE) for 600 s and 1800s in 1 M NaCl solution at ambient temperature. Fig. 6(a1‒a4) and Fig. 6(b1‒b4) show SEM and 3D images of the anodic dissolution morphologies after polarization for 600 s. Fig. 6(c1‒c4) shows 3D images after polarization for 1800s. In Fig. 6(a1‒c1) and Fig. 6(a2‒c2), anodic dissolutions in the pits and the boundaries along the microstructure were confirmed on the Mo0 and Mo0.1 alloys; no obvious pits were observed on the surface of the Mo0 alloy after polarization for 600 s. With the polarization time increasing to 1800s, fewer but much larger and deeper pits formed on the Mo0 alloy, as shown in Fig. 6(c1). Contrastively, Mo0.1 alloy always remains good resistance to anodic dissolution whatever the polarization time is. Similar to the bottom morphology of pits shown in Fig. 5(b), the pits on the Mo0.1 generated by anodic dissolution were located in the crystallographic sites. As expected, the anodic dissolution morphologies of Mo0.3 and Mo0.6 alloys were in accordance with the corrosion morphologies shown in Fig. 5(c-f), which can be visually observed in the 3D images in Fig. 6(b3, c3, b4, and c4). Besides, the dissolution depth increases with increasing Mo in Mo0.1‒Mo0.6 alloys; however, the differences between the alloys with Mo are much smaller than those between them and the one without Mo.
3.4. EPMA results
The anodic dissolution morphologies are strongly associated with the microstructure and elements distribution, as shown in Fig. 6; therefore, EPMA was applied to map Cr and Mo elements in the alloys. The anodic dissolved layer was completely removed out by polishing before EPMA tests. The results are shown in Fig. 7. As shown in Fig. 7(a1), Cr segregates slightly in the Mo0 alloy, which may result in the anodic dissolution shown in the Fig. 6(b1). However, the pits are not related to elemental distribution in the Mo0 alloy. Fig. 7(a2) shows the EPMA results of the Mo0.1 alloy and the EPMA region is the same with that in Fig. 6(a2, b2). The extent of Cr and Mo micro-segregation are heavier especially Mo. Notably, Mo and Cr were enriched in the susceptible sites where anodic dissolution occurred. The results suggest that the passive film on the sites enriched in Cr and Mo is less stable than those on the other regions; thus the sites are sensitive to aggressive ions. It is generally accepted that Mo and Cr are beneficial for corrosion resistance of the passive film [24,53]. Unexpectedly, in the case, Cr and Mo cluster impairs it. We suggest that the compositions of passive film may be affected and the related investigation is going on.
Fig. 7.
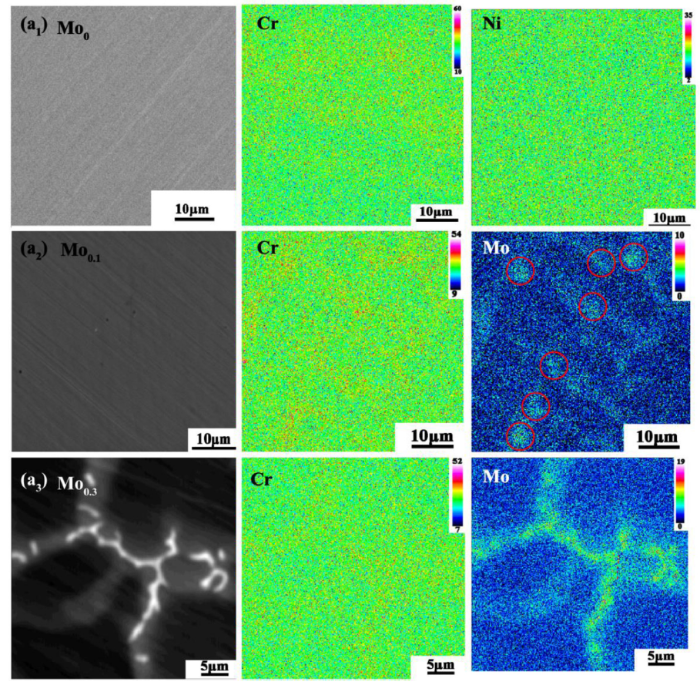
Fig. 7.
EPMA mapping of the elements in the Mo0, Mo0.1 and Mo0.3 alloys after polishing away the anodic dissolution layer: (a1) Mo0 alloy, (a2) Mo0.1 alloy, (a3) Mo0.3 alloy.
For Mo0.3 alloy, the formation of the second phases enriched in Mo and Cr results in the formation of Cr- and Mo-depleted regions around the precipitates, as shown in Fig. 7(a3). In other words, elemental transition areas exist between the second phases and the matrix. Also, the elemental distribution in Mo0.6 alloy should be similar to that in Mo0.3 alloy, that is, the matrix is depleted in Cr and Mo while the precipitates are enriched in Cr and Mo. The regions depleted in Cr and Mo in Mo0.3 and Mo0.6 alloys are corroded or dissolved preferentially.
3.5. Characteristics of the passive films formed on Mo0 and Mo0.1 alloys
As discussed above, the resistance to preferential localized corrosion of Mo0.3 and Mo0.6 alloys is strongly associated with the susceptible regions depleted in Cr and Mo elements. Contrastively, the pitting resistance of Mo0 and Mo0.1 with single phase depends on the protective ability of the passive film. The passive film was formed on the Mo0 and Mo0.1 alloys after passivation at 0 VSCE for 4 h in the 1 M NaCl solution. The current density rapidly decays during the formation of passive films, and the low quasi-steady passive current densities were obtained as shown in Fig. 8, indicating the stable passive film forming on Mo0 and Mo0.1 alloys. The compositions of the passive film were analyzed by XPS. The atomic compositions of Fe, Co, Cr, Ni and Mo elements in the passive films are listed in Table 3. Fig. 9 presents the XPS results of the Fe 2p3/2 [19,24,54,55], Cr 2p3/2 [19,24,[56], [57], [58]], Ni 2p3/2 [6,19], Co 2p3/2 [59], O 1s [6,19,24,54] and Mo 3d [57,60,61]. The binding energies and contents of the main components extracted from XPS analysis are listed in Table 4. For both of the alloys, Fe hydroxides and Cr oxides/hydroxides are the primary components of the passive films, with small amounts of Co/Ni oxides and hydroxides as well as Fe oxide. Additionally, Mo species are present in the passive film on the Mo0.1 alloy. Among these, chromium oxide, more stable and compact than Cr(OH)3 with more combined water [62], is the key component in the passive film and has a decisive effect on the corrosion resistance of the alloys [63]. The content ratio of Cr2O3/Cr(OH)3 in the passive film formed on the Mo0.1 alloy is approximately 1.5 times than that of the passive film formed on the Mo0 alloy. It is mainly attributed to the addition of Mo promotes the deprotonation of Cr(OH)3, and thus more Cr2O3 forms in the passive film on Mo0.1 alloy [29,64]. Besides, the appearance of molybdenum oxide also accounts for the high pitting resistance in the Mo0.1 alloy. Normally, the molybdenum oxide species mainly MoO42- in the passive film formed in the medium with neutral or high pH adsorb on the surface of the alloy, which can inhibit the electrochemical attack as a barrier film [29,50,51,[64], [65], [66]]. The protective ability of the passive film formed on Mo0.1 alloy is thus improved by the beneficial effects of Mo element.
Fig. 8.

Fig. 8.
Current density varies during the formation of passive films at 0 VSCE in deaerated 1 M NaCl solution.
Table 3 Atomic compositions of Fe, Co, Cr, Ni and Mo elements in the passive films (at.%).
| Alloys | Fe | Co | Cr | Ni | Mo |
|---|---|---|---|---|---|
| Mo0 | 23.95 | 15.73 | 42.35 | 17.97 | |
| Mo0.1 | 29.32 | 14.86 | 37.68 | 14.21 | 3.93 |
Fig. 9.
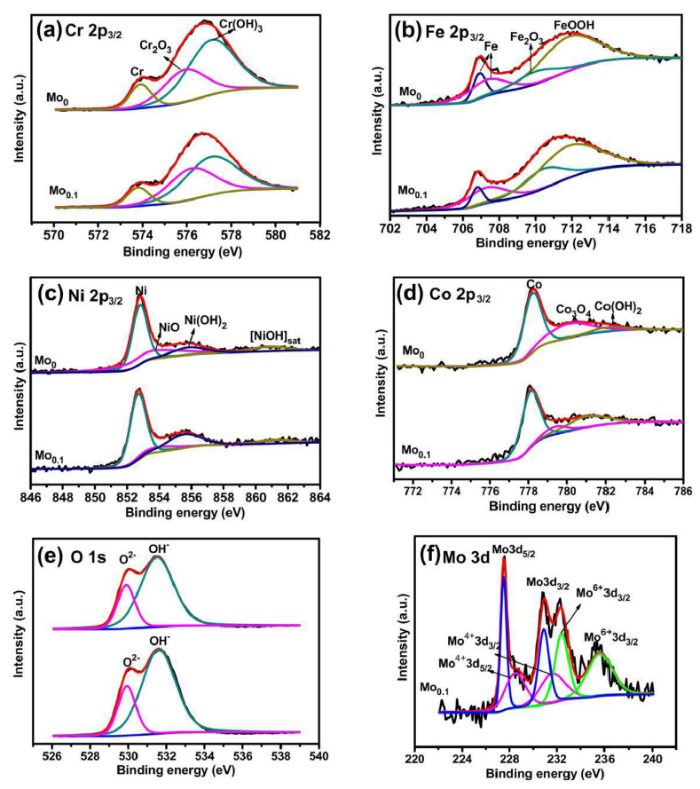
Fig. 9.
XPS spectra of the passive film formed on the Mo0 and Mo0.1 alloys: (a) Cr 2p3/2, (b) Fe 2p3/2, (c) Ni 2p3/2, (d) Co 2p3/2, (e) O 1s and (f) Mo 3d peaks in Mo0.1 alloy.
Table 4 Binding energies and contents of the main components extracted from XPS analysis.
| Elements | Compounds | Binding Energy (eV) Mo0 alloy/Mo0.1 alloy | Mo0 alloy (%) | Mo0.1 alloy (%) |
|---|---|---|---|---|
| Fe 2p3/2 | Fe2O3 | 710.4 / 710.4 | 5.17 | 9.42 |
| FeOOH | 711.8 / 711.8 | 19.85 | 23.19 | |
| Cr 2p3/2 | Cr2O3 | 575.9 / 576.2 | 18.67 | 20.25 |
| Cr(OH)3 | 577.1 / 577.1 | 35.97 | 28.33 | |
| Ni 2p3/2 | NiO | 853.5 / 853.9 | 7.32 | 1.50 |
| Ni(OH)2 | 855.8 / 855.5 | 3.61 | 5.30 | |
| Co 2p3/2 | Co3O4 | 780.1 / 779.4 | 7.78 | 2.36 |
| Co(OH)2 | 782.1 / 781.0 | 1.63 | 5.80 | |
| Mo 3d | Mo4+ 3d3/2 | 231.6 | — | 3.85 |
| Mo4+ 3d5/2 | 228.5 | — | ||
| Mo6+ 3d3/2 | 235.6 | — | ||
| Mo6+ 3d5/2 | 232.4 | — |
To investigate the thickness of the passive films, the Auger electron spectroscopy (AES) depth profiles were carried out, and the results are displayed in Fig. 10. In Fig. 10, the thicknesses of the passive film formed on the Mo0 and Mo0.1 alloys are approximately 3-3.5 nm and 3.5-4 nm by taking the half of the O content as a reference [67]. The addition of Mo may slightly thicken the passive film [65,66]. Thus, according to the XPS and AES results, Mo improves the protective ability of FeCoCrNi alloys with Mo in high aggressive Cl- environment by modifying the compositions and thickness of the passive film.
Fig. 10.
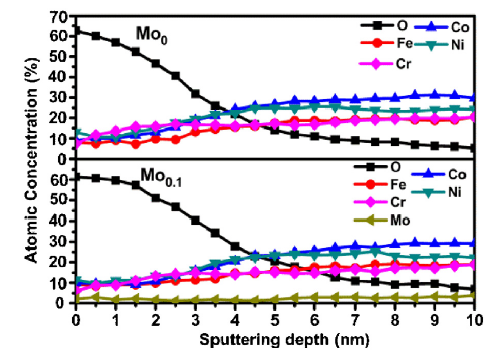
Fig. 10.
AES sputtering depth profiles of the alloy elements in the passive film formed on Mo0 and Mo0.1 alloys.
3.6. SKPFM results
The Volta potential value of the precipitate is higher than that of the nearby regions revealed by scanning Kevin probe force microscopy (SKPFM) in Fig. 11. Generally, there is a linear correlation between Volta potential in air and the corrosion potential of the metal in electrolyte [68]. The Volta potential can be used to evaluate the relative nobility of phases in metal, which essentially determines the roles of different phases. A higher potential can be interpreted as higher nobility [69]. The observation is in line with the results shown in Fig. 5, Fig. 6, supporting the notion that the formation of the precipitates influences the corrosion behavior and corrosion resistance of the alloys containing Mo.
Fig. 11.
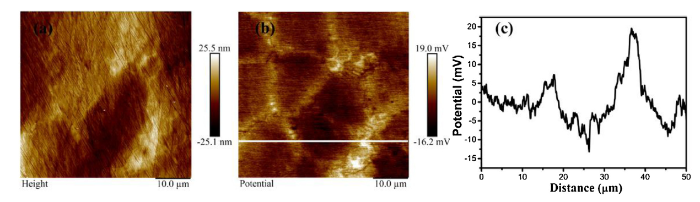
Fig. 11.
Topographical and Volta potential mappings of the Mo0.3 alloy and line-scan section analysis results obtained from the SKPFM analysis. (a) Topographical mappings (b) Volta potential mappings (c) line-scan section analysis obtained from
4. Discussion
The corrosion resistance of the alloys depends on the protective ability of passive film or the microstructure [70]. Through combining the polarization curves (Fig. 4), immersion results (Fig. 5), anodic dissolution morphology (Fig. 6) and XPS results (Fig. 9), it is seen that the passive film formed on Mo0 alloy is strong enough to withstand weak corrosive medium or slight external polarization such as 0.25 M NaCl solution or galvanostatic polarization for 600 s. However, the corrosion (or dissolution) rate is very fast once the passive film is destroyed, which is actively corroded (Fig. 5) in 6 wt% FeCl3 + 0.05 M HCl medium and the size and depth of pits are very large after polarization for 1800s. Mo has its significant value in harsh environments. Likewise, Mo0.1 alloy still remains good resistance to pitting or dissolution in the strong aggressive medium or external condition. It should be attributed to the higher Cr2O3/Cr(OH)3 ratio and the incorporation of molybdenum oxides in the passive film formed on Mo0.1 alloy, which strengthens protection of passive film against chloride attack.
However, the corrosion resistance of Mo0.3 and Mo0.6 alloys depends on the weak sites caused by the precipitates enriched in Cr and Mo. The regions around the precipitates in Mo0.3 alloy and the matrix in Mo0.6 alloy are depleted in Mo and Cr, which results in the electrochemical activation in these sites. Therefore, the electrochemical attack is determined by the regions depleted in Cr and Mo acting as initiation sites in Mo0.3 alloy and Mo0.6 alloy [[71], [72], [73]]. Also, the corrosion behavior of FeCoCrNiMox alloys is thus altered by the precipitation with high Volta potential. Pitting occurs in the Mo0 and Mo0.1 alloys with single phase yet preferential localized corrosion occurs in the Mo0.3 and Mo0.6 alloys shown in Fig. 5.
5. Conclusions
Based on the combined information obtained from the SEM, integrated potentiodynamic, the immersion tests and LCM, as well as XPS measurement and EPMA analysis, the corrosion behavior and corrosion mechanism of FeCoCrNiMox HEAs in a sodium chloride solution were investigated, and the main conclusions can be described as follows:
(1) Mo0 and Mo0.1 alloys are single FCC solid solution. Precipitates enriched in Cr and Mo form in the Mo0.3 alloy, and a two-phase structure forms in the Mo0.6 alloy consisting of precipitates with larger volume fractions and matrix depleted in Cr and Mo.
(2) Pitting corrosion occurs on Mo0 and Mo0.1 alloys with single phase while FeCoCrNiMo0.3 and FeCoCrNiMo0.6 alloys suffer from preferential localized corrosion at the regions depleted in Cr and Mo.
(3) The addition of Mo enhances the Cr2O3/Cr(OH)3 ratio and Mo oxides are incorporated into the passive film, which significantly improve the corrosion resistance compared to the Mo0 alloy.
Acknowledgments
This work was financially supported by the National Material Environmental Corrosion infrastructure and the State Key Laboratory for Advanced Metals and Materials (No. 2018Z-05). The authors also thank Fan Zhang, Ph.D. student, from the State Key Laboratory for Advanced Metals and Materials for his assistance with the material preparation.
Reference

 WeChat