Search for articles:
Bianca Lucas-Granados
Corresponding authors:
Received: 2019-05-2
Revised: 2019-06-18
Accepted: 2019-07-5
Online: 2020-02-01
Copyright: 2020 Editorial board of Journal of Materials Science & Technology Copyright reserved, Editorial board of Journal of Materials Science & Technology
More
Abstract
Iron oxide nanostructures are promising materials to be used as photocatalysts in different photoelectrochemical applications. There are different techniques in order to synthesize these nanostructures, but one of the most inexpensive and simple method is electrochemical anodization. This method can lead to different nanostructures by controlling its parameters. Anodization time is one of the most critical parameters since it considerably affects the properties of the obtained nanostructures. In this work, different anodization times (5, 10, 15, 30 and 60 min) were studied. The resulting nanotubes were characterized by field emission scanning electron microscopy, Raman laser confocal microscopy, water splitting measurements, Mott-Schottky analysis and electrochemical impedance spectroscopy, in order to test their viability for being used as photocatalysts in photoelectrochemical applications. Results showed that the best photocurrent density values in water splitting tests (0.263 mA m-2) were achieved for the sample anodized for 10 min under hydrodynamic conditions.
Keywords:
Energy demand in the entire world is increasing continuously due to modern life and electrical necessities [1,2]. Most of this electrical demand is supplied by fossil fuels, which are responsible for environmental deterioration. One of the alternatives that are taking advantage is the use of renewable energy sources since they are environmentally friendly. In particular, among all the available clean energies, hydrogen as an energy vector obtained by renewable solar energy is presented as one of the best options as an alternative to fossil fuels [[1], [2], [3], [4], [5], [6], [7]]. Hydrogen has high energy efficiency [8] and could satisfy the mounting energy demand [[9], [10], [11]]. Solar-driven water splitting via photoelectrochemical processes is one of the technologies used to obtain hydrogen from water leading to a clean process without toxic emissions [[12], [13], [14]]. In this way, one of the scientific challenges in the field of energy is to obtain a suitable photocatalyst for the solar-driven water splitting [[15], [16], [17], [18]]. Different metal oxides are being studied as photoanodes for this purpose [1,4,17,[19], [20], [21], [22], [23]]. Among them, iron oxide, in particular in its hematite form, is one of the most promising materials due to its properties. First, iron is one of the most common materials of the world and hematite is its most thermodynamically stable oxide, then it is a low cost material. Furthermore, hematite is non-toxic, environmentally friendly and it has a band gap of 2.1 eV for solar energy harvesting. This means that its theoretical solar-to-energy (STH) efficiency is around 15%. Despite this, hematite has some drawbacks such as poor carrier mobility and short hole diffusion lengths that need to be overcome [18,[24], [25], [26], [27], [28], [29]]. One of the ways to avoid these drawbacks is by nanostructuring the material [17,30,31]. Nanomaterials can be obtained by different methods, such as electrochemical anodization, which is a simple, low cost and easily controllable process [[32], [33], [34], [35]]. The control of the anodization process is related to the control of its parameters. Anodization time is a key parameter in the process since it determines the morphological and photoelectrochemical properties of the obtained nanomaterials. In this work, electrochemical anodization time is studied in order to analyze its influence in the formation of hematite nanostructures for being applied as photocatalyst in water splitting. Times of 5, 10, 15, 30 and 60 min were studied and the synthesized nanostructures were characterized by structural methods: field emission scanning electron microscopy (FE-SEM) and laser confocal microscopy with Raman spectroscopy, and by means of electrochemical and photoelectrochemical methods: density current versus potential measurements (water splitting tests) and Mott-Schottky analysis.
Iron rods (99.9% pure) were used as anodes (with an exposed area of 1.13 cm2) in the electrochemical cell and a platinum tip was used as the counter electrode. Prior to anodization, iron rods were abraded with different SiC papers in order to obtain a mirror finish, and then they were sonicated in ethanol for 2 min, rinsed with distilled water and dried in a N2 stream. For the electrochemical anodization, an ethylene glycol based solution with 3 vol.%. of distilled water and 0.1 M NH4F was used as electrolyte. The process was carried out at 50 V [36] and 25 °C [37], both under static and hydrodynamic conditions (in particular, with a rotation speed of 1000 rpm since it was reported as the best stirring condition for iron anodization [38]). Anodization time was varied from 5 to 60 min in order to study its effect on the nanostructures properties.
During anodization process current density values versus time were registered in order to have information about the nanostructures morphology. Then, the as-synthesized nanostructures were annealed in a tubular furnace at 500 °C for 1 h with a heating rate of 15 °C min-1 and in argon atmosphere [39].
The morphology of the nanostructures was evaluated by field emission scanning electron microscopy with operating extra high tension of 3 keV, and the crystalline structure was checked by means of a laser confocal scanning microscope with Raman spectroscopy with a neon laser of 632 nm at approximately 750 μW.
Electrochemical and photoelectrochemical characterizations were carried out in a three-electrode configuration with KOH 1 M as electrolyte. The iron oxide nanostructure was used as working electrode (0.26 cm2 as exposed area), a Pt tip as counter electrode and an Ag/AgCl electrode as the reference. The electrodes were immersed in the electrolyte and connected to a potentiostat (Autolab). Light conditions were performed using a solar simulator with AM 1.5 illumination (100 mW cm-2). Photocurrent versus applied potential measurements (water splitting) were obtained by chopped light irradiation. Thus, photocurrent density was measured by the potentiostat in a potential range from -0.4 to +0.6 V at a scan rate of 2 mV s-1, being 0.02 V in the dark and 0.02 V in the light. Mott-Schottky analyses were peformed using the same configuration and by sweeping the potential from the open circuit potential (OCP) in the negative direction, with an amplitude signal of 0.01 V at a frecuency value of 5 kHz.
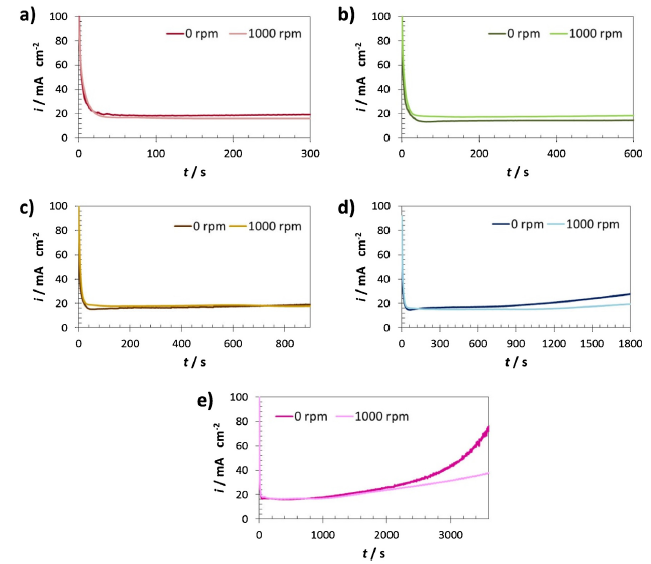
Fig. 1 shows current density versus time registers during anodization at different times. All the registers showed the behavior of tubular nanostructures during the first steps: (i) a pronounced decrease of the current density during the firsts seconds of the process (according to the iron oxide compact layer formation), then (ii) a slight increase of the current density (because of the formation of tiny pits in the compact layer due to the action of both applied potential and fluoride ions of the electrolyte), and finally (iii) the steady state was reached (indicating an equilibrium between formation and dissolution of the compact layer, so the tubular formation stopped) [32,40,41].
Fig. 1. Current density versus time registers of the samples anodized in EG +3 vol.% H2O + 0.1 M NH4F during different times: (a) 5 min; (b) 10 min; (c) 15 min; (d) 30 min; (e) 60 min.
It is noticeable that the current density values reached during the first seconds of anodization were higher for the nanostructures synthesized under hydrodynamic conditions due to the improvement in the diffusion process [42]. Furthermore, equilibrium was maintained for about 15 min, but at longer times the current density increased considerably, which means that the equilibrium was broken. In particular, at times higher than 30 min the current density increasesd abruptly, suggesting that the nanotubular formation was disrupted.
3.2.1. Field emission scanning electron microscopy
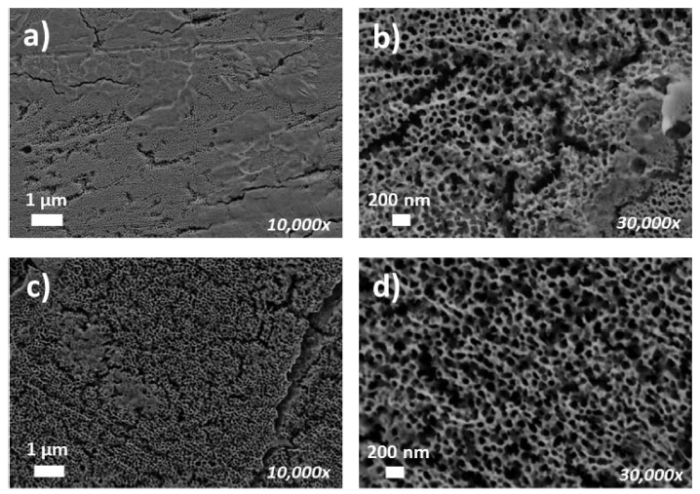
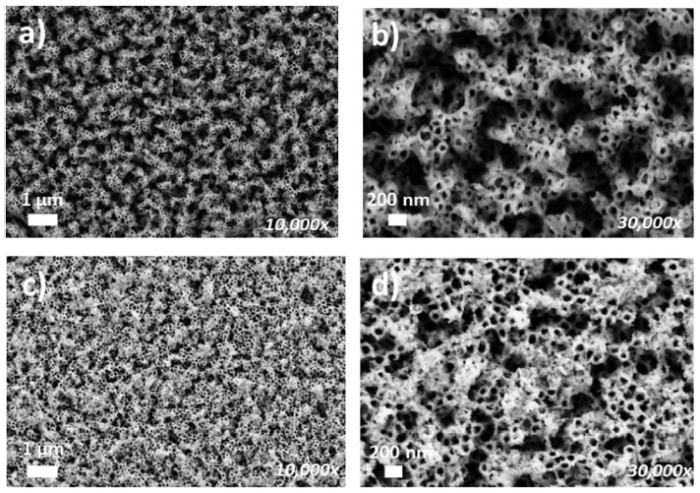
Fig. 2 shows the FE-SEM images obtained for the samples anodized for 5 min. It can be seen that anodizing under static conditions (Fig. 2(a) and (b)) led to a heterogeneous surface of the nanostructure. In particular, there were some areas with a compact porous layer and some others without nanostructures. This is due to the fact that anodizing that time was not enough in order to form well defined nanotubular structures. Furthermore, the process of anodizing led to the formation of bubbles, and if the anodization takes place under static conditions they could cover the surface obstructing the formation of the nanotubes.
Fig. 2. FE-SEM images of the samples anodized for 5 min under static (a, b) and hydrodynamic (c, d) conditions.
The samples anodized under hydrodynamic conditions (Fig. 2(c) and (d)), presented a more homogeneous surface because spinning the electrode during anodization enhanced the diffusion of the fluoride ions, made the process more homogeneous and avoided the formation of bubbles in the surface. However, the compact porous layer also appeared in the surface, but the diameters of the porous compact layer were higher (of the order of 75 ± 12 nm) than in the case of the samples anodized under static conditions (of the order of 51 ± 9 nm), which enhanced the accessibility of light.
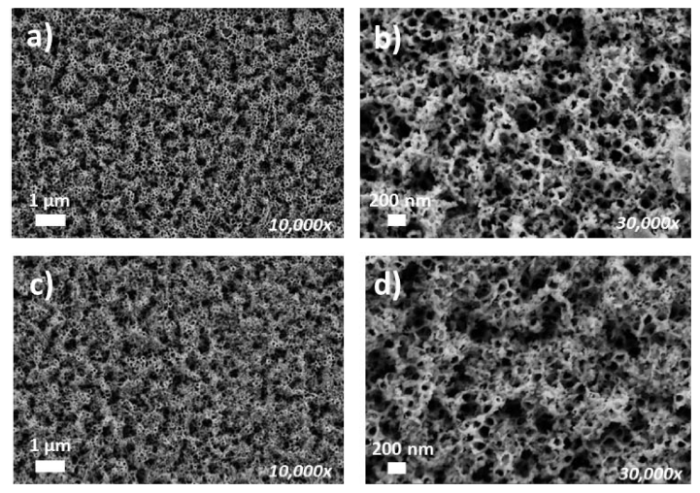
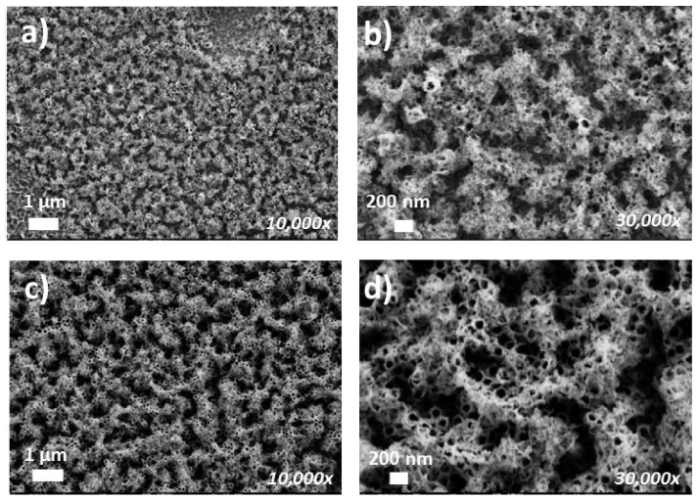
Fig. 3 shows that the samples anodized for 10 min presented nanotubular morphologies without any initiation layer over them. This morphology favored the accessibility of the light inside the tubes and improved the photoelectrochemical behavior of the samples. Moreover, the sample anodized under hydrodynamic conditions was more homogeneous because of the diffusion improvement.
Fig. 3. FE-SEM images of the samples anodized for 10 min under static (a, b) and hydrodynamic (c, d) conditions.
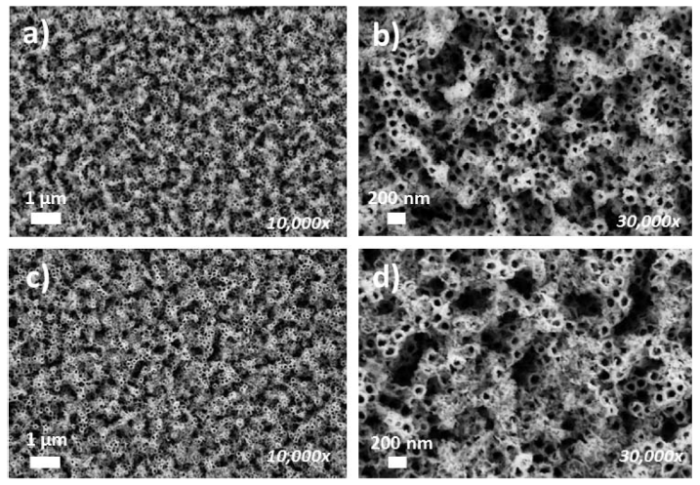
The samples anodized for 15 min (Fig. 4) also presented nanotubular morphologies very similar to the ones anodized for 10 min. Furthermore, hydrodynamic conditions (Fig. 4(c) and (d)) also favored the formation of more homogeneous surfaces in comparison to the ones anodized under static conditions (Fig. 4(a) and (b)).
Fig. 4. FE-SEM images of the samples anodized for 15 min under static (a, b) and hydrodynamic (c, d) conditions.
Fig. 5(a) and (b) shows the morphologies of the samples anodized for 30 min under static conditions, and it is noticed that the nanotubes started to collapse. This is in agreement with i vs. t registers that indicated an equilibrium breakdown at times higher than 15 min. On the other hand, nanostructures that were anodized under hydrodynamic conditions also started to collapse due to the long time, but the surface was more homogeneous.
Fig. 5. FE-SEM images of the samples anodized for 30 min under static (a, b) and hydrodynamic (c, d) conditions.
Finally, Fig. 6 shows the samples anodized for 60 min. On the one hand, samples that were anodized under static conditions (Fig. 6(a) and (b)), presented a collapsed morphology without tubular nanostructures. Only a few tube mouths were present, but the morphology was completely collapsed. This is in agreement with i vs. t registers that showed an abrupt increase in current density, indicating that the equilibrium was broken and then the tubular morphology disappeared. On the other hand, nanostructures anodized under hydrodynamic conditions (Fig. 6(c) and (d)), exhibited a partially collapsed morphology, but part of the nanotubular structure can still be seen. The morphology of samples anodized for 60 min was similar to the ones anodized for 30 min.
Fig. 6. FE-SEM images of the samples anodized for 60 min under static (a, b) and hydrodynamic (c, d) conditions.
Fig. 7 shows FE-SEM cross images of the different nanostructures and Table 1 shows their lengths according to the anodization time. In order to have the cross sections of the nanotubes and measure them, little cuts in zigzag were done with a blade on the surface of the samples.
Fig. 7. FE-SEM cross section images of the samples anodized under static (a, c, e, g, i) and hydrodynamic (b, d, f, h, j) conditions for 5 min (a, b), 10 min (c, d), 15 min (e, f), 30 min (g, h) and 60 min (i, j).
Table 1 Length measurements of the different iron oxide nanostructures synthesized at different anodization times under both static and hydrodynamic conditions.
| Rotation speed/rpm | Anodization time/min | Length/nm |
|---|---|---|
| 0 | 5 | 700 |
| 1000 | 500 | |
| 0 | 10 | 950 |
| 1000 | 900 | |
| 0 | 15 | 800 |
| 1000 | 900 | |
| 0 | 30 | 900 |
| 1000 | 800 | |
| 0 | 60 | 500 |
| 1000 | 900 |
The samples anodized between 10 and 30 min had the same length (∼ 800-950 nm). However, samples anodized for 5 min were shorter because this time was not enough in order to form well defined nanotubes. In particular, when anodization was performed for 5 min and under hydrodynamic conditions the nanostructures only had 500 nm in length.
Samples anodized for 60 min under static conditions had also a length of 500 nm (much shorter than the rest of the samples). In this case, the reason is that 60 min was too much time for the formation of nanotubular structures of iron oxide, and the nanotubes were collapsed. However, when the anodization took place under hydrodynamic conditions, the diffusion of the process was improved and the collapse of the samples was much lower.
3.2.2. Raman spectroscopy
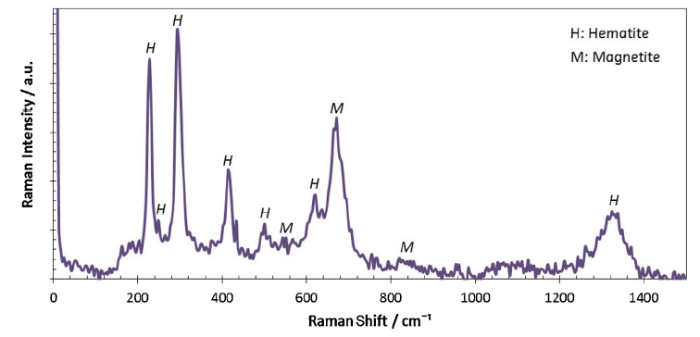
Raman spectroscopy of the samples was performed and all the spectra were very similar with the same Raman peaks. Fig. 8 shows, as an example, the spectrum of one of the samples. Most of the peaks corresponded to the hematite phase, i.e. 229 cm-1 (A1g), 249 cm-1 (Eg), 295 cm-1 (Eg), 414 cm-1 (Eg), 500 cm-1 (A1g), 615 cm-1 (Eg) and 1317 cm-1 (2° order). Additionally, some peaks corresponding to the magnetite phase appeared at 554 cm-1, 672 cm-1, ∼820 cm-1 [[43], [44], [45]]. This means that the samples were composed mainly by hematite with some amount of magnetite.
Fig. 8. Raman spectra of the nanostructure synthesized for 5 min in EG +3 vol%. H2O + 0.1 M NH4F under static conditions.
3.3.1. Photocurrent density versus applied potential measurements
Iron oxide nanotubes can be used as photocatalyst in different photoelectrochemical applications, such as the splitting of the water molecule [25,26,35,46]. In this case, nanostructures were evaluated by registering photocurrent density versus applied potential in order to evaluate their suitability as photocatalysts for water splitting. The reactions occurring in the electrochemical cell during photocurrent density versus applied potential tests were the followings [3,4,47]:
4H+ + 4e- → 2H2 (Reduction reaction occurring in the cathode). (1)
2H2O + 4h+ → 4H+ + O2 (Oxidation reaction occurring in the anode). (2)
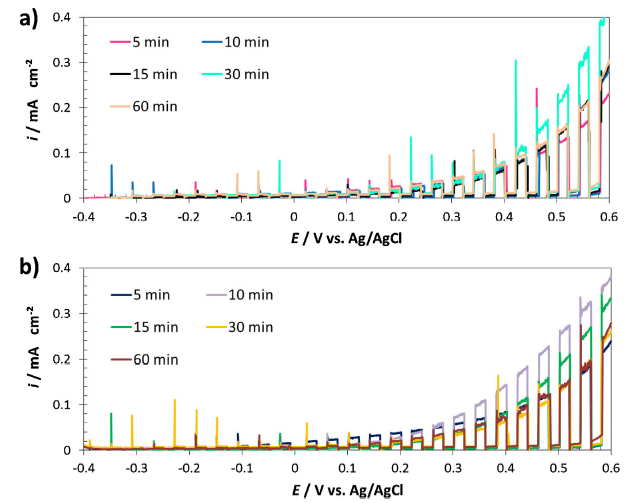
Therefore, the global reaction in the system is: 2H2O → O2 + 2H2. According to these reactions, the photocurrent density values are related to the oxidation reaction occurring in the anode (the nanostructure). Then, the higher the oxidation rate in the anode, the higher the reduction rate in the cathode. Thus, higher values of photocurrent density lead to higher values of hydrogen production. Fig. 9 shows the plots obtained for the different samples.
Fig. 9. Photocurrent density versus applied potential measurements for the samples anodized at different times under static (a) and hydrodynamic conditions (b). Solar simulated light AM 1.5 (100 mW cm-1) was used for light conditions and 1 M KOH as electrolyte.
Samples obtained under hydrodynamic conditions exhibited higher current density values for all the times. Furthermore, Fig. 9(a) indicates that the sample anodized for 30 min reached the highest photocurrent density values under static conditions. However, the dark line (current density without illumination) was slightly higher than those of the other samples. This can be detrimental for the photocatalyst since some reaction is occurring on the surface in the absence of light. On the other hand, when the samples were anodized under hydrodynamic conditions (Fig. 9(b)) the dark lines were lower.
Samples anodized under hydrodynamic conditions reached higher photocurrent density values than the ones anodized for the same time but under static conditions. Table 2 shows the photocurrent density values obtained at 0.5 V (vs. Ag/AgCl) for all the samples.
Table 2 Current density values measured at 0.5 V (vs. Ag/AgCl) for the different synthesized iron oxide nanostructures.
| Rotation speed / rpm | Anodization time/min | i/mA cm-2 |
|---|---|---|
| 0 | 5 | 0.125 |
| 10 | 0.150 | |
| 15 | 0.150 | |
| 30 | 0.238 | |
| 60 | 0.15 | |
| 1000 | 5 | 0.140 |
| 10 | 0.263 | |
| 15 | 0.193 | |
| 30 | 0.140 | |
| 60 | 0.140 |
In particular, the sample that exhibited the highest values of photocurrent density was the one anodized for 10 min under hydrodynamic conditions, achieving 0.263 mA · cm-2 (at 0.5 V vs. Ag/AgCl). These results are of the order of the ones obtained in literature for hematite nanostructures [33,[48], [49], [50]]. This is in agreement with FE-SEM results which indicated that the sample anodized for 10 min under hydrodynamic conditions presented well-defined nanotubes distributed homogeneously throughout the entire surface, leading to higher absorption of sunlight for the generation of electron-hole pairs, better diffusion of the holes to the electrode-electrolyte interface and better electron transport to the metallic substrate [51,52].
3.3.2. Mott-Schottky
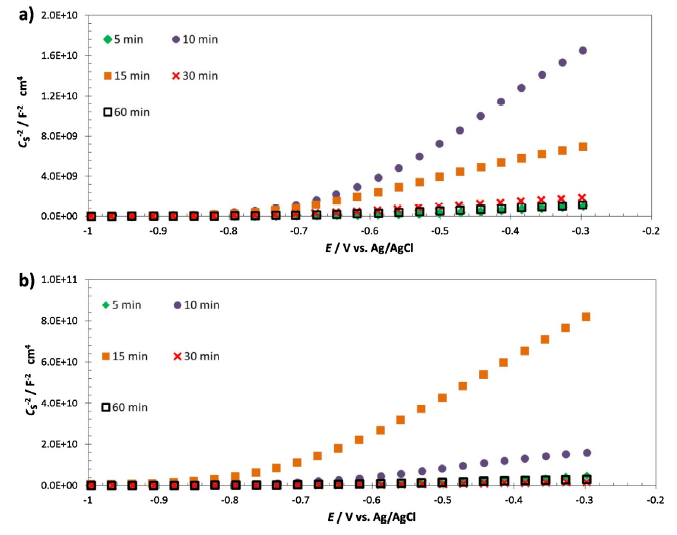
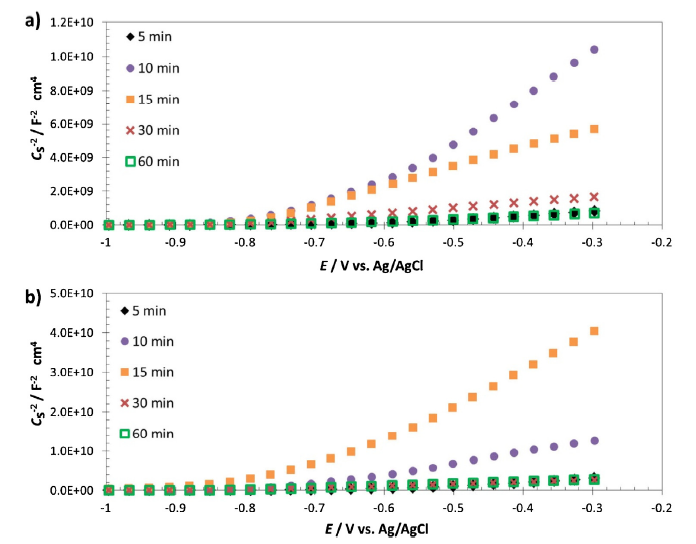
Fig. 10, Fig. 11 show the Mott-Schottky plots under both dark and light conditions, for all the nanotubes synthesized at the different anodization times. Simulated solar light AM 1.5 (100 mW cm-1) was used for the light conditions. On the one hand, all the plots indicated an n-type semiconductor with electrons as majority carriers since the slopes of the straight lines of the plots were positives [34,48]. Moreover, the higher the slopes, the lower the donor density (ND) values.
Fig. 10. Mott-Schottky plots under dark conditions of the samples anodized at different anodization times under static (a) and hydrodynamic (b) conditions.
Fig. 11. Mott-Schottky plots under light conditions of the samples anodized at different anodization times under static (a) and hydrodynamic (b) conditions.
The numerical values of donor density (ND) for each analyzed nanostructure were calculated according to the following equation [[53], [54], [55]]:
ND=$\frac{2}{e⋅ε_0⋅ε_r⋅σ}$, (3)
where e is the electron charge (1.60 × 10⁻¹⁹ C), ԑ0 the vacuum permittivity (8.85 × 10⁻¹⁴ F cm-1), ԑr the dielectric constant (according to literature, 80 is assumed for the hematite [[56], [57], [58]]) and σ is the slope. Furthermore, values of the flat band potential of each sample can also be calculated by extrapolating the straight lines of the plots to the x-axis. Results of both donor density and flat band potential values are shown in Table 3.
Table 3 ND and EFB values of the different synthesized iron oxide nanostructures.
| Anodization time/min | Electrode rotation speed / rpm | Conditions | ND/cm-3 | EFB/V vs. Ag/AgCl |
|---|---|---|---|---|
| 5 | 0 | Dark | 6.45 × 10²⁰ | -0.62 |
| Light | 7.33 × 10²⁰ | -0.62 | ||
| 1000 | Dark | 1.23 × 10²⁰ | -0.59 | |
| Light | 2.05 × 10²⁰ | -0.63 | ||
| 10 | 0 | Dark | 3.93 × 10¹⁹ | -0.66 |
| Light | 7.30 × 10¹⁹ | -0.71 | ||
| 1000 | Dark | 4.24 × 10¹⁹ | -0.70 | |
| Light | 6.28 × 10¹⁹ | -0.75 | ||
| 15 | 0 | Dark | 5.06 × 10¹⁹ | -0.72 |
| Light | 1.52 × 10²⁰ | -0.80 | ||
| 1000 | Dark | 1.02 × 10¹⁹ | -0.75 | |
| Light | 2.21 × 10¹⁹ | -0.77 | ||
| 30 | 0 | Dark | 4.00 × 10²⁰ | -0.72 |
| Light | 5.34 × 10²⁰ | -0.80 | ||
| 1000 | Dark | 3.25 × 10²⁰ | -0.81 | |
| Light | 3.69 × 10²⁰ | -0.82 | ||
| 60 | 0 | Dark | 6.35 × 10²⁰ | -0.69 |
| Light | 1.14 × 10²¹ | -0.73 | ||
| 1000 | Dark | 2.48 × 10²⁰ | -0.72 | |
| Light | 3.20 × 10²⁰ | -0.81 |
It can be noticed that ND values were higher for the measurements performed under light conditions due to the photogenerated electron-hole pairs [34]. Additionally, in general terms, samples synthesized under hydrodynamic conditions presented lower values of ND.
ND values of the samples anodized for 5 min were of the order of 1020 cm-3, which is a very high value. This is due to the fact that this time was not enough in order to form well-ordered nanotubes, and then the surface presented a lot of defects increasing ND. On the other hand, samples anodized for 30 and 60 min also had ND values of the order of 1020 cm-3, but in this case the reason was because this time is too high and the nanostructures started to collapse and to form a heterogeneous surface with a lot of defects. According to literature [38,58,59], values of hematite nanostructures are of the order of 1019 cm-3 since this density of defects improves the electrical conductivity of the nanostructures, which is one of the limitations of hematite [60]. However, too high defects values can be detrimental since they can act as recombination centers decreasing the nanostructures photoelectrochemical behavior [61].
Samples anodized for 10 and 15 min presented ND values of the order of 1019 cm-3, then these samples are more suitable for photoelectrochemical applications. This is in agreement with water splitting results, since the best results were achieved for the samples anodized under hydrodynamic conditions for 10 and 15 min, respectively.
Regarding flat band potential, the values were very similar (between -0.7 and -0.8 V vs. Ag/AgCl) for the samples anodized for 10 min or longer times, which is in agreement with literature [34,62].
In this work, different times during the synthesis of iron oxide nanotubes by electrochemical anodization of iron were studied. In particular, anodization tests for 5, 10, 15, 30 and 60 min were performed and the structural and photoelectrochemical properties of the nanotubes were studied.
Results revealed that anodization time considerably affected the morphology of the obtained nanostructures, obtaining homogeneous surfaces with well-defined nanotubes for 10 and 15 min under hydrodynamic conditions. Moreover the composition of the samples was mainly hematite with some amount of magnetite.
From a photoelectrochemical point of view, the sample that achieved the best results was the one anodized for 10 min under hydrodynamic conditions, since it achieved the highest photocurrent density in water splitting measurements (0.263 mA cm-2 at 0.5 V vs. Ag/AgCl). Mott-Schottky analyses indicated that the donor density of the samples anodized for 10 min was lower than the rest (of the order of 1019), which favored its photoelectrochemical performance.
The authors would like to express their gratitude for the financial support granted to Bianca Lucas Granados by the Ministerio de Economía y Competitividad (Reference: BES-2014-068713 and Project CTQ2016-79203-R), for its help in the Laser Raman Microscope acquisition (UPOV08-3E-012) and for the co-finance by the European Social Fund, and to the UPV for the concession of a post-doctoral grant (PAID-10-17) to Ramón M. Fernández Domene.

 WeChat
/
| 〈 |
|
〉 |
