

Oxidation Behaviors of C-ZrB2-SiC Composite at 2100 °C in Air and O2
Cite this Article
Zhongwei Zhang, Cewen Nan, Jingjun Xu, Zenghua Gao, Meishuan Li, Junshan Wang. Oxidation Behaviors of C-ZrB2-SiC Composite at 2100 °C in Air and O2 . Journal of Materials Science & Technology, 30(12): 1223-1229 
Permissions
Copyright reserved, Editorial board of Journal of Materials Science & Technology
Oxidation Behaviors of C-ZrB2-SiC Composite at 2100 °C in Air and O2
The oxidation behaviors of graphite and ZrB2-SiC modified graphite composite were investigated at 2100 ° C in 1 × 10⁵ Pa air and 0.2 × 10⁵ Pa O2. The oxidation tests were conducted in an induction heating furnace. The oxidation of these two materials followed the linear rate law. The determined radius loss rates of graphite and C-ZrB2-SiC at 2100 ° C were 2.18 × 10⁻² and 1.05 × 10⁻² %/s in 1 × 10⁵ Pa air, and 3.23 × 10⁻² and 2.21 × 10⁻² %/s in 0.2 × 10⁵ Pa O2, respectively. The incorporation of ZrB2 and SiC decreased remarkably the oxidation rate of graphite because the oxide scale formed on the sample surface during oxidation helps in reducing the exposed surface area of the underneath substrate. In two different atmospheres with the same oxygen partial pressure, both graphite and C-ZrB2-SiC experienced more severe oxidation at 2100 ° C in 0.2 × 10⁵ Pa O2 than in 1 × 10⁵ Pa air. The oxidation rate-controlling step for graphite and C-ZrB2-SiC was proposed to be the inward diffusion of oxygen through the boundary layer and through the pores in the oxide scale, respectively. A model based on diffusion theory was established to discuss the effect of the total gas pressure on their oxidation behaviors.
Key words:Graphite-based composite; Ceramic particles; Ultra-high temperature oxidation; Oxide scale; Oxidation mechanism
1. Introduction
High-performance graphite and carbon fiber reinforced carbon composite (C/C composite) have been extensively applied in aviation and aerospace technology due to their ultra-high sublimation temperature, low density and coefficient of thermal expansion (CTE), excellent high temperature mechanical properties such as high specific strength and modulus, and high creep and thermal shock resistance[1]. What is more interesting, the strength of graphite increases with increasing temperature up to 2500 ° C[2]. These extraordinary properties make graphite-based composites especially be applied as high or ultra-high temperature structural materials[3]. However, the graphite matrix experiences severe oxidation in oxidizing environments at temperatures above 500 ° C[4]. At high temperatures, the continuous mass loss takes place during its rapid oxidation, which will eventually cause the significant degradation of their mechanical properties. Then, ceramic particle modified graphite-based composites have been developed to improve the high temperature oxidation resistance of the graphite matrix[5]. Due to the oxidation of these ceramic particles, a superficial oxide scale will form on the surface of graphite-based composites, which can inhibit the inward penetration of oxygen and protect the underneath substrate from further oxidation. Transition metal carbides and borides (such as ZrB2, ZrC, HfB2, HfC, and TaC) are broadly selected as the additives because of their high melting point (above 3000 ° C) and overall thermo-structural stability at high temperatures[6].
Based on the needs of practical applications, the ultra-high temperature oxidation (above 1400 ° C[7]) of the graphite-based composites has been investigated widely[5]. At present, oxyacetylene torch[8] and [9] and electric-arc or plasma wind tunnels[10] are two kinds of the most widely utilized techniques for testing ultra-high temperature ablation. However, there are some drawbacks for these two techniques when they are used to accurately study the oxidation behaviors of materials. Firstly, the environments obtained by these two techniques are complicated: both oxidation and erosion happen simultaneously. Secondly, it is difficult to control the oxygen partial pressure, which is a critical factor affecting the oxidation of materials. And it is also difficult to maintain the temperature accurately due to the temperature fluctuation (normally over 100 ° C[8]) caused by high velocity gas flow. Thirdly, the maximum heated surface area by oxyacetylene torch is normally 8-10 mm in diameter when the temperature reaches 2000 ° C[11]. In this way, it is difficult to characterize precisely the oxidation rate of materials due to the nonuniform distribution of temperature. Recently, an induction heating-based ultra-high temperature oxidation testing method has been developed[12] and [13], which enables extremely rapid heating and accurate control of the testing temperature and atmosphere. Very recently, using this technique, Gao et al.[14] and [15] have investigated the effects of temperature, flow velocity, gas pressure as well as ZrB2 and SiC additions on the oxidation of graphite up to 2000 ° C, respectively. However, little work has been done towards the effect of atmosphere properties on the oxidation behaviors of graphite and its composite materials, and the ultra-high temperature oxidation mechanisms are still not well understood.
In the present work, using the induction heating-based oxidation testing technique[14] and [15], the oxidation behaviors of pure graphite and ZrB2-SiC modified graphite-based composite at 2100 ° C were investigated in different atmospheres, i.e. 1 × 10⁵ Pa air and 0.2 × 10⁵ Pa O2. Oxidation kinetics was characterized by the radius losses of the samples after oxidation. Based on the experimental results and the diffusion theory, a simple model was proposed to discuss the effect of the total gas pressure on the oxidation behaviors.
2. Experimental
2.1. Materials preparation
A graphite-based composite, C-ZrB2-SiC (designated as GZS), were synthesized by hot-pressing. The raw materials, including graphite, ZrB2 and SiC powders, were all about 10 μ m in size and 99% in purity. Prior to hot-pressing, graphite powders were mixed with ZrB2 and SiC powders with a nominal mass ratio of 76:18:6. The powder mixture was milled for 24 h in alcohol by attrition milling with agate media. The volume of the mixed powders was fivefold to that of the milling balls, and the milling speed was 200 r/min. Then, the slurry was dried at 60 ° C for 12 h in an oven. The mixed powders were set in a graphite mold and heated up to 2000 ° C under a pressure of 50 MPa in flowing Ar. At last, the composite were graphitized at 2500 ° C. For comparison, pure graphite (designated as G) was also prepared. The bulk densities of G and GZS are 1.90 and 2.10 g/cm3, respectively. The cylindrical samples with the diameter of 20 mm and the length of 20 mm were cut from the hot-pressed disks using an electro-discharge machining.
2.2. Oxidation test and samples characterization
The static isothermal oxidation tests were carried out in 1 × 10⁵ Pa air and/or 0.2 × 10⁵ Pa pure oxygen at 2100 ° C on an induction-heating-based ultra-high temperature oxidation testing apparatus. This apparatus is mainly composed of three parts: an induction power supply with a copper induction coil, a testing chamber connected to vacuum pumps and gas cylinders, and a two-color pyrometer. During the test, the sample was inductively heated. The surface temperature of the sample and the gas pressure in the testing chamber were controlled by adjusting the output of the power supply and the pumping speed plus the gas volume inlet through the leak valve, respectively. Details of this apparatus and the testing procedure can be found in previous work[12] and [15].
For the characterization of the oxidation kinetics, the radius loss (Δ r) in percentage of cylindrical samples after oxidation for t was determined as follows
equation(1)
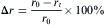

where r0 is the radius of the cylindrical sample before oxidation; rt is the net radius of the as-oxidized cylindrical sample after removing the oxide scale; t is the oxidation time.
The oxidation products of the samples were characterized by X-ray diffraction (XRD, Rigaku D/max-2400, Japan) and X-ray photoelectron spectrometer (XPS, ESCA LAB 250, USA). Prior to XRD and XPS analyses, a part of the oxide scale was stripped off from the as-oxidized sample and ground into fine powders. The surface and cross section morphologies of the as-oxidized samples were observed using a SUPRA 35 scanning electron microscope (SEM, LEO, Germany) equipped with an energy-dispersive spectroscopy system (EDS, INCA, Oxford Instrument, UK).
3. Results
3.1. Oxidation kinetics
 | Fig. 1</label> |
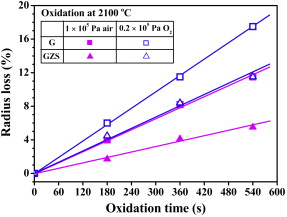
By fitting the experimental results, the radius loss rates of G and GZS at 2100 ° C in air and 0.2 × 10⁵ Pa O2 were obtained and listed in Table 1. It is found that, the radius loss rate of GZS in 1 × 10⁵ Pa air and in 0.2 × 10⁵ Pa O2 is about 52% and 32% lower than that of G, respectively. On the other hand, the oxidation rate of G and GZS in 0.2 × 10⁵ Pa O2 is 48% and 110% higher than that in 1 × 10⁵ Pa air, respectively. Both the addition of ZrB2-SiC and the total gas pressure in the testing chamber have great influences on the oxidation behavior of graphite at 2100 ° C.
| Table 1 Oxidation rates of G and GZS at 2100 _C in 1 _ 105 Pa air and/or 0.2 _ 105 Pa O2 |
Full-size table
3.2. Oxidation products
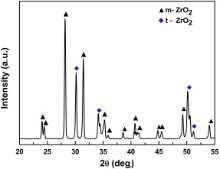
In all cases, white oxide scale can be observed on the surface of the as-oxidized GZS samples. Through XRD analysis, it was found that the oxidation products formed on GZS samples at 2100 ° C in 1 × 10⁵ Pa air and 0.2 × 10⁵ Pa O2 have the same composition. A typical XRD pattern obtained from the GZS sample after oxidation at 2100 ° C in air for 540 s is shown in Fig. 2. Only two crystalline phases, i.e. tetragonal zirconia (t-ZrO2) and monoclinic zirconia (m-ZrO2), have been detected. This result agrees well with that obtained from the described ZrB2 and ZrB2-SiC composites in literature[9] and [16].
 | Fig. 2. XRD pattern of the oxide scale formed on GZS after oxidation at 2100 ° C for 540 s in 1 × 10⁵ Pa air. |
It has been demonstrated that the Si-containing compounds, such as silica and/or borosilicate, have formed and existed as liquid phase in the oxide scale during the oxidation of ZrB2-SiC or C-ZrB2-SiC at about 1900 ° C[10]. In the present work, after the oxidation test at 2100 ° C, the as-oxidized sample was air-quenched to 1000 ° C at a rate of about 800 ° C/min. In such a rapid cooling process, liquid silica and/or borosilicate might have no enough time to crystallize and hence reserve as amorphous phases. In order to identify the existence of amorphous Si-containing compound, the oxide scale formed on the GZS sample after oxidation at 2100 ° C in 1 × 10⁵ Pa air for 540 s has been further characterized by XPS (see Fig. 3). As shown in Fig. 3(a), the survey spectrum presents clearly a Si2p peak, indicating the existence of Si+4 in the oxide scale. The further analysis of this Si2p peak after magnification (Fig. 3(b)) indicates that it is composed of one unique peak with a bonding energy of 103.3 eV, which is very close to the bonding energy of silica (103.6 eV). Therefore, it is certified that silica formed during the oxidation of GZS at 2100 ° C and existed as an amorphous phase after cooling to room temperature. In fact, even under conventional cooling conditions, an outmost glassy silica layer has been always observed on ZrB2-SiC composite surfaces after high temperature oxidation[16].
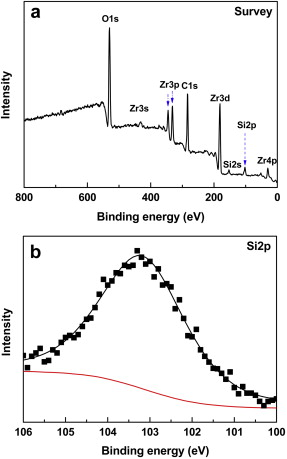 | Fig. 3. XPS spectra of the oxide scale formed on GZS after oxidation at 2100 ° C for 540 s in 1 × 10⁵ Pa air: (a) the entire survey spectrum, (b) the magnified Si 2p peak. |
No B-containing oxide phase has been identified in the oxide scale of the as-oxidized GZS by XRD and XPS. It has been exhibited that the evaporation rate of B2O3 is higher than its formation rate when the temperature is above 1200 ° C[17]. Besides, the vapor pressure of B2O3 at 2000 ° C has already reached as high as about 0.6 × 10⁵ Pa[15]. Therefore, it is deduced that almost all of the B-containing oxides have evaporated during the oxidation at 2100 ° C. Rezaie et al.[18] have investigated the oxidation behaviors of ZrB2-30 vol.% SiC at 1500 ° C under reducing conditions with an oxygen partial pressure of ∼10-10 Pa. By using secondary ion mass spectrometry (SIMS), they have determined that the content of B within the oxide layer formed after oxidation for 30 min is less than 1 wt%.
3.3. Surface and cross section morphologies of oxide scales
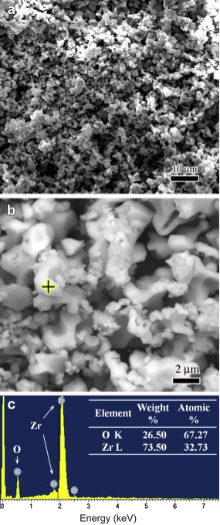
The oxide scales formed on GZS at 2100 ° C in two different gases have a quite similar surface morphology, so only SEM surface images of the oxide scale formed after oxidation in 1 × 10⁵ Pa air for 540 s and the corresponding EDS result are shown in Fig. 4. It can be seen in Fig. 4(a) and (b) that the oxide scale is a porous skeleton constructed by numerous white small but irregularly shaped grains. Combining the XRD and EDS results (see Figs. 2 and 4(c)), it is known that these grains are mainly composed of ZrO2. In addition, a large amount of pores with the size in the range of ∼1-20 μ m are well distributed in the oxide scale.
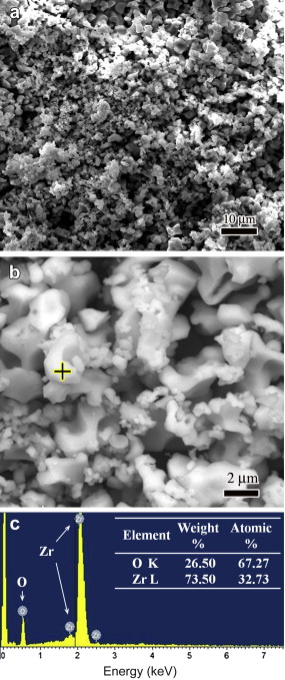 | Fig. 4. (a and b) surface morphologies of the oxide scale formed on GZS after oxidation at 2100 ° C for 540 s in 1 × 10⁵ Pa air, (c) EDS result obtained at the yellow cross in (b). |
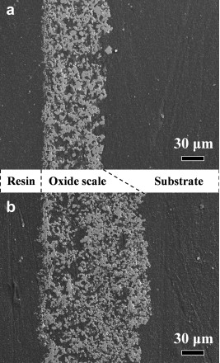
hough the morphology and composition have no significant differences, the oxide scales formed on GZS at 2100 ° C in 0.2 × 10⁵ Pa O2 are much thicker than that formed in 1 × 10⁵ Pa air. Fig. 5(a) and (b) shows the cross section of the oxide scale formed on GZS after oxidation at 2100 ° C for 540 s in 1 × 10⁵ Pa air and in 0.2 × 10⁵ Pa O2, respectively. The thickness of the oxide scale formed in 0.2 × 10⁵ Pa O2 is about 140 μ m, being twice of that formed in 1 × 10⁵ Pa air, which is about 70 μ m. This characteristic correlates well with the corresponding radius loss results (see Fig. 1), indicating that more severe oxidation took place in 0.2 × 10⁵ Pa O2 than in 1 × 10⁵ Pa air.
 | Fig. 5. Cross section morphologies of the oxide scales formed on GZS after oxidation at 2100 ° C for 540 s: (a) in 1 × 10⁵ Pa air, (b) in 0.2 × 10⁵ Pa O2. |
4. Discussion
4.1. Ultra-high temperature oxidation process
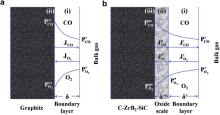
For pure graphite, the carbon atoms react with oxygen to produce volatile CO in the ultra-high temperature oxidizing environment according to Eq. (2)[4] and [14]. No condensed oxide scale is to be formed on the sample surface. Its oxidation at 2100 ° C proceeds generally in two steps (see Fig. 6(a)): (i) oxygen in the bulk gas transfers to the sample surface through a boundary layer, (ii) carbon atoms on the sample surface react with oxygen by Eq. (2)
equation(2)
C(s)+1/2O2(g)→ CO(g)C(s)+1/2O2(g)→ CO(g) 
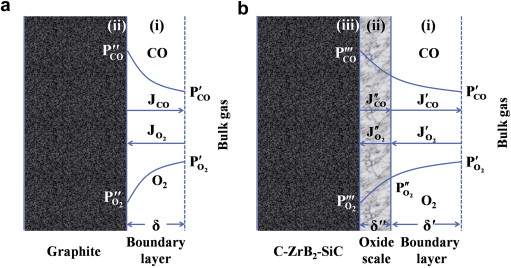 | Fig. 6. Illustration of the oxidation progress of G (a) and GZS (b) at 2100 ° C, showing the inward diffusion of oxygen and the outward diffusion of CO during oxidation. |
For C-ZrB2-SiC composite, besides graphite matrix, the incorporated ZrB2 and SiC particles also react with oxygen by Eqs. (3) and (4), which occur at the oxide scale/substrate interface by the inward diffusion of oxygen[19]
equation(3)
2ZrB(s)+5/2O2(g)→ 2ZrO(s)+B2O3(l)ZrB2(s)+5/2O2(g)→ ZrO2(s)+B2O3(l) 
equation(4)
SiC(s)+3/2O2(g)→ 2SiO(l)+CO(g)SiC(s)+3/2O2(g)→ SiO2(l)+CO(g) 
equation(5)
B2O3(l)→ B2O3(g)B2O3(l)→ B2O3(g) 
equation(6)
2t-ZrO(s)→ 2m-ZrO(s)t-ZrO2(s)→ m-ZrO2(s) 
equation(7)
2SiO(l)→ SiO(g)+1/2O2(g)SiO2(l)→ SiO(g)+1/2O2(g) 
equation(8)
2SiO(l)→ 2SiO(g)SiO2(l)→ SiO2(g) 
Among these oxidation products, gaseous CO is released directly into the external environment. B2O3(l) is prone to evaporate because of its high vapor pressure (Eq. (5)), while ZrO2 has stayed in solid state in the oxide scale due to its higher melting point of 2725 ° C and negligible vapor pressure[15]. Normally, ZrO2 experiences a phase transformation at 1170 ° C (Eq. (6)) between its high temperature tetragonal phase and low temperature monoclinic phase[20]. Therefore, it is supposed that t-ZrO2 should form during oxidation at 2100 ° C but transforms to m-ZrO2 in the cooling process after oxidation. In fact, however, a part of t-ZrO2 is reserved to room temperature (see Fig. 2). On the one hand, the cooling rate after oxidation is so high that the transformation might be partially restricted. On the other hand, very small crystalline ZrO2 grains (see Fig. 4) might form by the oxidation of ZrB2 in the cooling process, which enables t-ZrO2 to remain stable at room temperature[16]. In addition, the residual stress developed due to the mismatch of CTE between the oxide scale and the substrate during cooling may also have a suppression effect on the transformation of t-ZrO2 to m-ZrO2[21]. For SiC particles in the graphite matrix, its active oxidation with the production of SiO and CO gases (Eqs. (4) and (7)) is readily triggered at the oxide scale/substrate interface at 2100 ° C[15]. Meanwhile, the vapor pressure of SiO2 becomes very high, which also causes its continuous loss (Eq. (8)).
Once the oxide scale forms on the surface of GZS, its oxidation at 2100 ° C will proceed by the following three steps (see Fig. 6(b)): (i) oxygen in the bulk gas transfers to the oxide scale surface through a boundary layer, (ii) oxygen penetrates the oxide scale to reach the oxide scale/substrate interface, (iii) the chemical reactions take place at the oxide scale/substrate interface and in the oxide scale according to Eqs. (3), (4), (5), (6), (7) and (8).
4.2. Oxidation rate-controlling step
It is known from the radius loss results in Fig. 1 that the oxidation of both G and GZS at 2100 ° C follows the linear rate law. Their oxidation process involves a number of steps, as illustrated in Fig. 6. Among these steps, the one with the lowest rate will become the oxidation rate-controlling step.
It has been well known that the oxidation of pure graphite at temperatures above 1400 ° C stays in the boundary layer diffusion-controlled regime[14]. Its oxidation rate depends weakly on the surface temperature but strongly on the gas transportation characteristics through the boundary layer, which are mainly determined by the bulk gas properties.
While for ZrB2 and SiC modified graphite composite, porous oxide scales formed during oxidation at ultra-high temperatures. Though porous and less protective, these oxide scales helped greatly in reducing the exposed surface area of the underneath substrate and therefore slowed down the oxidation progress (see Fig. 1). In this way, the penetration of gaseous phases through the porous oxide scale becomes the oxidation rate-controlling step. It depends not only on the microstructure of the oxide scale[15], but also on the bulk gas characteristics, in that the pores in the oxide scales acted as short-path channels for the penetration of gaseous phases. Since similar oxide scale microstructures were observed in the present work, it can be known that the change of the oxidation rate of GZS at 2100 ° C in different atmospheres also resulted from the change of bulk gas properties.
4.3. Effect of total gas pressure on the oxidation of G and GZS
Based on the above analysis, a simple model with the inward transportation of oxygen through the boundary layer and/or the oxide scale as the oxidation rate-controlling step for the oxidation of G and GZS at 2100 ° C was proposed and discussed as follows.
During the oxidation of these two materials at ultra-high temperatures, a large quantity of oxygen will be consumed rapidly in the surrounding gas adjacent to the sample surface. Meanwhile, mainly a large quantity of CO will be released due to the reaction (2). Considering that the oxidation reactions take place on the substrate surface, the oxygen partial pressure (PO2)(PO2) is much lower than that in the bulk gas, while the CO partial pressure in the bulk gas is much lower than that on the substrate surface. Thereafter, contrary oxygen and CO pressure gradients are built through the boundary layer and/or the oxide scale, as shown schematically in Fig. 6. Because the diffusivity of CO is similar to that of oxygen, the oxidation rate based on the outward diffusion of CO would be of the same order as that based on the inward diffusion of oxygen[22]. For the convenience of discussion, only oxygen inward diffusion was considered in the present work. The oxidation rate is proportional to the oxygen inward diffusion flux (JO2)(JO2)[23]. According to Fick's diffusion law:
For pure graphite,
equation(9)
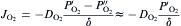

where DO2DO2 is the diffusivity of oxygen through the boundary layer, δ is the thickness of the boundary layer. The superscripts of ′ and ″ denote the interface of bulk gas/boundary layer and boundary layer/substrate, respectively. Because the oxidation of graphite is very rapid at ultra-high temperatures, it is reasonable to assume that PO2″PO2″ is negligible as compared with PO2′ PO2′ . In this way, the oxidation rate of graphite becomes proportional to the oxygen partial pressure in the bulk gas (PO2′ )(PO2′ ) and the diffusivity of oxygen through the boundary layer (DO2)(DO2), and inversely proportional to the thickness of the boundary layer (δ ).
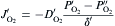
Similarly, for GZS,
equation(10)

equation(11)
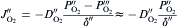

where DO2′ DO2′ and DO2″DO2″ are the diffusivities of oxygen through the boundary layer and the pores in the oxide scale, respectively; δ ′ and δ ″ are the thicknesses of the boundary layer and the oxide scale, respectively. The superscripts of ′ , ″ and ″′ represent the interfaces of bulk gas/boundary layer, boundary layer/oxide scale and oxide scale/substrate, respectively. Similarly, PO2″′ PO2″′ can be assumed to be negligible due to the rapid oxidation reactions proceeding at the substrate/oxide scale interface. During oxidation, the oxygen diffusion flux through the boundary layer (JO2′ )(JO2′ ) is equal to that through the pores in the oxide scale (JO2″)(JO2″). According to Luthra's theory [22], the boundary layer thickness for oxidation in static atmospheres or slow gas flows would at least be larger than the sample size. Therefore, in the present work, δ ′ would be over 20 mm, being more than two orders of magnitude higher than δ ″. Meanwhile, DO2″DO2″ would have comparable values with DO2′ DO2′ due to the large amount and size of the pores in the oxide scale (see Fig. 4 and Fig. 5). In this case, comparing Eqs. (10) with (11), it is not difficult to deduce that PO2″PO2″ would also be much lower than PO2′ PO2′ and hence negligible. Then, the oxygen inward diffusion flux during the oxidation of GZS (JO2)(JO2) can be approximately expressed by Eq. (12). Thus, it is known that the oxidation rate of GZS also depends on the oxygen partial pressure in the bulk gas (PO2′ )(PO2′ ), the diffusivity of oxygen through the boundary layer (DO2′ )(DO2′ ) and the boundary layer thickness (δ ′ ).
equation(12)

In the two bulk gas conditions of 1 × 10⁵ Pa air and 0.2 × 10⁵ Pa O2 used in the present work, the oxygen partial pressure is the same, while the total gas pressure is different. According to the diffusion theory, the collision frequency of gaseous molecules increases with increasing total gas pressure, which results in the decrease of the average length of the free path and finally the decrease of the diffusion coefficient of gaseous molecules. That is to say, the total gas pressure affects significantly the diffusion of oxygen and carbon monoxide through the boundary layer. According to Wagner's theory[24], D is proportional to T3/2/P. Therefore, the higher the total gas pressure, the smaller the DO2DO2, and hence the slower the oxidation progress according to Eqs. (9) and (12). As a result, the oxidation rates of G and GZS are lower at 2100 ° C in 1 × 10⁵ Pa air than those in 0.2 × 10⁵ Pa O2. It should be noted that the oxidation rate of graphite can also be greatly influenced by the boundary layer thickness, which is mainly determined by the bulk gas flow velocity [23]. Since static gas conditions were applied for oxidation in the present work, the change of the boundary layer thickness was negligible and hence not taken into consideration in the discussion.
5. Conclusions
(1)The oxidation kinetics of both graphite and C-ZrB2-SiC composite follow the linear rate law at 2100 ° C, while C-ZrB2-SiC composite exhibits much lower oxidation rate than graphite due to the formation of the oxide scale on its surface.
(2)The rate-controlling step of the ultra-high temperature oxidation of C-ZrB2-SiC composite is proposed to be the inward penetration of oxygen through the pores in the oxide scale.
(3)Both of graphite and C-ZrB2-SiC composite experience more severe oxidation at 2100 ° C in 0.2 × 10⁵ Pa O2 than in 1 × 10⁵ Pa air, because the lower total gas pressure results in the higher diffusivity of oxygen through the boundary layer.
This work was supported by the National Scientific Instrument and Equipment Development Project (No. 2011YQ14014504).
The authors have declared that no competing interests exist.
作者声明没有竞争性利益关系.
Reference
| [1] |
|
| [2] |
|
| [3] |
|
| [4] |
|
| [5] |
|
| [6] |
|
| [7] |
|
| [8] |
|
| [9] |
|
| [10] |
|
| [11] |
|
| [12] |
|
| [13] |
|
| [14] |
|
| [15] |
|
| [16] |
|
| [17] |
|
| [18] |
|
| [19] |
|
| [20] |
|
| [21] |
|
| [22] |
|
| [23] |
|
| [24] |
|