

1. Introduction
Rechargeable lithium ion batteries have become the predominant energy source for portable electronic products, electric vehicles, and hybrid vehicles [[1], [2], [3]]. As we know, the performance of lithium battery is largely determined by cathode materials. With the rapid technological development and serious environmental concerns, it’s necessary to explore eco-friendly and low-cost materials with higher energy density for lithium secondary batteries [4,5]. Compared to those layered transition mental oxide cathode materials such as LiCoO2, LiNiO2 and LiMnO2, LiFeO2 has many advantages, such as significantly high theoretical capacity of 282 mA h g-1, abundant raw materials and nontoxic [6,7]. According to the existing reports, that LiFeO2 has many forms, such as α-, β-, and γ-LiFeO2, corrugated layer LiFeO2, hollandite-type LiFeO2 and goethite-type LiFeO2 [[8], [9], [10]]. Compared with other forms, α-LiFeO2 which has been proved to be electrochemically activity attracted more attentions due to its relatively facile synthesis way and outstanding electrochemical properties [11,12]. Nevertheless, the slow lithium ion migration rate and poor electronic conductivity (< 10-9 S cm-1) severely hindered the cyclic stability and rate capability [13]. In order to improve the electrochemical performance, especially the high-rate performance, considerable strategies have been employed to address these problems, including particle size reduction, aliovalent ion doping, and carbon coating [[14], [15], [16]]. In view of the previous reports, the addition of carbon could form a carbonaceous conductive network in particles to enhance the conductivity of cathode materials, especially for those low-conductivity materials such as LiFePO4, LiFeSiO4 [17,18]. For α-LiFeO2, Rahman et al. prepared the α-LiFeO2/C by using toluene and malic acid as the solvent and the carbon source, the nanocomposite delivered an excellent cycle stability at 0.5 C [19]. Right after that, they introduced multi-walled carbon nanotubes into the nano-sized α-LiFeO2 to obtained α-LiFeO2/MWCNT by a radio frequency oxygen plasma process. The α-LiFeO2/MWCNT delivered a stable cyclic performance and high specific capacity of 147 mA h g-1 at 1 C after 100 cycles. Obviously, carbon addition can substantially improve the electrochemical performance of α-LiFeO2 [20].
It’s well known that reduced graphene oxide (rGO) has been considered as an outstanding carbonaceous additive for relatively low conductivity cathode materials, for excellent electrical conductivity, good mechanical, thermal stability, and large surface area (2630 m2 g-1) [21]. According to the above results, the electrochemical performance of α-LiFeO2 would be improved by combining reduction particle size and carbon coating processes together [[22], [23], [24], [25], [26]]. However, as far as we know, no one has yet reported the electrochemical performance of nano-sized α-LiFeO2 material modified by rGO.
Herein, we firstly obtained the α-LiFeO2-graphene (α-LiFeO2/rGo) nanocomposite via a layer by layer (LBL) self-assembly modification technology, followed by a calcination process. Due to the strong electrostatic attraction between opposite charged species, α-LiFeO2 nanoparticles dispersed homogeneously on graphene sheets. Such special structure can further improve the conductivity and prevent the pulverization of the electrode during repeated charge/discharge process. As a result, the α-LiFeO2/rGO nanocomposite synthesized through this way owned low EIS (electrochemical impedance spectra) and polarization value, and exhibited a superior electrochemical performance with high specific capacity and stable cyclic performance at 1 C.
2. Experimental
2.1. Synthesis of α-LiFeO2 nanoparticles
The α-LiFeO2 nanoparticles were prepared by a low-temperature molten salt strategy. Firstly, 3.2 g LiOH·H2O and 3 g Fe(NO)3·9H2O was ground in a mortar with a small amount of distill water. After thoroughly ground for several hours, the same amount of anhydrous alcohol was added to form a thick slurry, which was finely ground and dried at 80 °C for 12 h. Subsequently, the obtained brown powder was then calcined at 300 °C for 3 h in a muffle furnace in air. The resulting products was washed with distill water and ethanol repeatedly, followed by drying at 80 °C for 12 h.
2.2. Synthesis of α-LiFeO2/rGO composite
The α-LiFeO2/rGO nanocomposites were prepared by a layer-by-layer self-assembly approach, followed by the calcination process to obtain highly conductive reduced graphite oxide (rGO). Typically, graphite oxide (GO) was prepared according to a modified Hummer’s method [26]. Then, the obtained graphite oxide powders were exfoliated and dispersed in 100 mL water (containing about 0.15 g GO) by ultrasonication. The α-LiFeO2/rGO nanocomposites were obtained as follows. First, 0.5 g α-LiFeO2 powders were stirred for 1 h in 120 ml 0.5 mol L -1 NaCl solution, then 0.6 g polypropylene chloride (PAH) was added and stirred for another 0.5 h. After that, the sample was washed repeatedly with deionized water to remove excessive PAH. Then the PAH modified α-LiFeO2 powders were put into 20 mL distill water, and the obtained suspension was added dropwise into the above 100 mL GO solution under vigorous stirring for 2 h. The obtained precipitate was filtered and washed repeatedly with deionized water. Finally, the product was dried at 80 °C for 6 h, followed by an annealing treatment at 500 °C for 8 h under the Ar atmosphere to achieve the α-LiFeO2/rGO nanocomposites. For a comparison, pristine α-LiFeO2 nanoparticles without rGO modification were prepared according the above synthesis procedure. The mass loading of the α-LiFeO2/rGO and pure α-LiFeO2 electrodes are listed in Table 1.
Table 1 Mass loading density of the active materials.
| Testing condition | ||
|---|---|---|
| Rate performance | 1.56 | 1.52 |
| 0.5 C cycling performance | 1.34 | 1.30 |
| 1 C cycling performance | 1.27 | 1.25 |
2.3. Characterizations of α-LiFeO2 /rGO cathode materials
The X-ray diffraction (XRD, Bruker DX-1000, Cu Kα radiation) was employed to identify the crystalline structure of the electrode material. The microstructures and morphology of the as prepared α-LiFeO2 composites were observed using the scanning electron microscope (SEM, JEOL, JSM-6360LV) and transmission electron microscopy (TEM, JEOL, JEM-3010). Thermal analysis was applied on thermo gravimetric analyzer (TGA/SDTA851). The specific surface area and pore volume were obtained by Brunauer-Emmett-Teller (BET) N2 adsorption-desorption measurement (BET, NOVA3000 analyzer). Raman spectroscopy (LabRAM HR800, HORIBA JobinYvon) and X-ray photoelectron spectroscopy (XPS, ESCALAB 250XI) were further performed to indicate the structure of the composites and electronic state of each element.
2.4. Electrochemical tests of α-LiFeO2/rGO cathode materials
The electrochemical performance of α-LiFeO2 and α-LiFeO2/rGO were conducted using the CR2025 coin-type cell. The working electrodes were composed of the cathode material, acetylene black, and polyvinylidene difluoride in N-methylpyrrolidone, with the proportion of 85:10:5. The homogeneously slurry was evenly coated on aluminum foil and dried in an oven at 80 °C for 30 min, followed by compressing to obtain round positive plates with 12 mm in diameter. The cells were fabricated in an Ar-filled glove box, with a lithium foil as the negative electrode, a celgard microporous polypropylene membrane was used as a diaphragm and 1 M lithium hexafluorophosphate (LiPF6) dissolved in ethylene carbonate (EC) and diethl carbonate (DEC) in a 1:1 vol ration. The galvanostatic charge-discharge performance were evaluated using a land CT2001A battery testing system for voltages in the 1.5 V to 4.8 V range. The cyclic voltammogran (CV) and electrochemical impedance spectra (EIS) were recorded by CS-350 electrochemical workstation. The scan rate of the CV was 0.1 mV s-1, and the frequency range of EIS was 0.1 Hz to 100 kHz.
3. Results and discussion
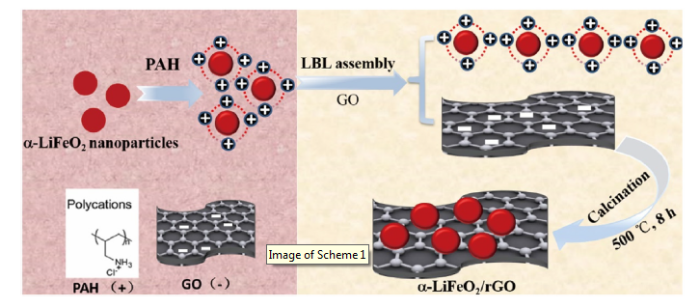
The representative formation procedure of α-LiFeO2/rGO by LBL approach was presented in Scheme 1 Graphene oxide was negatively charged due to the functional groups such as carboxyl and hydroxyl on the surface [23]. Therefore, after the modification of PAH, the positively charged α-LiFeO2 nanoparticles would be attracted to the surface of GO sheets with negative charges. Due to the electrostatic adsorption of opposite charges, the α-LiFeO2 nanoparticles were uniformly adhere to the GO sheets, such a typical structure is believed to facilitate the electronic conductivity and ion transportation.
Scheme 1.
Scheme 1.
Schematic illustration of synthesis of α-LiFeO2/rGO composite.
The XRD patterns of the as-prepared α-LiFeO2 and α-LiFeO2/rGO composites were presented in Fig. 1. All the diffraction peaks of the both samples could be well matched with the cubic phase α-LiFeO2 (Space group of Fm3m, JCPDS No. 74-2284, a =4.156 Å) [27]. The lattice parameters were a = 4.157 and 4.158 for α-LiFeO2 and α-LiFeO2/rGO, respectively. In view no extra peaks of impurity phase in both patterns. However, in comparison to the pure α-LiFeO2, the peak intensity of α-LiFeO2/rGO composite was growing weaker, especially for (111), (200) and (311) peaks, which may be attributed to the amorphous form and homogenously dispersion of graphene [28,29]. The α-LiFeO2/rGO could be successfully synthesis through the LBL self-assembly method, and the graphene addition and LBL process didn’t change the α-LiFeO2 phase development.
Fig. 1.
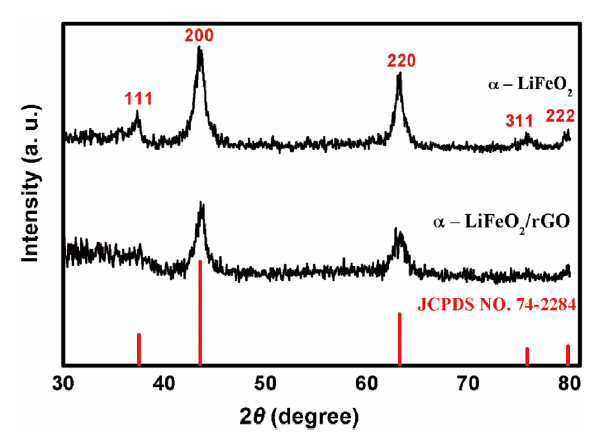
Fig. 1.
XRD patterns of α-LiFeO2 and α-LiFeO2/rGO composite.
Fig. 2 shows the SEM and TEM images of the prinstine α-LiFeO2 and α-LiFeO2/rGO composite. As shown in Fig. 2(a) and (b), the α-LiFeO2 sample was composed of tiny particles agglomerated together to form clusters. However, after the LBL self-assembly process, a morphology of ultra small α-LiFeO2 particles well dispersed on the surface of the graphene was observed in Fig. 2(c) and (d). TEM images displayed in Fig. 2(e) and (f) showed clearly that a thin layer α-LiFeO2 nanoparticle well dispersed on the graphene sheets with a good intimate contact between α-LiFeO2 nanoparticles and graphene sheets. As expected, the uniform α-LiFeO2/rGO may be ascribed to the facial LBL synthesis method, espeiscally the strong electrostatic attraction contributed to the particles evenly distributed on the graphene nanosheets. Futheremore, the facial method may effectively separate the α-LiFeO2 particles from forming aggregated clusters. The HRTEM image in Fig. 2(g) confirms the α-LiFeO2 nanoparticles have (111) and (200) crystal planes with a planar distance of 0.244 nm and 2.11 nm. In addition, the selected area electron diffraction pattern (Fig. 2(h)) consists of several rings that can be indexed to cubic α-LiFeO2. The mapping images presented in Fig. S1 successfully detected C, Fe and O. The C mapping image indicatinng the C element distributed uniformly in α-LiFeO2/rGO, which well agree with the SEM and TEM results. This typical architechture may beneficial for electrons transferred between the nanoparticles and graphene [24].
Fig. 2.

Fig. 2.
SEM and TEM images of α-LiFeO2 (a, b) and α-LiFeO2/rGO composite (c-f); HRTEM (g) image with corresponding SAED pattern (h) of α-LiFeO2/rGO composite.
Raman spectroscopy was used to detect the carbon in the composite. As shown in Fig. 3(a), the two peaks appeared around 1358 cm-1 and 1586 cm-1 for the α-LiFeO2/rGO sample were consistent with the typical D and G bands of graphene [30,31]. Generally, the D band was attributed to the A1g phono of C sp3 atoms and the G band was the E2g phono of C sp2 atoms [32]. It clearly demonstrated the existence of graphene. Moreover, the intensity ration of D and G bands (ID/IG) which was used to characterize the defects and disorder degree of graphene nanosheets was 1.14 in the α-LiFeO2/rGO sample. Based on the above results, the low ID/IG of α-LiFeO2/rGO indicated the graphene in the sample was relatively ordered, and thus facilitated the fluent stream of electrons [33]. In order to characterize the detailed particle surface adsorption performance, the nitrogen adsorption-desorption isotherms and Brunauer, Emmett and Teller (BET) surface area of α-LiFeO2 and α-LiFeO2/rGO composite have been measured and showed in Fig. 3. The specific surface area of α-LiFeO2/rGO is 125.96 m2 g-1, higher than that of α-LiFeO2 (110.9 m2 g-1). Nitrogen adsorption-desorption isotherms showed in Fig. 3(b) illustrated that α-LiFeO2/rGO has an obvious hysteresis at a relative pressure (P/P0) of 0.4-1, which is broader than 0.7-0.8 of α-LiFeO2, indicating the porosity of α-LiFeO2/rGO [34]. Meanwhile, the wide pore size distributions from micropores to macropores (2-100 nm) of α-LiFeO2/rGO are further confirmed in Fig. 3(c). The micropores are likely due to the α-LiFeO2 nanoparticles (22 nm), while the macropores and mesopores may result from the rGO modification. This hierarchical pore structure with a large surface area may noticeably affect electrochemical properties of the electrode material [35]. To determine the graphene content in the α-LiFeO2/rGO composite, TG analysis was carried out (Fig. 3(d)). Accordingly, the weight percentage of graphene in the composite is estimated to be 5%.
Fig. 3.
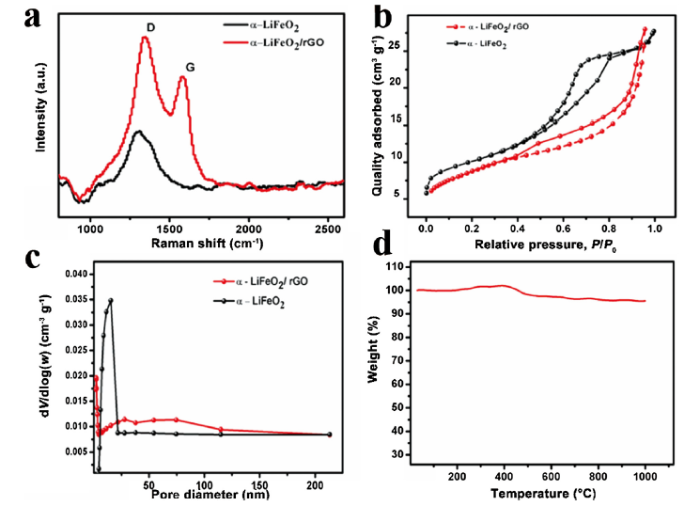
Fig. 3.
(a) Raman spectra of α-LiFeO2 and α-LiFeO2/rGO composite, (b) N2 adsorption-desorption isotherms, (c) BET pore width of α-LiFeO2 and α-LiFeO2/rGO composite (d) TG curve of α-LiFeO2.
Fig. 4 showed the XPS spectra of α-LiFeO2/rGO. As shown in Fig. 4(a) and (b), the Li 1s and O 1s peaks were assigned to Li and O in α-LiFeO2. In Fig. 4(c), the Fe 2p spectra exihibited two peaks at 711.04 eV and 724.56 eV, which assigned to the Fe 2p3/2 and Fe 2p1/2 spin orbit peaks of α-LiFeO2 [34]. Besides, the Fe 2p3/2 and Fe 2p1/2 main peaks were clearly accompanied by satellite peaks on their respective higher binding-energy sides at about 719.8 eV and 733.4 eV [35]. No peaks for Fe4+ and Fe2+ appear that indicates the LBL process did not alter the overall chemical states of Fe. Fig. 4(d) revealed the C 1s spectra include four peaks which corresponding to C=C, C-C, C-O-H and C=O, the binding energy were 284.74, 285.87, 286.34, and 288.35 eV, respectively [36,37].
Fig. 4.

Fig. 4.
XPS spectra of Li, O, Fe and C for α-LiFeO2/rGO composite.
The electrochemical performance of α-LiFeO2 and α-LiFeO2/rGO nanocomposite were shown in Fig. 5. As shown in Fig. 5(a), the cycling performance of α-LiFeO2 and α-LiFeO2/rGO were tested at 0.5 C in a voltage range of 1.5-4.8 V. The initial discharge capacity of α-LiFeO2 and α-LiFeO2/rGO were 170.8 and 182.1 mA h g-1, respectively. Meanwhile, except for the first cycle, both electrodes presented an prominent coulombic efficiency during the subsequent cycling process, especially for the α-LiFeO2/rGO sample which delivers a coulombic efficiencies close to 100% througout the cycling process. In consideration of the poor electron conductivity and slow lithium-ion transportation of α-LiFeO2, the initial discharge capacity and coulombic efficiencies of both electhodes were properly high. We compare our findings here with the previously reported α-LiFeO2 cathode materials (Table S1). The rate capabilities of the as-prepared α-LiFeO2 nanoparticles and α-LiFeO2/rGO nanocomposites are comparable or better, which manifests that the particle size reduction can enhance electron and ion conduction, leading to a better cycling performance [38]. The rGO modification also enhances the electron conductivity of α-LiFeO2, further improving the cycling stability. However, it was noted the α-LiFeO2/rGO electrode delivered a more stable capacity retention of 90.5% after 50 cycles, as compared to that of pristine α-LiFeO2 having 70.7%. It was obviously that the α-LiFeO2/rGO displayed a much better capacity retention.
Fig. 5.

Fig. 5.
(a) Cycling performance of α-LiFeO2 and α-LiFeO2/rGO at 0.5 C in the voltage range of 1.5-4.8 V and the corresponding coulombic efficiency, specific charge and discharge curves of α-LiFeO2 (b) and α-LiFeO2/rGO (c), rate performance (d), average specific capacity (e) and cycling performance at 1 C (f) of α-LiFeO2 and α-LiFeO2/rGO.
Typical charge-discharge profiles presented in Fig. 5(b) and (c) indicated the 1 st charging profiles were similar for both of the electrodes. The voltage increased from the open circuit voltage to 4.5 V, then a gradual increase to cut-off voltage, giving a long charging platform around 4.8 V. It was clearly the following charging profiles were totally different from the first profile, for charging platform was reduced from 4.8 to 2.5 V. Upon the discharge process, both electrodes have a long platform around 2.0 to 1.5 V. It was observed a large voltage hysteresis during the discharge step, according to revious reported results [39], the Fe4+ ions generated during first charging process may result in the voltage hysteresis. Morales et al. proposed Fe4+ atoms were displaced from octahedral 4a sites to tetrahedral 8c positions, and thus hindered lithium diffusion [40]. Another point was that unstable Fe4+ oxidized the electrolyte to produce Fe3+, leading to Fe3+/Fe2+ couple reaction during discharge process [41]. The rate performance of the α-LiFeO2 and α-LiFeO2/rGO composite were shown in Fig. 5(d), with rates varied from 0.1 to 2 C in the voltage range of 1.5 to 4.8 V. The dischage capacity decreased with the increasing of the discharge rate. Howere, because of the special structure formed based on graphene, the α-LiFeO2/rGO composite delivered a better rate performance than α-LiFeO2. As seen in Fig. 5(e), the α-LiFeO2/rGO electrode delivered average discharge capacities of 238.9, 187.2, 178.4, 121.8 and 99.5 mA h g-1 at 0.1, 0.2, 0.5, 1 and 2 C, respectively. The highly conductive rGO provided a fast electron transfer net, which effectively improved the electrochemical kinetics. Moreover, the graphene nanosheets prevented the re-aggregating of the α-LiFeO2 nanoparticles, resulting in much more active reaction sites for the electrode reactions [30]. When the current density changed back to 0.1 C, the high average capacity of 178.8 mA h g-1 was restored which proves an excellent rate capability for α-LiFeO2/rGO.
To deeply understand the rGO modifying effects on the electrochemical properties. We tested the cycle performance of both electrodes at the higher current density of 1 C (Fig. 5(f)). The α-LiFeO2 electrode can’t bear such high current density and the specific capacity decreased to 83.7 mA h g-1 after 50 cycles. Nevertheless, after introducing graphene, α-LiFeO2/rGO showed superior cycle stability with initial discharge capacity was 111.8 mA h g-1 and 97% capacity retention after 50 cycles. Based on the above electrochemical analyses, it can be concluded that special structure of graphene and α-LiFeO2 formed by LBL can effectively utilize the high conductivity and elasticity of graphene to offer outstanding rate capability and cycle stability.
Fig. 6(a) and (b) showed the first three cycles of cyclic voltammograms for the α-LiFeO2 and α-LiFeO2 /rGO nanocomposite. In the first cycle, both samples have a sharp oxidation peak at 4.8 V which may be caused by Fe4+ [20]. For the subsequent two cycles, the α-LiFeO2 sample showed a broad cathodic peaks at around 2.736-2.954 V and a corresponding anodic peak at around 1.588 V. The α-LiFeO2 /rGO sample also showed a pair of distinct redox peaks for the 2nd and 3th cycle. The cathode peak appears at 2.458 V, while the anodic peak appears at 1.763 V. The voltage difference between cathodic and anodic peaks of α-LiFeO2 indicates potential difference ΔE (Eoxidation - Ereduction) between the oxidation and reduction processes [42]. The lower ΔE value for α-LiFeO2 /rGO (0.695 V) indicated that the graphene modified α-LiFeO2 electrode have better ionic and electronic conductivity than un-modified α-LiFeO2 elctrode (1.148 V, 1.366 V) [43].
Fig. 6.
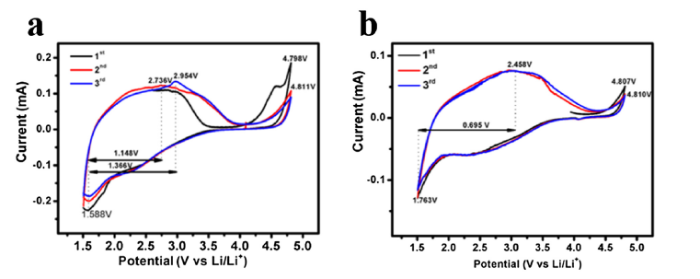
Fig. 6.
Cyclic voltammograms of (a) α-LiFeO2 and (b) α-LiFeO2 /rGO sample.
The Nyquist plots and equivalent circuit of the α-LiFeO2 and α-LiFeO2/rGO cells before cycling, after 10, 20 and 50 cycles were shown in Fig. 7(a) and (b). Both cells have the similar shapes of the Nyquist plots. In the equivalent circuit, Rs is the ohm contact area, Rct is the charge transfer resistance where the high-frequency semicircle existed in the plots, CPE is the double layer capacitance. Wo is the warburg impedance. Among these resistances, Rct is closely linked to the electrochemical performance [44]. Table 2 shows the fitting value of Rct, for pristine α-LiFeO2, the original Rct is 230.2 Ω, which is much greater than that of α-LiFeO2/rGO (113.7 Ω). Moreover, the increase in Rct of α-LiFeO2/rGO after cycling was less than that of α-LiFeO2, especially after long cycles. The simulation results were shown in Table 2. According to the previous repor [45], the Rct depends on the reaction kinetics of electrons and ions, which includes electronic and ionic conductivity and further reaction between ions and electrons. For the α-LiFeO2/rGO nanocomposite, the absolutely small Rct after various cycles suggested the faster kinetics of the charge-transfer reaction.
Fig. 7.

Fig. 7.
Nyquist plots of (a) α-LiFeO2 and (b) α-LiFeO2 /rGO samples, (c) Equivalent circuit model of EIS, (d) the relationship curve between Zˈ and ω-1/2 in the low frequency.
Table 2 Fitting values of the charge transfer resistance (Rct) and DLi+.
| Sample | Resistance (Ω) | 0 cycle | 10 cycles | 20 cycles | 50 cycles | DLi+ (cm2 S-1) |
|---|---|---|---|---|---|---|
| α-LiFeO2 | Rct | 230.2 | 249.3 | 304.4 | 610.3 | 1.3 × 10⁻¹² |
| α-LiFeO2/rGO | Rct | 113.7 | 127.4 | 172.3 | 251 | 8.24 × 10⁻¹² |
Thereinto, R denotes the gas constant (J K-1 mol-1), T is the absolute temperature (K), A is electrode area (m2), n is the number of the electrons involved in the redox process, F is the Faraday constant (C mol-1), C is the concentration of lithium ion (mol m-3)and σ could been obtained by liner fitting the relationship curve between Zˈ and reprocal square root of the angular frequency in Fig. 8(d) [48]. The lithium-ion diffusion coefficients of α-LiFeO2 was 1.3 × 10⁻¹² cm2 S-1, while α-LiFeO2/rGO was calculated to be 8.24 × 10⁻¹² cm2 S-1. The results of calculations were also listed in Table 1. Combined with the smaller Rct and higher DLi+ of α-LiFeO2/rGO nanocomposite, it can be concluded that graphene modified can effectively improve both the electronic conductivity and ionic diffusion of α-LiFeO2 which further improve the cycling performance and high-rate capability.
4. Conclusion
The graphene modified α-LiFeO2 composite wasprepared by a mild, simple and eco-friendly layer by layer self-assembly way. The addition of graphene nanosheets were evenly distributed and decreased the agglomerate of α-LiFeO2 nanoparticles. After graphene modifying, the cycling performance of α-LiFeO2 was effectively improved. When carried out at 1 C at 1.5-4.8 V, the α-LiFeO2/rGO composite exhibited initial discharge capacity of 111.8 mA h g-1 with capacity retention of 97% after 50 cycles. Moreover, the reduced charge transfer resistance, small polarization value and high lithium-ion diffusion rate indicated the graphene nanosheets plays an important role in the fast transmission of ions and electrons during charge-discharge process. The results demonstrate that the α-LiFeO2/rGO nanocomposite was a promising cathode material for lithium ion batteries.
Acknowledgments
This work was financially supported by the National Natural Science Foundation of China (No. 21071026) and the Outstanding Talent Introduction Project of University of Electronic Science and Technology of China (No. 08JC00303).
Reference
DOI
URL
PMID
[Cited within: 1]

Silicon oxides have been recognized as a promising family of anode materials for high-energy lithium-ion batteries (LIBs) owing to their abundant reserve, low cost, environmental friendliness, easy synthesis, and high theoretical capacity. However, the extended application of silicon oxides is severely hampered by the intrinsically low conductivity, large volume change, and low initial coulombic efficiency. Significant efforts have been dedicated to tackling these challenges towards practical applications. This Review focuses on the recent advances in the synthesis and lithium storage properties of silicon oxide-based anode materials. To present the progress in a systematic manner, this review is categorized as follows: (i) SiO-based anode materials, (ii) SiO2-based anode materials, (iii) non-stoichiometric SiOx-based anode materials, and (iv) Si-O-C-based anode materials. Finally, future outlook and our personal perspectives on silicon oxide-based anode materials are presented.
DOI
URL
PMID
[Cited within: 2]
We report the preparation of a novel nanocomposite architecture of alpha-LiFeO2-MWCNT based on clusters of alpha-LiFeO2 nanoparticles incorporated into multiwalled carbon nanotubes (MWCNTs). The composite represents a promising cathode material for lithium-ion batteries. The preparation of the nanocomposite is achieved by combining a molten salt precipitation process and a radio frequency oxygen plasma for the first time. We demonstrate that clusters of alpha-LiFeO2 nanoparticles incorporated into MWCNTs are capable of delivering a stable and high reversible capacity of 147 mA h g(-1) at 1 C after 100 cycles with the first cycle Coulombic efficiency of ~95%. The rate capability of the composite is significantly improved and its reversible capacity is measured to be 101 mA h g(-1) at a high current rate of 10 C. Both rate capability and cycling stability are not simply a result of introduction of functionalized MWCNTs but most likely originate from the unique composite structure of clusters of alpha-LiFeO2 nanoparticles integrated into a network of MWCNTs. The excellent electrochemical performance of this new nanocomposite opens up new opportunities in the development of high-performance electrode materials for energy storage application using the radio frequency oxygen plasma technique.

 WeChat