

1. Introduction
Considering the severe situation on energy crises and environmental pollution, the hydrogen evolution by photocatalytic technology has exhibited great promise because of its environmental friendliness and possibility to replace fossil fuels [[1], [2], [3], [4]]. Various types of photocatalysts have been explored to produce hydrogen, such as TiO2 [[5], [6], [7]], g-C3N4 [[8], [9], [10]] and sulfides [11,12]. Among which niobates and tantalates show potential due to their particular layered structure and excellent chemical stability [13,14]. Some of niobates and tantalates, including NaNbO3 [15], SrTa2O6 [16], SnNb2O6 [17] and MgTa2O6 [18,19], have proven to be efficient semiconductor photocatalysts and exhibited superb performance as well.
Perovskite NaNbO3 and NaTaO3, as one of typical niobates and tantalates, have been comprehensively researched recently because of their unique advantages, including easy construction of controllable morphology and special perovskite-type structure (ABX3), etc. [20,21]. However, some problems, such as low quantum efficiency and wide band gap (3.0-4.7 eV), still exist and greatly hinder their large-scale application [22]. To deal with the above-mentioned issues, heteroatom doping at the A, B and/or X sites is regarded as an effective strategy [23]. Because the composition and symmetry structure of these materials may be changed through this method, which greatly determined their band structure and photocatalytic properties [24].
To date, co-doping at the A, B and/or O sites of niobates and tantalates (such as A2BNb2O7, A2BTa2O7, AB2Nb3O10) (where A = Li, Na, K and B = Ca, Sr, Ba) have been widely used in ferroelectric and dielectric domains [[25], [26], [27]]. However, there are still limited studies on the photocatalytic application. Jana et al. synthesized NaNbxTa1-xO3 powders by substituting Ta5+ cations with isovalent Nb5+ cations and achieved great improvement of photocatalytic activity compared with pure NaTaO3. However, the products were always irregular and rough, which dramatically influenced their performance [28]. Besides, heteroatom introduction always resulted in poor crystallinity and increased defects, leading to the recombination of electron-hole pairs [29]. Therefore, controlling the morphology and crystallinity in the process of heteroatom doping are still of great challenge and worth investigating.
Generally, the properties of semiconductor materials, including NaNbO3 and NaTaO3, have a strong morphology dependence [30]. Because different morphologies significantly influence the optical capture ability, active site number and accessibility to reactive actives [31]. Especially, 1D nanostructure, including nanotubes, nanorods and nanowires, have gained much attention because of the advantages such as high aspect ratio, quantum refinement effects and more reactive activities [32,33]. By virtue of these advantages, combining the 1D nanostructure and heteroatom doping strategy to improve the photoactivity of photocatalysts are still greatly attractive.
In this work, 1D single-crystalline NaNb0.875Ta0.125O3 wires were successfully synthesized through a facile hydrothermal strategy for the first time. Careful Ta doping was performed to control the morphological and structural evolution during the reaction process. The photocatalytic H2 production of different samples was comparatively studied. It was found that the photocatalytic activity of NaNb0.875Ta0.125O3 wires was greatly improved by contrast with pure NaNbO3 and NaTaO3. In addition, a possible mechanism of photocatalytic H2 production was explored in detail.
2. Experimental
2.1. Materials
All the chemicals, including niobium oxide (Nb2O5), tantalum oxide (Ta2O5) and sodium hydroxide (NaOH) were purchased from Sinopharm Chemical Reagent Co., Ltd., China, and no further purification was performed.
2.2. Preparation
For the preparation of NaNb1-XTaXO3, a series of mixtures of Nb2O5 and Ta2O5 were added into 10 M NaOH solution under constant stirring for 60 min. The molar ratio of Nb/Ta was 9:1, 7:1, 3:1, 1:1 and 1:3, respectively. After that, the above suspensions were transferred to a 100 mL Teflon-lined stainless steel autoclave and heated at 180 °C for 2 h to produce white solids. Next, the precipitates were washed with DI water and anhydrous ethanol, respectively, and then dried at 100 °C overnight. Finally, the resultant samples were annealing at 500 °C for 12 h. The corresponding products were denoted as NaNb0.9Ta0.1O3, NaNb0.875Ta0.125O3, NaNb0.75Ta0.25O3, NaNb0.5Ta0.5O3 and NaNb0.25Ta0.75O3, respectively.
The atomic ratios of NaNb1-XTaXO3 wires were confirmed by X-ray fluorescence spectrometer measurement (XRF). As shown in Table S1, the atomic ratios of Nb/Ta in NaNb0.9Ta0.1O3, NaNb0.875Ta0.125O3, NaNb0.75Ta0.25O3, NaNb0.5Ta0.5O3 and NaNb0.25Ta0.75O3 were measured to be 8.23, 6.11, 2.85, 1.24 and 0.35, respectively. The result showed that the chemical composition of the samples was close to the theoretical values that designed.
For the synthesis of NaNbO3 and NaTaO3, the procedure was the same as above except pure Nb2O5 and Ta2O5 were used instead of the mixture.
2.3. Characterization of the catalysts
The power XRD was carried out on a Bruker D8 advance spectrometer with CuKα radiation (λ = 0.154 nm) in a 2θ range from 10° to 90°. The morphology and crystal structure were characterized by scanning electron micrographs (SEM) with a PHILIPS XL 30 microscope operating at accelerating voltage of 20 kV and JOEL JEM 2010 transmission electron microscope (TEM). The low-temperature EPR spectra were performed on a JES-FA200 ESR spectrometer at 103 K. FT-IR and Laser Raman Spectra were implemented on a Nicolet Avatar-360 FT-IR Spectrometer and Horiba Jobin Yvon XploRA Raman spectrometer. XPS was conducted on an RBD 147 upgraded Perkin Elmer PHI 5000C ESCA system equipped with a dual X-ray source. Ultraviolet visible diffuse reflectance spectra (UV-vis DRS) spectra were obtained on a SHIMADZU UV-2450 instrument with BaSO4 as a reference. Photoluminescence (PL) spectra were measured on a JASCO FP-6500 type fluorescence system. The photocurrent density measurements were performed on an electrochemical workstation (CHI 760E) equipped with a standard three-electrode system including Ag/AgCl electrode, platinum wire and counter electrode. Irradiation was performed with a 300 W Xe-lamp (Ceaulight, CEL-HXF300) as light source. 0.5 M Na2SO4 aqueous solution was used as the electrolyte solution. In the preparation of working electrodes, 3 mg of sample powder was suspended into 1 mL of ethanol and ultrasonically dispersed to obtain a slurry. Then, the slurry was dispersed onto the ITO glass (10 mm x 10 mm) and then dried at 120 °C for 30 min to remove ethanol. Electrochemical impedance spectroscopy (EIS) experiment was carried out on a ZENNIUM electrochemical workstation (Zahner, Germany). EIS was conducted in a frequency range of 200 kHz to 5 MHz for 10 mV in DC potential of open circuit potential (OCP) after a 10 min delay.
2.4. Photocatalytic test
Water-splitting reaction was performed on a vessel equipped with a glass closed gas circulation system which used a 300 W Xe arc lamp (CeauLight, CEL-HXF300) as light source. In a typical process, 100 mg power was suspended in mixed aqueous solution containing deionized water (80 mL), CH3OH scavenger (20 mL) and the loading of 0.5 wt% Pt as cocatalyst. Prior to irradiation, the above solution was thoroughly degassed to remove air. The H2 content was measured by gas chromatograph (TCD, with argon as a carrier gas and a 5 Å molecular sieve column).
3. Results and discussion
3.1. Phase structure and morphology
XRD was employed to investigate the crystal structure of NaNb1-XTaXO3. As illustrated in Fig. 1(a), all samples exhibit similar XRD patterns. For pure NaNbO3, diffraction peaks at 22.7°, 32.5°, 46.3°, 52.6°, 58.0°, 46.8° and 68.0° can be ascribed to (101), (141), (202), (080), (181), (143) and (371) planes, respectively [34], which is well in line with the four-fold orthorhombic perovskite structure (JCPDS card 33-1270). While NaTaO3 match well with the two-fold orthorhombic perovskite structure (JCPDS card 74-2478) [35]. With the increase of Ta amount, the patterns of all samples exhibit little alteration and still maintain their high crystallinity, indicating Ta5+ successfully incorporates into the lattice of NaNbO3 crystal and influence the positions of Nb5+ due to the same ionic radius of both Nb5+ and Ta5+ [36]. From the partial magnified images in Fig. 1b, the splitting of peaks around 44° and 50° (2θ) obviously decrease with increasing niobium/tantalum ratio, confirming the phase transformation from NaNbO3 to NaTaO3. What's more, the perovskite-type structure of NaNbO3 is dominant when Nb:Ta ratio is 3:1 or higher. However, the perovskite-type structure of NaTaO3 become a dominant one after further increasing the content of Ta.
Fig. 1.
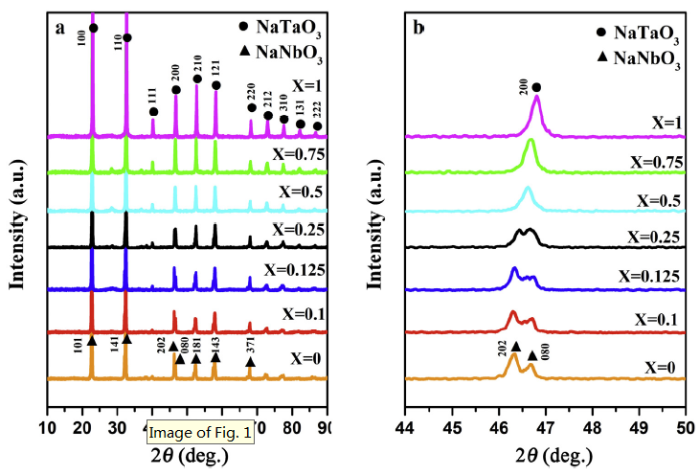
Fig. 1.
XRD patterns of NaNb1-XTaXO3 samples: (a) the whole patterns; (b) the patterns of certain angle.
The morphology of the samples was investigated by SEM, TEM and HRTEM. The SEM image in Fig. S1(a) demonstrates that pure NaNbO3 is composed by 1D wires structure, which is about 100 nm in diameter and tens of micrometers in length. However, by contrast with NaNbO3, quite distinction of NaTaO3 was synthesized at the same condition. As observed in Fig. S1(b), the NaTaO3 has an aggregated nanoparticles shape with diameters of 50-200 nm. A comparison of NaNb1-XTaXO3 was displayed in Fig. 2. As shown, the samples present the same 1D wire-like structures with NaNbO3 when Nb:Ta ratio is more than or equal to 7:1 (Fig. 2(a) and (b)), indicating tantalum successfully penetrates into the lattice of NaNbO3. However, few nanoparticles emerge and uniformly distribute on the surface of wire when extending Nb/Ta ratio to 3:1 (Fig. 2(c)). Upon further improving Ta content, more nanoparticles will coat and even agglomerate on the surface or interspace of wire (Fig. 2(d)), suggesting the independent perovskite-type NaTaO3 nanoparticles are formed at this condition. Therefore, it can be found that preciously controlling the content of Nb/Ta ratio is significantly important to obtain 1D wire-like NaNb1-XTaXO3.
Fig. 2.
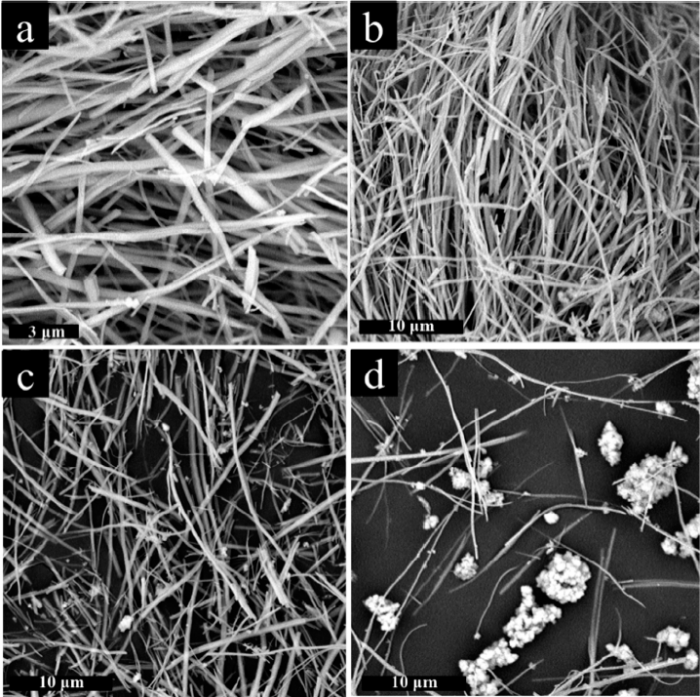
Fig. 2.
SEM images of NaNb0.875Ta0.125O3 (a, b), NaNb0.75Ta0.25O3 (c) and NaNb0.5Ta0.5O3 (d).
Moreover, the TEM image of NaNb0.875Ta0.125O3 (Fig. 3(a)) further confirmed its 1D wire-like structure with a typical diameter of ∼200 nm, which was coincidence with the results of SEM images (Fig. 2(a) and (b)). Energy dispersive X-ray (EDX) elemental mapping images of NaNb0.875Ta0.125O3 show the existence of Na, Nb, Ta and O elements and no other impurity can be detected, as also evidenced by EDS elemental scanning (Fig. 3(b) and (e)). Meanwhile, all of the elements are homogeneously dispersed, again confirming the incorporation of Ta into the lattice of NaNbO3. On the other hand, the quite clear and orderly lattice fringes in HRTEM images (Fig. 3(c)) show its superior crystallinity. It is common acknowledge that higher crystal quality of a sample will dramatically decrease the amount of defects which usually serve as recombination sites. Thus, better crystal quality is favorable for the transport of photo-produced electrons [37]. What's more, a typical selected area electron diffraction (SAED) pattern (Fig. 3(d)) exhibits that NaNb0.875Ta0.125O3 wires have a single-crystalline character, where the wire direction is determined to be along the [101] axis. Therefore, all of these results clearly indicated a small amount of Ta5+ successfully substituted the Nb5+ sites in NaNbO3 but still presented its 1D wire-like structure and single-crystalline character when Nb/Ta ratio was 7:1. The results were consistent with XRD and SEM.
Fig. 3.
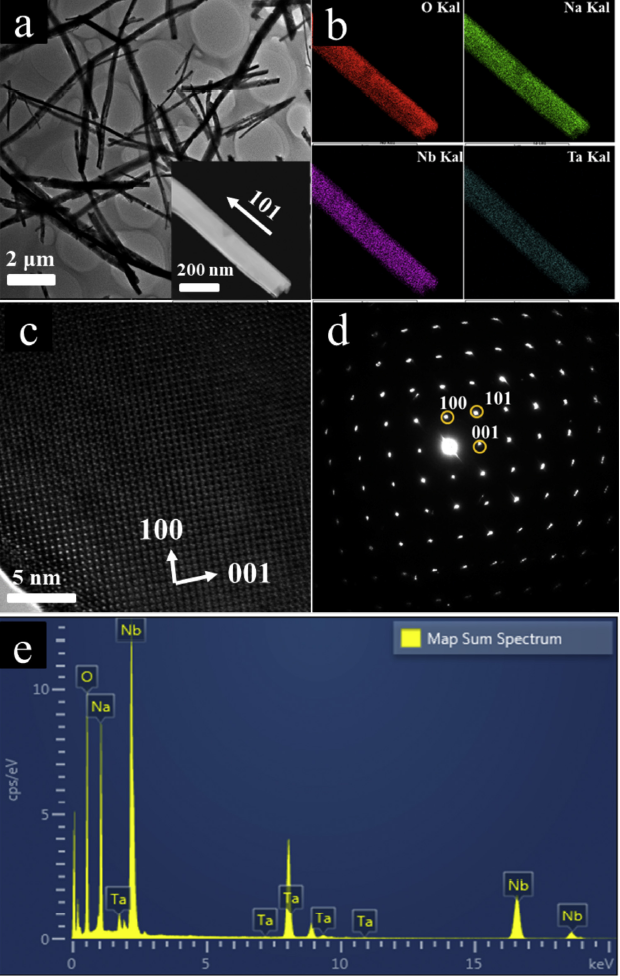
Fig. 3.
TEM image of NaNb0.875Ta0.125O3 (a) and the corresponding elemental mapping results (b); the HRTEM image (c), SAED (d) and EDS pattern (e) of NaNb0.875Ta0.125O3.
On the other hand, the concentration of defects of NaNb0.875Ta0.125O3 and NaNbO3 was explored by low-temperature EPR. Generally, the ESR peak height matches well with the relative content of paramagnetic species. As shown in Fig. 4(a), no signal peaks were observed in the spectra of both NaNbO3 and NaNb0.875Ta0.125O3 wires, which obviously indicated Ta doping would not produce any defects in the samples. Meanwhile, The O 1s spectra of pure NaNbO3 and NaNb0.875Ta0.125O3 wires are shown in Fig. S2. As can be seen, the O 1s spectra can be deconvoluted into three peaks: lattice oxygen (OL) at lower binding energy (∼529.3 eV); weakly bonded oxygen species or/and chemisorbed oxygen (OC) (∼531.2 eV) and surface oxygen (OS) at the highest binding energy (∼533.4 eV) [38,39]. The calculated ratios of OL to OT (OT = OL + OC + OS) for NaNbO3 and NaNb0.875Ta0.125O3 were 75.0 % and 77.5 %, respectively. Obviously, the lattice oxygen (OL) changed very little after incorporation of Ta. The result indicated Ta-incorporation introduces no defects in the wires, which is well consistent with low-temperature EPR. Based on the experiments discussed above, a possible crystal structure of NaNb0.875Ta0.125O3 wires was elucidated in Fig. 4(b). Unlike the perovskite structure of NaNbO3, NaNb0.875Ta0.125O3 consists of NbO6 and TaO6 octahedral with Na ions occupy sites in channels of octahedral structure. The introduction of Ta will partial substitute the Nb sites of NaNbO3, which has been demonstrated by XRD and HRTEM. Moreover, the addition of Ta will not only maintain the wire-like morphology of NaNbO3, but also present a long-range ordered single-crystalline structure, which is favorable for a photocatalytic reaction.
Fig. 4.
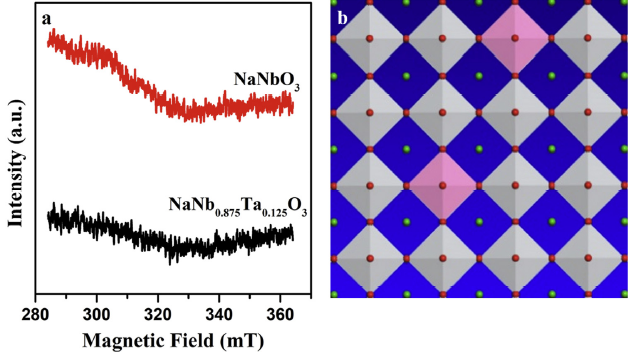
Fig. 4.
EPR spectrum at 103 K (a) and crystal structure of NaNb0.875Ta0.125O3 ( 

FT-IR and Raman spectra were used to investigate the effect of Ta doping on the crystal structure of NaNbO3. According to the results in Fig. 5(a), all samples exhibit peaks at 1650 and 3000-3500 cm-1, corresponding to the vibrations of O-H and H-O-H. Meanwhile, the sharp bands below 1000 cm-1 are assigned to the stretching model of the Na-niobate octahedral framework including Nb-O stretching, Nb--O-Nb bending and lattice vibrations [34]. With the increase of Ta amount, the characteristic absorption peaks below 1000 cm-1 slightly shift to higher wavenumber and are eventually replaced by a broad peaks (Fig. 5(b)), indicating the doping of Ta results in the distortion of [NbO6] octahedral structure.
Fig. 5.
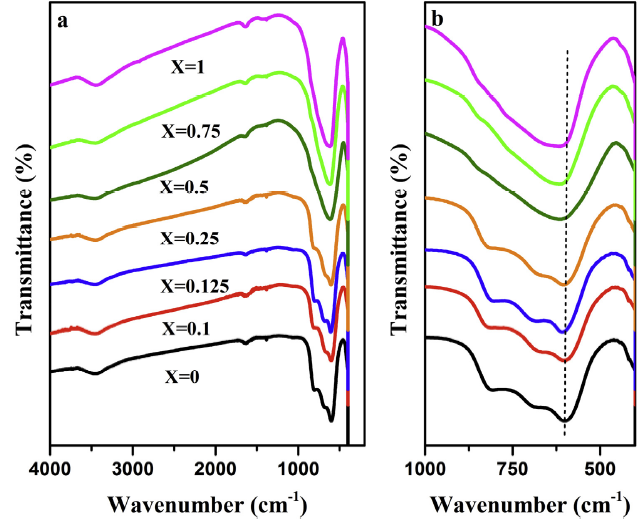
Fig. 5.
FT-IR spectra of NaNb1-XTaXO3 samples: (a) the survey spectra; (b) the spectra of certain angle.
Meanwhile, the Raman spectra of pure NaNbO3 are well consistent with the previous report [40,41], in which the band around 600 cm-1 is attributed to the typical stretching model of Nb-O octahedron (Fig. 6). By contrast with different proportions of NaNb1-XTaXO3, the intensity of the characteristic peaks below 300 cm-1 gradually decrease and almost disappear with the increase of Nb/Ta ratio (Fig. 6(a)). Moreover, the characteristic peak at 600 cm-1 moves to the direction of lower wave number, further indicating the distortion related to the rotation of octahedron caused by the incorporation of Ta into NaNbO3 (Fig. 6(b)) [42].
Fig. 6.
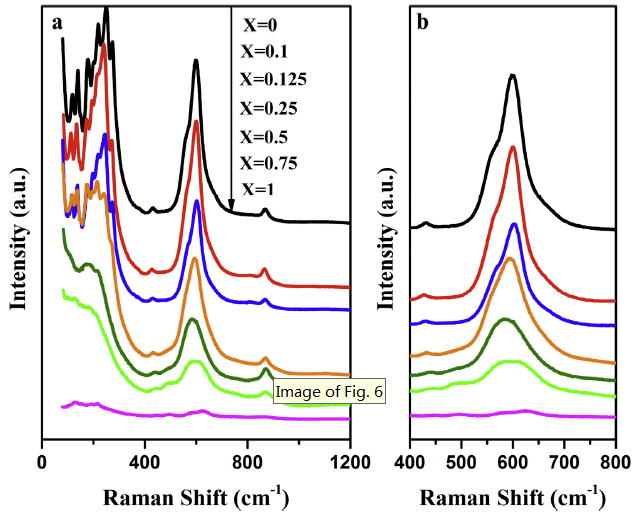
Fig. 6.
Raman spectra of NaNb1-XTaXO3 samples: (a) the survey spectra; (b) the spectra of certain angle.
Thus, according to the results discussed above, although Nb5+ has almost identical radius to Ta5+, the atomic weight of Nb5+ is smaller than that of Ta5+. The changing of stretching vibration frequencies were possibly caused by the disparate atomic weights between Nb5+ and Ta5+. According to the literature report, lattice vibration has a significant impact on the charge transport inside the semiconductor, which directly determines the charge separation efficiency of a photocatalyst [43]. Moreover, the efficient charge separation of a photocatalyst greatly determines its photocatalytic performance. Thus, the Ta doping will probably make a positive effect on the photo-activity of NaNbO3.
XPS spectra were applied to study the chemical state of NaNb1-XTaXO3. Firstly, the survey spectra in Fig. 7(a) illustrate the coexistence of Na, Nb, Ta and O elements as expected. However, the signal of Ta can be only detected when Nb/Ta ratio is less than 7:1 and its intensity increases gradually along with increasing Ta amount. Meanwhile, the Nb 3d spectrum of NaNbO3 show two peaks at 206.3 eV (Nb 3d5/2) and 209.1 eV (Nb 3d3/2), which are attributed to Nb5+ chemical state. By contrast with bare NaNbO3, the Nb 3d peaks of NaNb1-XTaXO3 shift to the direction of higher binding energy, which is possibly ascribed to the substitution of Ta for Nb (Fig. 7(b)). On the other hand, the Ta 4f spectrum of pure NaTaO3 can be split into two peaks at 25.3 eV (Nb 3d7/2) and 27.1 eV (Nb 3d5/2), indicating Ta is in the Ta (5+) chemical state. Moreover, almost no Ta 4f peaks were observed when the proportion of Nb to Ta is higher than 3:1 (Fig. 7(c)). As we all know, XPS is a surface analysis technology, which always measures the surface content of materials. Given the above phenomenon, it can be inferred that almost all of tantalum successfully enter into the lattice of NaNbO3 when Nb/Ta ratio is greater than 3:1. While, with further increasing of Ta content, some of Ta (in the form of NaTaO3) will emerge on the surface of NaNbO3, corresponding to the increasing intensity of Ta 4f spectrum. This conclusion is coincidence with the results of XRD and SEM&TEM.
Fig. 7.
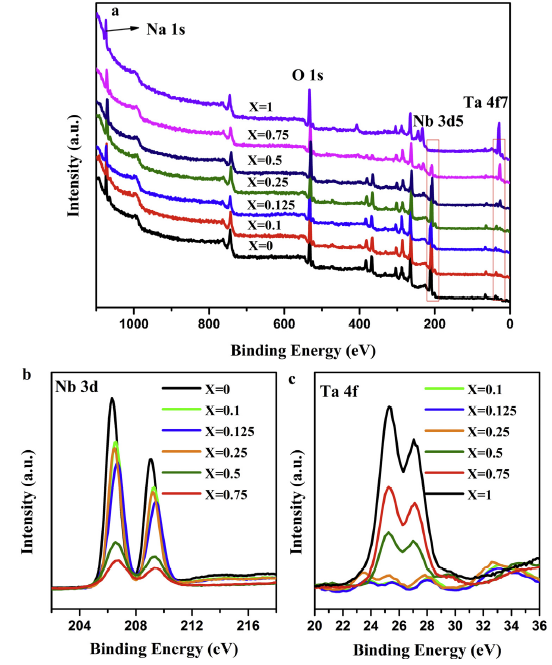
Fig. 7.
The survey XPS spectra of NaNb1-XTaXO3 (a) and the XPS spectra of NaNb1-XTaXO3 in the Nb 3d (b) and Ta 4f (c) regions.
3.2. Optical properties
The photoabsorption ability of NaNb1-XTaXO3 were probed by UV-vis DRS. As depicted in Fig. 8(a), all samples have an absorption edge between 380 and 400 nm. Moreover, the absorption edges gradually move to higher wavelength with extending Nb content, suggesting there is an optical capacity increment by contrast with bare NaTaO3. The band gap energies (Eg) of samples can be calculated through the Kubelka-Munk equation [[44], [45], [46]]: ahν = A (hν-Eg)n/2 (n = 4 for NaNbO3 and n = 1 for NaTaO3). Based on the plot of (ahν)1/2 and (ahν)2 vs. (hν) in Fig. 8(b) and (c) and Fig. S3, the band gaps of NaNb1-XTaXO3 (from x = 0 to x = 1) are calculated to be 2.99, 3.37, 3.39, 3.40, 3.36, 3.44 eV and 3.70 eV, respectively. Generally, the valence and conduction band of a transition metal oxide always consists of O 2p and transition metal d orbitals [47]. Therefore, all valence top values of the as-prepared samples should be similar because the valence bands consist of only O 2p orbitals and the O2- coordinate to Nb5+ or Ta5+ with the same ionic radius. From the valence band (VB) XPS spectra, the EVB of the samples can be ascribe to 1.85 eV (Fig. S4). Thus, according to the results of the UV-vis diffuse reflectance spectra and VB-XPS, the band structures of the prepared samples were illustrated in Fig. S5. Clearly, after incorporation with Ta, the conduction potential of Na(Nb,Ta)O3 is more negative than NaNbO3 [48,49]. This is beneficial to increase the driving force of electrons during the process of reducing water and promote the transfer of photogenerated electrons. However, the large band gap is undesirable for the light absorption of a photocatalyst. Therefore, a balance between the reduction power and the light absorption ability is greatly important to improve the photocatalytic performance of NaNb1-XTaXO3.
Fig. 8.
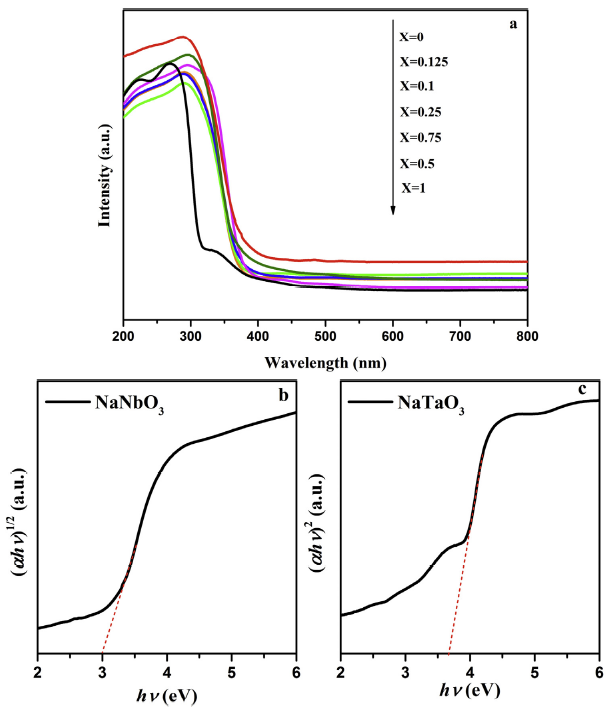
Fig. 8.
UV-vis diffuse-reflectance spectra of different NaNb1-XTaXO3 photocatalysts (a) and the plot of (ahν)n vs. photon energy (hν) of NaNbO3 (b), NaTaO3 (c).
3.3. Photocatalytic tests
The photocatalytic H2 evolution of NaNb1-XTaXO3 photocatalysts was evaluated under mimic sunlight irradiation. As depicted in Fig. 9, a H2 evolution rate of 302.1 μmol g-1 h-1 was achieved on pure NaNbO3 wires, appropriately 23 folds higher than that of NaTaO3 nanoparticles (12.9 μmol g-1 h-1) (Fig. 9(c) and Table S2). These results are possibly ascribed to the great distinction of morphology and band gap between NaNbO3 and NaTaO3. In addition, by comparison with NaTaO3, the photocatalytic performance of Na(Nb,Ta)O3 was significantly enhanced with increasing Nb amount. Especially, higher H2-production efficiency than NaNbO3 was achieved when Nb/Ta ratio was not lower than 3 (Fig. 9(a) and (b)). According to the results of XRD, the products still have the same perovskite-type structures as NaNbO3 when Nb/Ta ratio is 3:1 or higher. The introduction of Ta will increase the redox ability of electrons and also lead to a distorted octahedral structure compared with NaNbO3 (confirmed by UV-vis DRS, FT-IR and Raman spectra). These results will significantly promote the migration of photo-generated electrons, which in turn enhance the photocatalytic efficiency when Nb/Ta ratio is 3:1 or more (Fig. 9(a) and (b)). In addition, the NaNb0.875Ta0.125O3 exhibits the optimal H2 evolution rate (523.5 μmol g-1 h-1) among all of samples, which is appropriately 41 and 2 folds higher than that of bare NaTaO3 and NaNbO3 (Fig. 9(c) and Table S1). From the results of SEM&TEM, the single crystalline wire-like morphology could be successfully maintained when the ratio was 7:1. It is well known that the perfect 1D wires possess abundant active sites in their linear morphology, which is conducive to a photoreaction. However, nanoparticles will cover on the surface of wires with excessive Ta amount, which will reduce the active sites. Therefore, the synergistic effect of appropriate content for Ta-substituted Nb and the maintaining of wire-like morphology together resulted in the highest photocatalytic activity of NaNb0.875Ta0.125O3..
Fig. 9.
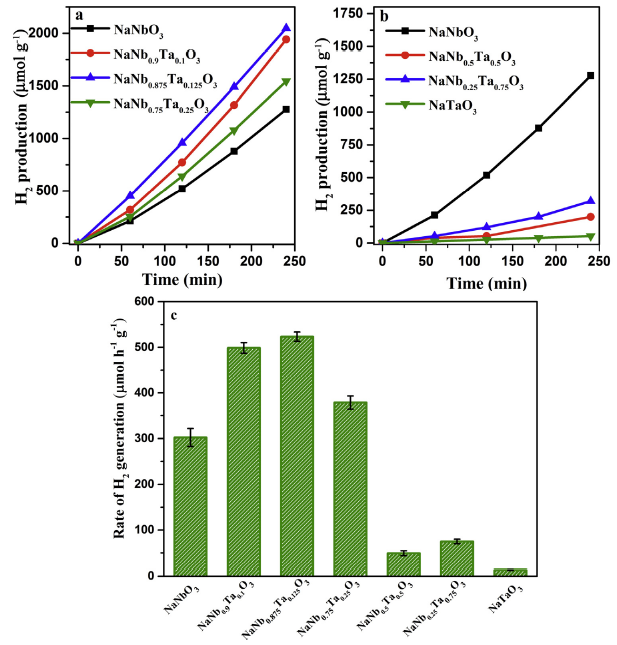
Fig. 9.
Photocatalytic H2 production under sunlight irradiation (a, b) and the H2 production rates of various photocatalysts (error bars represent the standard deviation for three parallel experiments) (c).
Additionally, the stability and reusability of NaNb0.875Ta0.125O3 has been explored because it is vital to practical application. As illustrated in Fig. 10, the amount of H2 still remained at 504.5 μmol g-1 h-1 after three repeated cycles, exceeding 90 % of the original activity. Therefore, it can be inferred that NaNb0.875Ta0.125O3 is sufficiently stable during the course of photocatalytic H2 production.
Fig. 10.
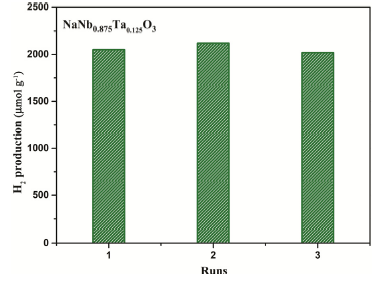
Fig. 10.
Recyclability of NaNb0.875Ta0.125O3 for the photocatalytic H2 production.
3.4. Possible photocatalytic mechanism
Since the fast interfacial charge transfer is one of important factors for photocatalytic property [50], the PL spectra were firstly evaluated at excitation wavelengths of 280 nm. As displayed in Fig. 11(a), the intensity of NaNb0.875Ta0.125O3 is slightly lower than that of pristine NaNbO3, which demonstrates a higher efficiency of charge separation towards NaNb0.875Ta0.125O3 [51]. This point is further identified by the transient photocurrent responses. Generally, a higher intensity of photocurrent corresponds to a better separation efficiency of photoproduced e-h pairs. As exhibited in Fig. 11(b), the peak intensity of NaNb0.875Ta0.125O3 is prominently higher than that of NaNbO3, further confirming the doping of Ta significantly reduces the recombination of photogenerated e-h pairs. Besides, from EIS spectra (Fig. 11(c)), NaNb0.875Ta0.125O3 exhibits significantly smaller radius than that of NaNbO3, confirming a faster interfacial charge transfer property. Moreover, as shown in Fig. 11(d), NaNb0.875Ta0.125O3 has a longer lifetime, corresponding to a slower charge recombination of the excited state. Through fitting the decay spectra, the average fluorescence lifetimes of NaNb0.875Ta0.125O3 and NaNbO3 were estimated to be 1.54 ns and 2.40 ns. The longer photocarriers lifetime of NaNb0.875Ta0.125O3 maximized the utilization of photoenergy, so as to enhance the photocatalytic activity [[52], [53], [54]].
Fig. 11.
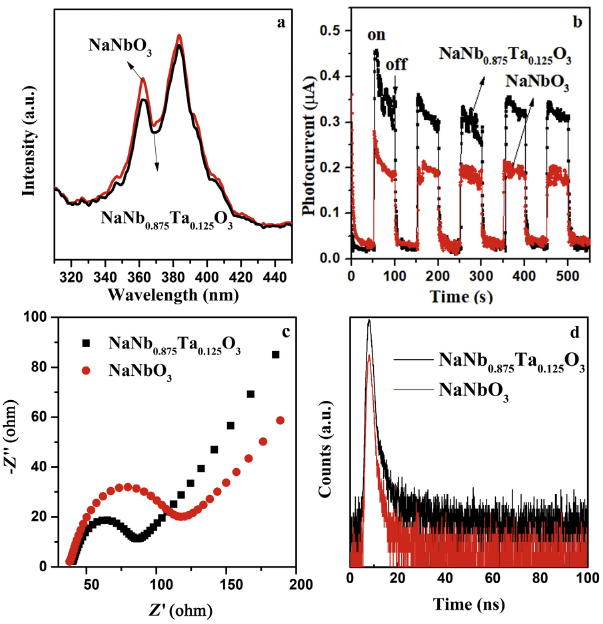
Fig. 11.
Emission photoluminescence (PL) spectra (a), photocurrent (b), electrochemical impedance spectra (c) and time-resolved PL decay curves (d) of pure NaNbO3 and NaNb0.875Ta0.125O3.
On the basis of the above analyses, a possible mechanism of NaNb0.875Ta0.125O3 was presented and illustrated in Scheme 1. As the CB edge potential is more negative than that of H2, the photo-generated electrons will be transfer quickly to the CB edge of NaNb0.875Ta0.125O3 to reduce protons to hydrogen, suppressing the recombination of e-h pairs. While, the photo-generated holes in the VB of NaNb0.875Ta0.125O3 will react with methanol (sacrificial reagent) to prolong the lifetime of charge carries. The improved photocatalytic performances of NaNb0.875Ta0.125O3 wires are mainly ascribed to the following factors: (i) Wires with perfect 1D morphology (confirmed by SEM&TEM) can generate more active sites and have easier accessibility to the active sites; (ii) Single-crystalline character dramatically reduces the amount of defects, which greatly facilitates the transfer of electrons; (iii) The more negative conduction potential makes a stronger reduction power for the H2 evolution; (ⅳ) The structural distortions caused by the partial Ta-substituted Nb will improve the separation efficiency of charge carriers.
Scheme 1.

Scheme 1.
Schematic illustration of the mechanism of NaNb0.875Ta0.125O3 during photocatalytic H2 production.
4. Conclusion
In summary, we manage to fabricate single-crystalline NaNb0.875Ta0.125O3 wires through a simple hydrothermal method. The results indicated that doping of Ta into the matrix of NaNbO3 would make a dramatically difference in the morphology, band gap structure and separation efficiency of charge carriers of the samples, which remarkably influenced their photocatalytic performance. What's more, by contrast with pure NaNbO3 and NaTaO3, a significantly improved photocatalytic H2 evolution of NaNb0.875Ta0.125O3 was obtained, which also presented superior stability. The improved activity was mainly ascribed to its synergistic effect between appropriate Ta doping and perfect 1D wire-like morphology, which resulted in fewer defects, larger reduction capability of electrons and higher separation capability of electron-hole pairs. This work provides new insights into understanding the mechanism of photocatalytic performances and offers a promising multi-component material for H2 evolution and storage.
Acknowledgements
This work was financially supported by the Natural Science Foundation of Shanghai (No. 19ZR1403500), the National Natural Science Foundation of China (Nos. 21373054, 21773291 and 61904118), the Natural Science Foundation of Jiangsu (Nos. BK20190935 and BK20190947), the Natural Science Foundation of the Jiangsu Higher Education Institutions of China (Nos. 19KJA210005, 19KJB510012, 19KJB120005 and 19KJB430034), the Suzhou Key Laboratory for Nanophotonic and Nanoelectronic Materials and its Devices (No. SZS201812) and Jiangsu Key Laboratory for Environment Functional Materials.
Appendix A. Supplementary data
Supplementary material related to this article can be found, inthe online version, at doi:https://doi.org/10.1016/j.jmst.2020.05.006.
Reference
DOI
URL
PMID
[Cited within: 1]

Supported TiO2 photocatalysts on aerosol silica were prepared by adsorption phase reaction technique (APRT) and impregnation method (IMP) under different water concentrations. Energy dispersive X-ray microanalysis indicated that Ti concentration in samples prepared by both methods increased with the content of water rising. There was a sharp increase in Ti content curve of APRT samples, while Ti concentration of IMP samples changed slowly. The grain size of TiO2 by APRT was below 6 nm and TiO2 particles dispersed uniformly on surface of silica. But the size of TiO2 by IMP was larger than 20 nm and the number of large particles increased rapidly when water concentration increased. The photocatalysis activity of as-prepared catalysts was characterized by methyl-orange photodegradation. The results showed that APRT photocatalysts had higher photocatalysis activity than IMP photocatalysts. Ti concentration and TiO2 crystalline form were two factors which affected photocatalysis activity the most. The grain size of TiO2 had little influence on photocatalysis activity, which might be counteracted by the decrease of anastase TiO2.
DOI
URL
PMID
[Cited within: 1]
N-doped NaTaO(3) compounds (NaTaO(3-)(x)N(x)) with nano-cubic morphology were successfully synthesized by one-step hydrothermal method and Methyl Orange (MO) was used as a model dye to evaluate their photocatalytic efficiency under visible-light irradiation. The as-prepared NaTaO(3-)(x)N(x) samples were characterized by various techniques, such as X-ray diffraction (XRD), X-ray photoelectron spectroscopy (XPS), scanning electron microscopy (SEM) and UV-vis diffuse reflectance spectra and GC-MS. The results indicate that NaTaO(3-)(x)N(x) displays a pure perovskite structure when the synthesis temperature is higher than 180 degrees C. Moreover, as observed by SEM images, the particles of resultant NaTaO(3-)(x)N(x) show cubic morphology with the edge length of 200-500nm, which can be easily removed by filtration after photocatalytic reaction. Doping of N increases the photocatalytic activity of NaTaO(3), and NaTaO(2.953)N(0.047) shows the highest visible-light photocatalytic activity for the degradation of MO. Based on the experiment results, a possible mechanism of the photocatalysis over NaTaO(3-)(x)N(x) and the photodegradation pathway of MO were proposed.

 WeChat