

1. Introduction
Grain growth (GG) behavior during thermomechanical treatments plays a significant role in the investigation of metallic materials owing to the close dependence of properties upon grain size [1]. There are two types of grain growth: normal grain growth (NGG) and abnormal grain growth (AGG). NGG takes place when the average grain size continuously increases with the annealing time and the grain size distribution remains self-similar, i.e. the shape of the size distribution does not change [2]. By contrast, if AGG occurs, the grain size distribution will vary significantly in terms of height and width [2]. AGG is also termed secondary recrystallization because only few grains grow rapidly and consume the rest of the microstructure. As a result, a bimodal distribution of fine and coarse grain sizes is typically observed during this process until it completes and gives rise to a new unimodal distribution [1,2].
AGG has been widely reported in many metallic materials, e.g. magnesium alloys [3,4], stainless steels [5], Fe-Si steel [6,7], titanium alloys [8] and aluminum alloys [9,10]. However, its driving mechanisms are still not entirely clear, and in some cases even controversial. In the literature a variety of mechanisms were proposed to explain this phenomenon, which are summarized as follows:
(i)Anisotropic grain boundary characteristics (i.e. mobility and energy) of high and low angle boundaries, as pointed out by Bhattacharyya et al. who studied the grain growth behavior of a strongly textured AZ31B magnesium alloy [4].
(ii)Boundary pinning induced by solute and/or Zener drag, which was for example reported by Basu et al. in their work on rolled and annealed Mg-Gd and Mg-Dy alloys [3]. Interestingly, they found that AGG occurred in Mg-Gd but not in Mg-Dy alloy upon annealing at 450 °C for 1 h. This was attributed to the stronger grain boundary solute segregation effect shown by Gd in comparison to Dy. As a consequence, at sufficiently elevated annealing temperatures, grains with a topological advantage would possess sufficient boundary velocities to overcome solute drag and grow rapidly relative to other grains, which would be eventually consumed due to their growth restriction [3].
(iv)Solid-state wetting. The occurrence of AGG in Fe-Si alloys was initially attributed to a grain size advantage necessary to overcome the Zener pinning force [[13], [14], [15], [16]]. However, other studies argued that this theory cannot explain the phenomenon because such size advantage was not always evident after recrystallization [[17], [18], [19]]. Recently, solid-state wetting was proposed to explain the preferential growth of grains with {110}<001> GOSS orientation in Fe-3%Si alloy [7,[20], [21], [22], [23]]. The basis of this theory stems from the concept of sub-grain boundaries being low energy boundaries, which drives their expansion at the expense of high angle boundaries with a much higher energy [7,[20], [21], [22], [23]]. Therefore, GOSS-oriented grains, which are rich in low energy boundaries, exhibit preferential growth over other grain orientations.
(v)Residual dislocation density gradients (DDG). In addition to grain boundary curvature, differences in the remaining stored dislocation energy among adjacent grains after recrystallization provide additional driving force for grain boundary motion during further annealing [24,25]. Boundaries of grains of lower dislocation density will migrate faster than those that possess a higher dislocation density in order to minimize the total free energy of the system. This could eventually lead to AGG after long-time annealing treatments.
(vi)Grain boundary complexion transition. This mechanism has been widely reported for several different doped alumina systems [26,27], where AGG was associated with the presence of certain grain boundaries that not only had higher mobility, but also microscopically distinguishable structures and compositions, referred to as complexions [26,28,29]. Based on this, complexions are found to promote AGG if transitions of a fraction of grain boundaries dramatically increase their mobility relative to the average surrounding grain population.
In the present study, we investigated the grain growth behavior in Mg. For this, we used (commercially) pure Mg in order to systematically exclude several of the above-mentioned phenomena related to the presence of alloying elements in order to improve our understanding of the underlying mechanisms in Mg itself. The material was hot rolled, recrystallization annealed and then subjected to grain growth annealing treatments at different temperatures for different times in order to quantitatively investigate its grain growth behavior and the corresponding texture evolution. Interestingly, AGG was observed for annealing treatments at a relatively low temperature of 220 °C but not at higher temperatures such as 350 °C even after 7 days of annealing. With the use of experimental characterization techniques combined with level-set grain growth computer simulations, this work attempts to clarify the mechanisms responsible for the aforementioned growth behavior invoking several potentially important parameters that interact differently at varying temperatures.
2. Experiments
2.1. Specimen processing
As-cast pure Mg (99.95%) was hot rolled at 400 °C (nominal furnace temperature) from 15 mm to 1.2 mm by 7 passes employing 30% thickness reduction per pass. Between the passes the rolled specimen was returned into the furnace for 10 min to regain the rolling temperature. The final pass was followed by rapid water quenching. The rolled material was then subjected to recrystallization annealing at 200 °C for 1 h, followed also by water quenching to freeze the obtained recrystallized microstructure. This step was quite challenging because the aim was to attain full recrystallization without triggering grain growth. Therefore, we chose a relatively low annealing temperature to have a better control of the onset of grain growth, where we ended up with almost a fully recrystallized structure, with the exception of a few grains that remained unrecrystallized. The average grain size of this microstructure was ∼15 μm, which served as the starting microstructure for the following grain growth annealing experiments, and as input for the simulations. For the grain growth study, smaller samples were machined from the recrystallized state and annealed at 220 °C for 10 min, 30 min, 2 h, 8 h, 16 h, 24 h, 3 days as well as 7 days. Additional annealing experiments at 350 °C for 7 days were performed to study the long duration growth behavior at a higher temperature.
2.2. Microstructure and texture characterization
Specimens for optical microscopy and electron back scatter diffraction (EBSD) were prepared by grinding and mechanical polishing, followed by electro-polishing in an electrolyte of ethanol and H3PO4 (5:3), for 45 min at 2.00 V. For chemical etching a solution consisting of 10 ml H2O, 10 ml CH3COOH and 70 ml picral (4% picric acid in a solution with ethanol) was used. The characterization of grain size and grain size distribution of specimens with different annealing conditions was done by means of a Matlab code based on the linear intercept method. LEO-1530 scanning electron microscope (SEM) equipped with a field emission gun operated at 20 keV, and HKL Nordlys II EBSD detector was employed to carry out the EBSD measurements. The EBSD data was analyzed and visualized by the Matlab toolbox MTEX [30]. The macrotextures of the investigated specimens were determined by X-ray pole figure measurements using a Bruker D8 diffractometer equipped with a high resolution area detector. To improve the grain statistics the specimen was oscillated in the diffraction plane during the measurement. Six incomplete pole figures, namely {10 $\bar{1}$ 0}, {0002}, {10 $\bar{1}$ 1}, {10 $\bar{1}$ 2}, {11 $\bar{2}$ 0} and {10 $\bar{1}$ 3}, were first measured using filtered iron Fe-Kα radiation at 30 kV and 25 mA. Then, the orientation density function (ODF) was determined and used to recalculate the complete pole figures.
2.3. Computational procedure
For the simulation work in this study, a recently developed Grain Growth Level Set simulation tool (GraGLeS) [[31], [32], [33]] was applied to explore the effect of residual dislocation density gradients, remaining in the microstructure after recrystallization, on the grain growth behavior during further annealing treatments. This model, which is available as an open source code [34], was chosen due to its excellent computational stability and good description of the physics of grain growth. This being its capability of considering a variety of parameters influencing grain growth, such as anisotropic boundary properties (if required), and finite triple junction mobilities. It also allows for real-time-scaled simulations and can incorporate both interface and volume energies as driving forces. The latest development of this model featured a 3D approach tailored for parallel computing [33]. In that study, the authors addressed a case of magnetically driven grain boundary motion in titanium incorporating magnetic energy densities that are dependent on the grain orientation with respect to the field direction. For general information on the development of the level-set (LS) method as a deterministic approach for modeling grain growth, the reader is referred to [32,[35], [36], [37], [38], [39]].
For convenience, the following is a brief reproduction of some of the information provided in [[31], [32], [33]] regarding the model setup. Numerical details of the basic and new algorithm will not be addressed here. The LS method is a mathematical framework to describe interfaces and their evolution with time. Grain growth is treated in this method as a competing shrinkage/growth of adjacent grains driven by a minimization of grain boundary energy, where the topological transition and the extinction of entire grains is automatically solved by means of Predictor-Corrector procedure. This poses a true advantage over Vertex models since they require explicit instructions to solve such transformations. The computational scheme of the basic LS algorithm consists of two main steps:
(i)Initialization of the input microstructure, where a signed distance function (SDF) is assigned to each grain. This function represents both the entire grain and the grain boundary during the evolution algorithm.
(ii)Computation of grain growth, where an iterative procedure of three sequential steps is utilized to process the SDF of each grain. (1) Predictor step that computes the motion of individual grains by mean curvature flow of their interface. This motion can be subsequently altered in order to consider interfacial anisotropy effects. (2) Corrector step that restores the topological integrity of the microstructure by removing voids and overlaps between neighboring grains. (3) Reinitialization step, where the distance functions resulting from the corrector step are computed to new interface positions.
The velocity (growth rate) of the migrating boundary at a specific time t was calculated as:
where meff denotes the effective mobility that takes into account the mobility of triple junctions in addition to the boundary mobility, which can also influence the evolution of microstructure during growth [32]. γ denotes the grain boundary energy, k the local curvature of the grain boundary, ${{p}_{DDG}}$ the additional driving force for grain growth resulting from orientation-dependent differences in the residual dislocation density, remaining in grains after the recrystallization annealing. Thus, during further annealing, recrystallized grains with a lower residual dislocation density in their environment will tend to consume other grains with a higher dislocation density in order to minimize the total free energy. r is the grain radius and ${{r}_{0}}$ is the initial average grain size after recrystallization. The dislocation density gradient (DDG) driving force was introduced as:
where G is the shear modulus of pure Mg (16.7 GPa), b the Burgers vector (0.321 nm for < a>-dislocations), and Δρ the difference in the residual dislocation density of adjacent grains of a certain grain boundary. The estimation of Δρ was based on experimental EBSD misorientation maps providing information on the geometrically necessary dislocation (GND) densities, and should therefore be treated as an order of magnitude estimate, as discussed in Section 4.2. The grain boundary energies were assumed to depend on the misorientation angle θ between adjacent grains according to the Read-Shockley model [40].
The energy of high-angle grain boundaries (θ≥15°) was considered constant;$\gamma \left( 15{}^\circ \right)={{\gamma }_{max}}=0.5J/{{m}^{2}}$. Similarly, the mobility of grain boundaries was considered to be exclusively a function of the misorientation angle, where there was also a clear distinction between the more mobile high-angle and the virtually immobile low-angle boundaries.
In the absence of reliable mobility data for pure magnesium, the mobility of general high-angle boundaries ${{m}_{max}}$ was assigned an estimated value of $4\text{ }\!\!\cdot\!\!\text{ }{{10}^{-14}}{{m}^{4}}/Js$ for 0.53 Tm (220 °C), and $4\text{ }\!\!\cdot\!\!\text{ }{{10}^{-13}}{{m}^{4}}/Js$ for 0.67 Tm (350 °C) on the basis of a study by Okrutny et al. [41] dealing with modeling of static recrystallization in AZ31 magnesium alloy. There, the authors extracted mobility values by fitting experimental grain growth kinetics obtained at different elevated temperatures to Hillert’s grain growth model. Although we should be careful with the aforementioned mobility values, we note that their magnitude is not likely to affect the overall growth trends (abnormal vs. normal growth) but rather the temporal rate of growth in the simulated microstructures.
With respect to Eqs. (3) and (4), it is noted that these generalized approaches do not capture any special conditions that apply, for example, to coincident site lattice boundaries or to cases where Zener/solute drag necessitates the implementation of anisotropic high-angle boundary energy or mobility. Another limitation of the above equations is that they do not account for a possible dependency of the boundary energy and mobility on the grain boundary plane. Despite the fact that the model at our disposal is capable of dealing with anisotropy effects to quantitatively model the relationship between grain growth and texture in magnesium alloys (e.g. Basu et al. in [3]), it will be shown later that the simplified assumptions regarding the mobility and energy of grain boundaries work relatively well in reaching a satisfying agreement between experimental microstructures and textures and their simulated counterparts.
3. Results
3.1. Grain growth microstructures at 220 °C and 350 °C
The microstructures of pure Mg annealed at 220 °C for different times are shown in Fig. 1. It is obvious that after 8 h of annealing there are a few large grains surrounded by a much higher proportion of fine grains. Such configurations of large and fine grains remained in the microstructure also for increased annealing times. Additional annealing for 7 days at the same temperature (220 °C) was conducted to investigate whether AGG comes to completion or whether a bimodal microstructure would still exist. Fig. 2 shows the respective optical microstructure for a large representative surface area of 10 × 8 mm2. As evident, there was still a bimodal distribution relating to two groups of rapidly and slowly growing grains. The average size of small grains remained at ∼ 40 μm and that of the very coarse grains at ∼ 400 μm, namely, ten times larger.
Fig. 1.
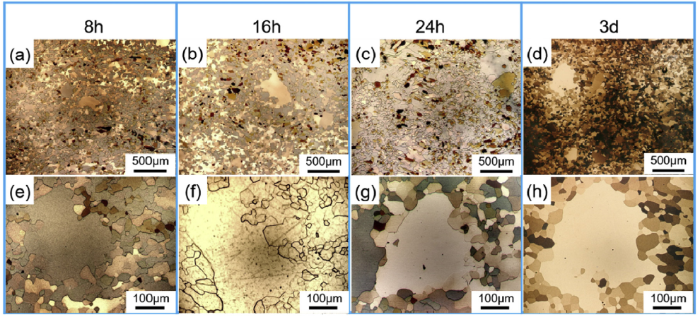
Fig. 1.
Optical microstructures of rolled and recrystallized specimens annealed at 220 °C for different times: (a) - (d) representative micrographs at low magnification; (e) - (h) specific areas of interest at high magnification.
Fig. 2.
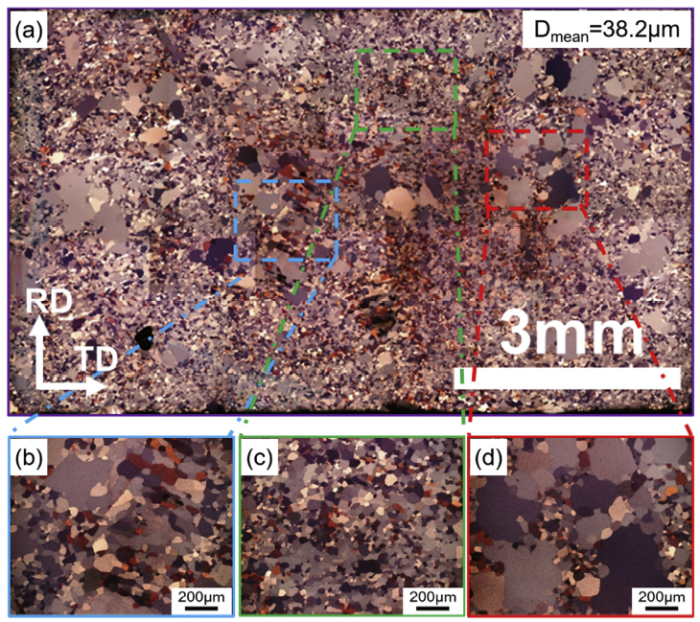
Fig. 2.
Optical microstructure of the specimen annealed at 220 °C for 7 days: (a) Panoramic image of the whole sample area (10 × 8 mm2) (RD-TD plane); (b) - (d) magnified images of several outlined areas in (a) revealing more details with respect to a few abnormally grown grains with an overwhelming size advantage compared to the rest of the microstructure.
In comparison to recent reports on AGG in Mg alloys, the 220 °C temperature used in the present study was markedly lower than the temperatures used to trigger AGG in the literature [3,4,42]. The results of Wu et al. [42] and Basu et al. [3] showed that AGG was evident in a magnesium-rare earth (Mg-RE) alloy containing gadolinium, when deformed specimens were annealed at 450 °C - 500 °C for 60 min - 80 min, respectively. For commercial AZ31 alloys, annealing temperatures between 300 °C and 450 °C are usually sufficient to induce AGG, yet only if combined with much longer durations [4]. Therefore, in order to correlate the examined AGG behavior in pure Mg with that reported for Mg alloys, an additional set of annealing experiments was carried out at 350 °C. Fig. 3 shows an optical image after annealing at 350 °C for 7 days. The size of the observed area was 10 × 6 mm2 (Fig. 3(a)). It is evident from the high magnification images (Fig. 3(b-d)), that the microstructure with respect to the size distribution was much more uniform in comparison to the 220 °C case, i.e. there were no grains with an overwhelming size advantage. This indicates that grain growth was initiated globally, which led to NGG.
Fig. 3.
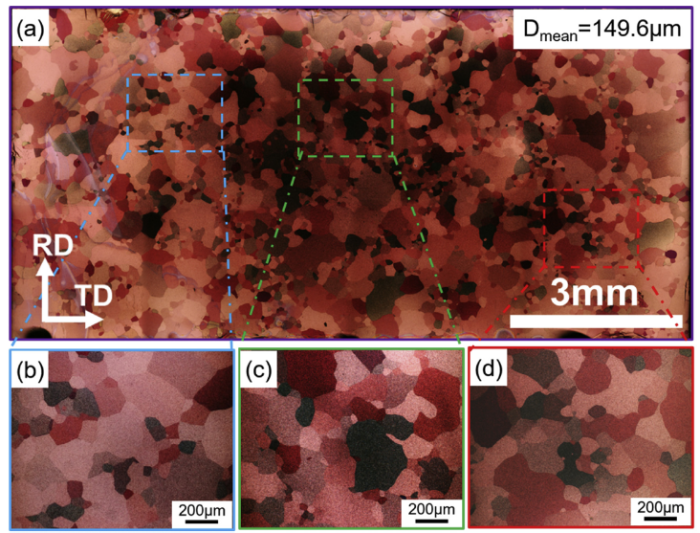
Fig. 3.
Optical microstructure of the specimen annealed at 350 °C for 7 days (analogous to
3.2. Grain boundary misorientation analysis
To examine the role of boundary misorientation in the occurrence of AGG, EBSD measurements were carried out on the specimen annealed at 220 °C for 7 days. The results are shown in Fig. 4 in terms of inverse pole figures (IPF) and misorientation axis/angle distributions. As shown in Fig. 4(a), eight abnormally-grown grains were marked with letters A to H, and their misorientation data with respect to their direct fine-grained neighbors (199 grain boundaries in total) was analyzed, as shown in Fig. 4(c). For visualizing the distribution of misorientations axes of the selected boundaries, the full circle of all twelve unit triangles was used to quantify frequent misorientation axes that could potentially identify special orientation relationships. The corresponding colorbar represents the frequency of the plotted misorientations. For example, if a specific misorientation axis appears five times in the sampled data, it will be assigned the color ‘yellow’. Misorientation axes appearing one time only will be ‘dark blue’ according to the color bar. In addition to the misorientation axis distribution the boundary misorientation angle distribution is also shown. From the data, approximately 10% (20 out of 199) of the plotted misorientation axes corresponded to the <$52\bar{7}\bar{3}$> direction. The distribution of misorientation angles revealed a distinct peak at 30°. Extended analysis included replotting all measured misorientation axes in a single unit triangle and calculating the rotation angles between the most common <$52\bar{7}\bar{3}$> axis and all other axes. The results are plotted in the bottom part of Fig. 4(c). As shown, the <$52\bar{7}\bar{3}$> misorientation axis was mostly related to the other misorientation axes by rotations of ≤ 20°.
Fig. 4.
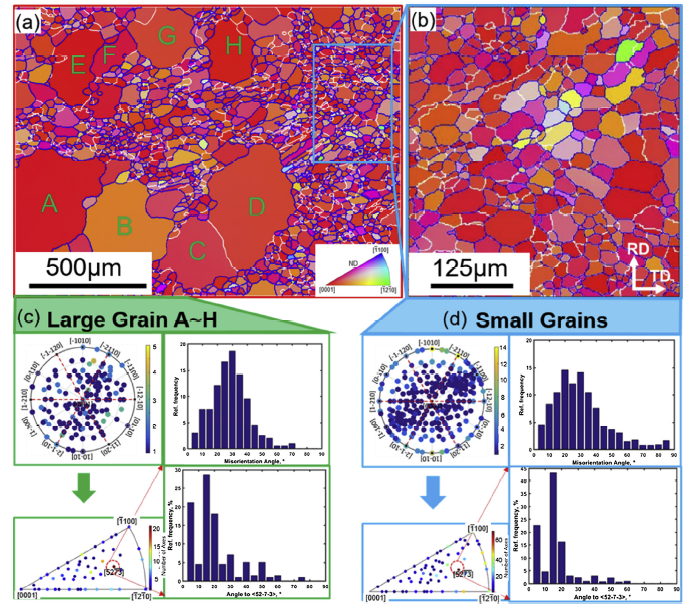
Fig. 4.
Grain boundary misorientation analysis results of the microstructure annealed at 220 °C for 7 days: (a) ND-IPF map of the sampled area containing both very large and small grains (step size: 2 μm, area: 1600 × 1200 μm2, mean MAD: 0.61°). Blue and white boundaries denote high and low angle boundaries (<15°); (b) selected area from (a) with only small grains; (c) and (d) misorientation axis and angle distributions of grain boundaries of very large and small grains, respectively. The color coding denotes the frequency of plotted misorientation axes in the unit triangles.
Analogous to the misorientation analysis of the abnormal grains A-H, fine grains within a chosen area in Fig. 4(b) were also studied (685 grain boundaries). Similarly, the distribution of the sampled misorientation axes was more or less uniform within the unit triangle. Almost 10% of the misorientation axes were clustered about <$52\bar{7}\bar{3}$>. Additionally, certain misorientation axes on the arc between <$11\bar{2}0$> and <$10\bar{1}0$> were also common with frequencies between 5% and 8%. The misorientation angle distribution of the fine grains did not show a single distinct peak at 30° but rather a broad peak between 20° and 30°. In terms of special boundaries, the misorientation relationship of 29.9°<$11\bar{2}0$> found for an appreciable proportion of grain boundaries in Fig. 4 does correspond to a Ʃ15a CSL boundary for $\text{c}/\text{a=1}\text{.620}$ [11,43]. As this is a minimum-energy, and not necessarily a high mobility boundary, its stability during grain growth is reasonable.
3.3. Texture analysis
It is reported in the literature that few grains with specific orientations can grow to abnormal sizes, as for example in a Fe-3%Si alloy. In such material, grains with a GOSS orientation tend to grow faster than others [6,7,[20], [21], [22], [23]]. In this work, to evaluate the orientation of abnormally large and small grains, the microstructure of the specimen annealed at 220 °C for 7 days was divided into two grain groups using a cutoff with respect to the average grain size in the analyzed EBSD map (33.9 μm). When the grain area was more than four times larger than the average one, the respective grain was assumed to be a large grain. The analysis is shown in Fig. 5(a) and (b) in terms of IPF-coloring maps with reference to the rolling direction (RD). Most of the very large grains were colored green (<$11\bar{2}0$>$\parallel \text{RD}$), whereas the small grains were highlighted in both green and blue exhibiting both <$11\bar{2}0$>$\parallel \text{RD}$ and <$10\bar{1}0$>$\parallel \text{RD}$ orientations. Correspondingly, the basal and prismatic pole figures were plotted for both datasets to locate the position of maximum basal and prismatic pole density. A comparison of the basal pole figures showed that the basal poles were very closely aligned with ND but the texture strength was different. Obviously, the few large grains dictated the measured sharp basal texture. Interestingly, when comparing the prismatic pole figures (either one) the very large grains were of (0001) <$11\bar{2}0$> orientation, and the small grains of (0001) <$10\bar{1}0$> orientation. These two orientations (which coexist also between small grains) are separated by 30°, which correlates well with the findings in Fig. 4 with respect to the misorientation angle distribution. The result could also suggest that in this particular case the (0001) <$11\bar{2}0$> orientation bears a certain growth advantage among other basal-oriented grains. In order to validate such growth advantage statistically, another two EBSD maps were performed and altogether more than 8000 grains were indexed. The corresponding pole figures of large and small grains are shown in Fig. 5(c) and (d), and intensities along the outmost circle (α = 90°) on (11 $\bar{2}$ 0) plane with β increased are plotted in Fig. 5(e). Both of the pole figures and intensity distributions confirmed the growth advantage of (0001) <$11\bar{2}0$> orientated grains.
Fig. 5.
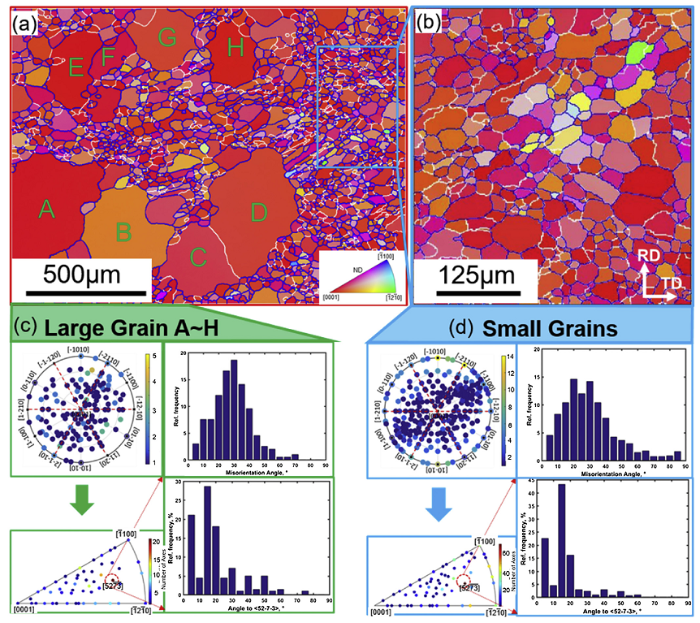
Fig. 5.
Grain orientation analysis results (220 °C / 7 days) for very large grains and small grains in terms of RD-IPF maps (a) and (b) along with the corresponding basal and prismatic pole figures; (c) and (d) pole figures of large and small grains of more than 8000 grains gotten by multi-EBSD measurements; (e) intensity on (11 $\bar{2}$ 0) plane along the outmost circle (α = 90°) with angle β increased. Texture intensity is given in terms of multiples of a random distribution.
The macrotextures of the specimens annealed at 220 °C and 350 °C for 16 h and 7 days are given in Fig. 6. In comparison to the fully recrystallized (initial) state, the bulk texture did not change during the annealing treatments at 220 °C regardless of the annealing duration (Fig. 6(a-c)). The growth advantage seen in the EBSD data for the annealing condition of 220 °C / 7 days was not visible in the XRD data. At 350 °C and after 7 days of annealing, there was an obvious strengthening of a (0001) 112-0 type texture, where the 112-0 directions became strongly aligned with the RD (Fig. 6(d)).
Fig. 6.
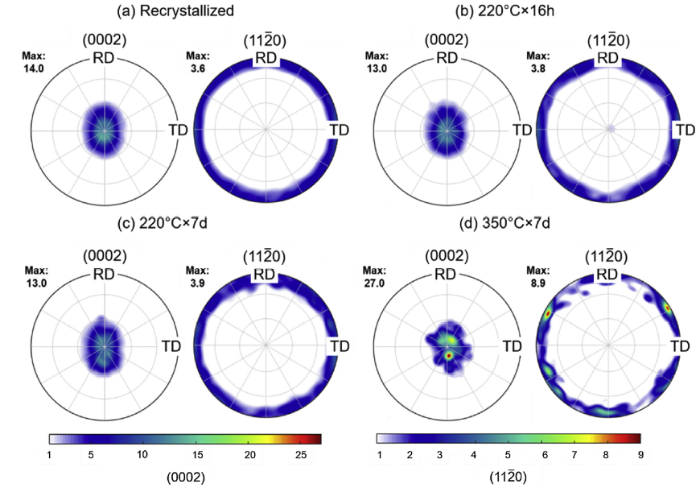
Fig. 6.
XRD bulk textures of selected specimens: (a) as-recrystallized; (b) annealed at 220 °C for 16 h; (c) annealed at 220 °C for 7 days; (d) annealed at 350 °C for 7 days. Texture intensity is given in terms of multiples of a random distribution.
4. Discussion
To summarize the results reported above, a very different grain growth behavior was observed upon annealing of hot rolled, commercially pure magnesium at 220 °C (AGG) and 350 °C (NGG) for long times up to 7 days. Texture analysis revealed indications of a certain growth advantage for basal grains with <$11\bar{2}0$> || RD orientation. Boundary misorientation analysis of a microstructure comprising the two grain groups of the very large and the much smaller ones revealed a frequent misorientation angle of 30° and misorientation axis <$52\bar{7}\bar{3}$> associated with the very large grains and their direct neighbors. This section discusses the mechanisms that could explain the rather unexpected occurrence of abnormal grain growth in deformed pure magnesium at certain annealing conditions, where a size advantage would not be a sufficient reason for the overwhelming growth of a few grains at the expense of other much finer grains. The discussion presented is supported by level set computer simulations of grain growth, implementing anisotropic microstructural conditions, such as different boundary mobility, triple junction drag and different densities of stored dislocations after recrystallization.
4.1. Possible mechanisms for the occurrence of AGG in pure magnesium
The driving force for grain growth is the minimization of the grain boundary energy, which greatly contributes to the reduction of the total free energy of the system [1]. During grain growth, grains merge in order to decrease the total grain boundary area. This process can give rise to an initial size advantage for some grains, so that they grow faster at the expense of smaller neighboring grains [44]. However, this cannot explain why in some particular cases only a few grains, mostly with (0001) <$11\bar{2}0$> orientation, were seen to preferentially grow to overwhelming sizes. The initial recrystallized microstructures of such cases do not show any obvious peculiarity with respect to orientation, grain size or grain orientation spread (GOS) distributions. An example is shown in Fig. 7 of a sample subjected to recrystallization annealing at 200 °C for 1 h. The EBSD maps in Fig. 7(a) and (b) show the orientation of recrystallized grains with respect to RD, and the corresponding GOS values, respectively. To quantitatively assess the role of grain size and size distribution in selecting texture components, the recrystallized grains (GOS < 1) shown in Fig. 7(a) were categorized into either (0001) <$11\bar{2}0$> or (0001) <$10\bar{1}0$> groups based on the smallest rotation to reach either orientation. The corresponding size distributions in terms of grain number and area fractions are plotted in Fig. 7(c) and (d), respectively. Evidently, the (0001) <$11\bar{2}0$> and (0001) <$10\bar{1}0$> oriented grains exhibit almost identical distributions for the whole range of grain sizes measured. This is important because it proves that the larger grains in the (0001) <$11\bar{2}0$> texture during AGG at 220 °C (Fig. 5) do not originate from the recrystallized condition. This also applies to the global strengthening of the (0001) <$11\bar{2}0$> component during NGG at 350 °C, which cannot be attributed to an initial size advantage in the (0001) <$11\bar{2}0$> distribution present in the recrystallized condition.
Fig. 7.

Fig. 7.
Initial microstructure of the recrystallized condition at 200 °C for 1 h prior to grain growth annealing treatments presented in terms of (a) RD-IPF EBSD map (step size: 1.5 μm, area: 1800 × 1500 μm2, mean MAD: 0.68°); (b) GOS map up to 5°. (c) & (d) (0001) <$11\bar{2}0$> and (0001) <$10\bar{1}0$> size distributions of GOS <1° grains depicted in terms of grain number and area fractions.
From Eq. (1), the driving force for grain growth is directly proportional to the grain boundary energy and the boundary curvature. If the microstructure comprises a certain proportion of special low energy boundaries, the characteristics of grain growth could exhibit an anisotropic behavior. Although we have seen some indications of CSL grain boundaries in the microstructures of our annealed specimens, we cannot claim with confidence that this mechanism is the main driver for the AGG behavior reported here. Due to their lower energy, it is not unreasonable to assume that CSL boundaries can survive long duration annealing treatments, and thus remain in the microstructure. From the perspective of anisotropic boundary properties, different relative mobility values could potentially lead to an abnormal growth behavior. When the movement of grain boundaries is restricted by some factors, like solute or Zener drag resulting from boundary interaction with solute atoms or precipitates, AGG can occur. This was for example reported by Basu et al. [3] who investigated the effect of solute segregation to grain boundaries on the grain growth behavior and resulting weak textures in magnesium-rare earth alloys. They attributed the occurrence of AGG in Mg-Gd alloy to the hypothesis that at a sufficient annealing temperature some grain boundaries are able to overcome the pinning effect and grow to larger sizes compared to other boundaries that remain pinned. Having used pure magnesium in the current study, the pinning mechanism does not offer a suitable explanation for the occurrence of AGG. It is noted that the material still has impurities but we believe their concentration is too low to induce significant pinning effects. After all, solute or Zener drag should not be dependent on the grain orientation since it was mostly the grains with the (0001) <$11\bar{2}0$> orientation that seemed to grow abnormally.
Another mechanism that has been proposed to understand the occurrence of AGG in Fe-Si alloys is the so-called solid-state wetting. The theoretical description of this mechanism can be found in [45,46], whereas Fig. 8 schematically illustrates its basic principle. The numbers associated with the grain boundaries denote their energies. The sum of energy of grain boundary AA* and grain boundary BA* is smaller than the energy of grain boundary AB so that the boundaries AA* and BA* tend to expand at the expense of the boundary AB. This means that grain A* will grow and eventually consume grain A, as illustrated in Fig. 8(a) [47]. Based on the same principle of energy minimization, a different case is shown, in Fig. 8(b), where grain A grows at the expense of grain A* [47]. It was found that this mechanism necessitates the presence of some low energy boundaries, such as sub-grain boundaries, which enhance solid-stated wetting conditions around triple junctions. An example of this is found for grains with GOSS orientation in silicon steel [7,21,47].
Fig. 8.
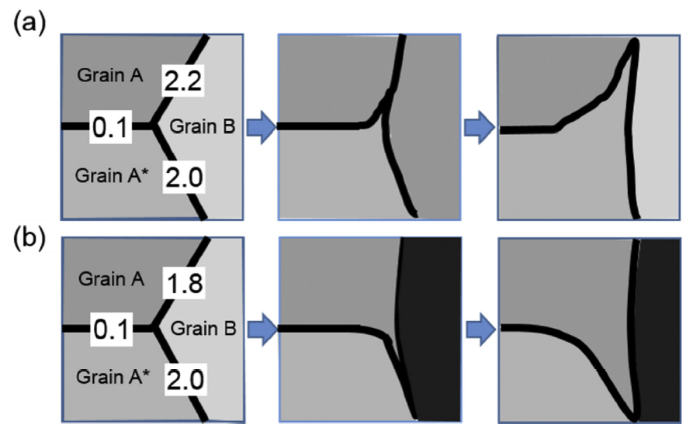
Fig. 8.
Schematic illustration of the solid-state wetting mechanism of grain growth in silicon steel reproduced from [47]. The numbers at the grain boundaries denote examples of their energies.
From the above, it is thus to be expected that as a consequence of grain growth driven by solid-state wetting, the fraction of subgrain boundaries should increase in the annealed microstructures [23,48]. However, as for our data, a comparison of the misorientation angle distributions (θ ≤ 15°) for as-recrystallized specimens (initial state) and those annealed at 220 °C for 7 days (final state) revealed no significant variation (Fig. 9). According to Shim et al. [20], low energy boundaries are frequently found in silicon steel annealed microstructures because the GOSS-oriented grains, which typically have a lower stored energy after deformation, rather recover than recrystallize. In our material, due to the small variation in the texture, it is not likely that some grain orientations only undergo recovery while other orientations undergo recrystallization. This would eliminate the possibility of having a considerable fraction of remnant sub-grain boundaries after recrystallization that is sufficient to trigger solid-state wetting during further grain growth annealing treatments.
Fig. 9.
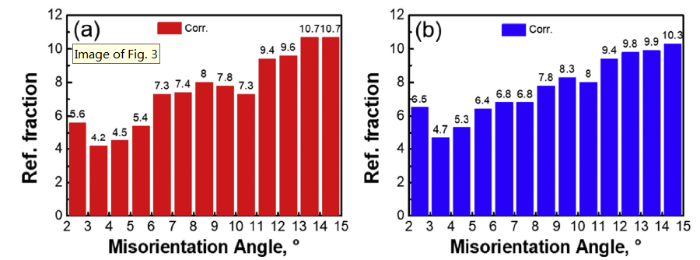
Fig. 9.
Comparison of the fraction of low angle boundaries (up to 15°) present in (a) the initial recrystallized condition, and (b) in the annealed condition at 220 °C for 7 days.
From another perspective, it might be possible that the different fiber components of the basal texture, i.e. (0001) <$11\bar{2}0$> and (0001) <$10\bar{1}0$>, have some variations in their remaining stored energy upon recrystallization (even though it is much lower) that could influence their grain growth behavior based on the DDG mechanism described earlier in the context of possible AGG drivers. In fact, in a relevant study of a Zr-2Hf alloy [12], Zhu et al. reported a favorable increase in the intensity of the <$11\bar{2}0$> fiber over the <$10\bar{1}0$> fiber during primary recrystallization and normal grain growth. In the current case, when recrystallized specimens are annealed at low temperature (220 °C), stored dislocations are not likely to have enough energy to move and are thus trapped inside grains. From the discussion above, grains with <$10\bar{1}0$> || RD and <$10\bar{1}0$> || RD orientations are likely to exhibit a gradient in their residual dislocation density, producing a driving force for a selective grain growth to consume <$10\bar{1}0$> grains and eliminate their higher dislocation density. Moreover, in addition to the DDG induced driving force, a resulting grain size advantage of <$11\bar{2}0$> grains could also accelerate their further growth, while the other grains remain comparably small because of relatively low grain boundary mobility and high triple junction drag at the this temperature. Eventually, such <$11\bar{2}0$> grains would evolve into abnormally grown grains with much larger sizes than the surrounding grains. In this scenario, AGG will cease when the very large grains come to impingement. Note that in the experiments reported above, the corresponding XRD bulk texture did not change too much in comparison to the recrystallized texture (Fig. 6(b) and (c)), which can be related to the small fraction of abnormally grown grains in the annealed microstructure at 220 °C. It is noted that the average grain size in this case remained below 50 μm.
On the other hand, when the specimens are annealed at a higher temperature (350 °C), dislocations trapped inside grains can be expected to be more mobile and thereby be easily absorbed by their nearest grain boundaries decreasing the anisotropic nature of grain growth arising from DDG. In addition, thermal activation by raising the temperature is also expected to drastically decrease the triple junction drag [49] and increase the grain boundary mobility. As a result, the difference in the growth rate between (0001) <$11\bar{2}0$> grains and their neighbors should decrease, preventing the occurrence of AGG. With respect to texture evolution, there was a significant strengthening of the recrystallized basal texture and a clear transition from a basal fiber to a (0001) <$11\bar{2}0$> component (Fig. 6(d)). This is likely to emanate from a remaining DDG effect that provides grains of that orientation with an advantage during growth. Fig. 10 provides a schematic illustration of the two cases discussed above with the conditions that lead to AGG and NGG at 220 °C and 350 °C, respectively.
Fig. 10.
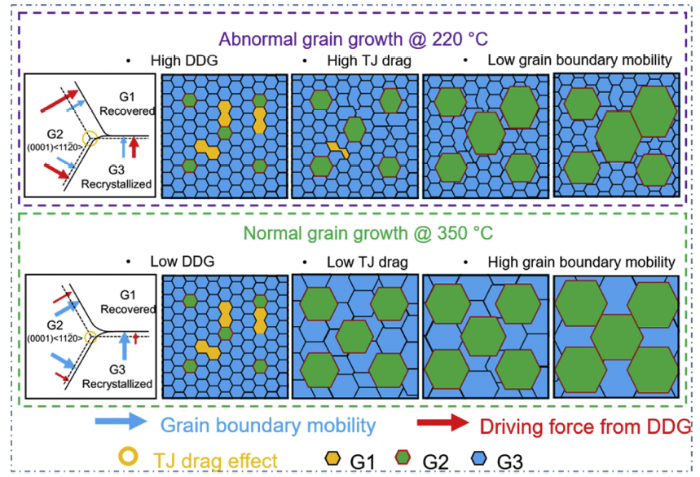
Fig. 10.
Schematic illustration for abnormal and normal grain growth occurring in annealed pure magnesium at 220 °C and 350 °C, respectively. The length and the thickness of the arrows represent the magnitude of the impact of boundary mobility and DDG at each temperature. The number of G2 grains was restricted to those with almost an ideal (0001) <$11\bar{2}0$> orientation (c.f. Section 4.2).
4.2. Level-Set computer simulations of grain growth
The hypothesized roles of local dislocation density, triple junction drag and grain boundary mobility for the specific texture and grain size distributions found in the experiments, can be investigated further by Level-Set simulations that allow systematic variation of each parameter.
Initial microstructures for the simulation were obtained by EBSD measurements after recrystallization annealing at 200 °C for 1 h (Fig. 7). As shown in Fig. 7, the recrystallized microstructure can be firstly divided into two grain groups based on their GOS values. Grains with GOS>1° (group1, hereafter G1) are assumed to be recovered, whereas grains with GOS<1° are considered recrystallized. Although we did not employ high-resolution diffraction measurements to estimate the stored energy in different grain groups, we can reasonably assume that G1 grains are associated with a higher residual stored energy than recrystallized grains. Among the group of recrystallized grains we further distinguished between (0001) <$11\bar{2}0$> grains (G2) having a competitive advantage during growth and all other recrystallized grains (G3). The selection of the (0001) <$11\bar{2}0$> grains was based on a criterion of maximum 5° angle between the c-axis and ND and maximum 3° angle between the <$11\bar{2}0$> axis and RD.
The next step in the approach was to derive a rough estimation of the dislocation density of the aforementioned three grain groups. Stored dislocations in the material after annealing consist of geometrically necessary dislocations (GNDs), which are typically immobile, and therefore less prone to rearrangement and annihilation events during recovery [50]. Unlike GNDs, which are formed to account for lattice curvature during deformation, statistically stored dislocations (SSDs) originating from statistical dislocation entanglements [51] can undergo recovery resulting in reduction of their density in the annealed microstructure [1]. In this work, the kernel average misorientation (KAM) function was used to estimate the GND densities for G1, G2 and G3 grains. Details of this calculation method can be found in [52,53]. It is noted that the standard EBSD employed for the local orientation measurements has an angular error of 0.5°-1°, which is thought to result in artificially high GND densities, particularly in a recrystallized material with a low total dislocation density. Our calculations, which are therefore likely to be an overestimate, showed that the average GND densities in the aforementioned three groups of grains were 1 × 10¹³ /m2, 6 × 10¹² /m2 and 9 × 10¹² /m2, respectively. Since it was not possible to know the relation between the GND density and total dislocation density, the latter was assumed to be 10 times larger than the estimated GND density at 220 °C. Hence, for the simulations at 220 °C, the total dislocation density in G1, G2 and G3 was taken as 1.0 × 10¹⁴ /m2, 6 × 10¹³ /m2 and 9 × 10¹³ /m2, respectively. To incorporate the role of temperature in the simulations, the values assigned to the dislocation densities, triple junction drag and grain boundary mobility were adjusted according to the trends shown in Fig. 10. For the 350 °C case, the density of residual stored dislocations was one tenth of that used in the simulations of the 220 °C case, which should be treated as an order of magnitude estimate. The boundary mobility was increased by a factor of 10 and the triple junction drag effect decreased by a factor of 1.3. These values showed a good qualitative agreement with the target textures and microstructures (grain size distributions) obtained from experiments.
Grain growth simulation results of evolved microstructure and texture at 220 °C and 350 °C are displayed in Fig. 11 for different time steps matching the experimental annealing times based upon a similar average grain size to the one obtained in the experiments. The different colors assigned to grain boundaries denote their relative mobility, with ‘red’ corresponding to maximum and ‘purple’ to minimum levels. The input EBSD microstructure with its unique set of measured Euler angles is shown in Fig. 11(a) and (f). In both cases of grain growth, the level set method, with the assumptions made for each regarding the dislocation density gradient, triple junction drag and boundary mobility was able to reproduce a very similar growth behavior observed experimentally at 220 °C and 350 °C. In Fig. 11(b)-(e) some grains start to develop a significant size advantage and proceed by eclipsing their neighboring grains, resulting in a heterogeneous microstructure with very large and very small grains. In Fig. 11(g)-(j) the simulations show a uniform growth behavior with increasing annealing time. With respect to texture, the simulated microstructures at different time steps were exported back into the file format of the EBSD data used to populate the simulations, which allowed for further texture analysis using the MTEX software. The reproduced basal and <$11\bar{2}0$> prismatic pole figures in Fig. 11 show a gradual strengthening of the (0001) <$11\bar{2}0$> component with increasing annealing time. This qualitative trend is in line with the experimental XRD and EBSD measurements (Fig. 5, Fig. 6). In terms of a quantitative agreement, it was difficult to obtain comparable texture intensities due to the limited number of remaining grains in the simulations at advanced time steps, particularly in the case of NGG that would of course lead to overstrengthening of the texture.
Fig. 11.
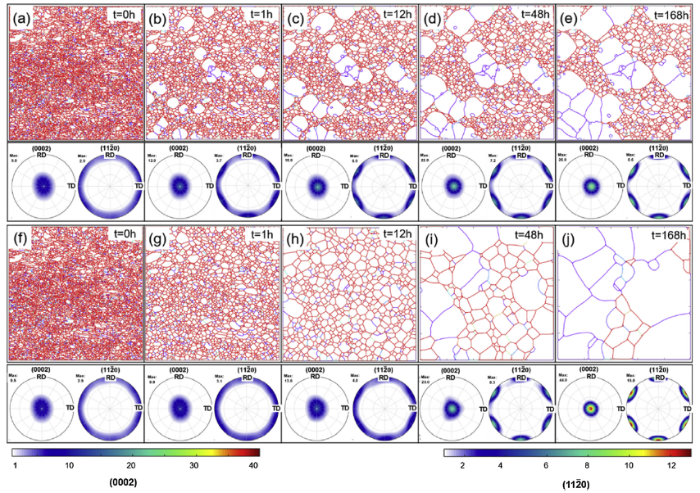
Fig. 11.
Simulated grain growth microstructures and their corresponding textures at different time increments matching the experimental annealing times employed. (a, f) input EBSD microstructure; (b - e) anomalous grain growth behavior equivalent to annealing at 220 °C; (g - j) uniform grain growth equivalent to annealing at 350 °C. The color of grain boundaries denotes their relative mobility (red is maximum, purple is minimum).
Fig. 12 presents a quantitative analysis of the simulation results shown in Fig. 11. Fig. 12(a) shows a comparison of the temporal grain size evolution for the two cases corresponding to 220 °C and 350 °C. For determining the grain growth behavior, i.e. distinguishing normal from abnormal growth, different criteria can be used. The most popular ones are based upon appearance of a bimodal grain size distribution or variation in the breadth of the normalized grain size distribution (loss of self-similarity) [2,4]. However, due to the limited number of grains in the present simulations, we used another method instead, which examines the ratio D/<d>, where D is the diameter of the largest grain and <d> is the average grain diameter of all grains [5,21,47,[54], [55], [56]]. Fig. 12(b) shows the temporal evolution of D/<d> for the two cases resembling annealing at 220 °C and 350 °C. During the first 50 min, the initial D/<d> ratio does not exhibit a strong variation, which is thought to be a period in which the group of large recovered grains (G1) are eaten up by the recrystallized grains due to their different stored dislocation densities. This process would slightly decrease the D/<d> ratio. After 50 min of annealing (the beginning of the second period) the two cases reveal a completely different evolution of D/<d> with increasing annealing time. For the 220 °C case, the D/<d> ratio increases up to 12, while the D/<d> ratio for the 350 °C case drops to 4. A large D/<d> ratio indicates presence of island grains with a grain size D many times larger than the average grain size <d>, which is in turn indicative of anomalous growth. Thus, analogously, a small ratio of D/<d> is characteristic for normal grain growth. For validation purposes, the experimental D/<d> data at 220 °C was also plotted in Fig. 12(b), which reveals a similar trend to attain high values during period 2 annealing that spans between 50 min and 7 days. In a similar fashion to Fig. 12(b), (c) now presents a comparison of the derivative of D/<d>. This analysis considers the changes in D/<d> that take place during successive time increments. A positive derivative of D/<d> is used as in indicator of AGG, which is observed for the simulated and experimentally obtained data at 220 °C (inset in Fig. 12(c)). The inflection point in the positive regime of AGG can be interpreted as the impingement of the anomalously large grains and resumption of NGG. Eventually, a steady state is reached after very long annealing times, where D/<d> becomes constant.
Fig. 12.
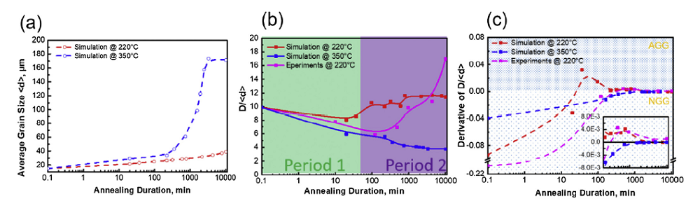
Fig. 12.
Quantitative analysis of the simulated growth behavior shown in
5. Conclusions
In this work, commercial purity Mg was hot rolled and subsequently annealed at different temperatures for different times in order to investigate its normal and abnormal grain growth behavior and link it to the corresponding texture evolution. The following main conclusions are parsed from the findings obtained by experimental microstructure characterization and level set computer simulations of grain growth.
(1) Annealing at an intermediate temperature of 220 °C gave rise to abnormal grain growth with a few grains having a grain diameter 10 times larger than the average. Increasing the annealing temperature to 350 °C yielded normal grain growth.
(2) For both types of grain growth, strengthening of the (0001) <$11\bar{2}0$> texture component was coupled with a competitive growth advantage for grains with that orientation.
(3) It is hypothesized that the fast growth rate of (0001) <$11\bar{2}0$> grains is a result of gradients in the residual dislocation density stored in grains after recrystallization. Other potential mechanisms, such as special boundary misorientation relationships, initial size advantage emerging from recrystallization, solid-state wetting effects were discussed and considered less likely to play an important role in the present case.
(4) The driving force induced by a dislocation density gradient grants (0001) <$11\bar{2}0$> grains a size advantage during early stages of growth. The type of growth will be, however, dictated by the present grain boundary mobility and triple junction drag, which are highly dependent on the annealing temperature.
(5) For annealing conditions where the temperature is low enough, (0001) 112-0 grains would thus have a higher chance of rapid growth and becoming abnormally large, while most of the other grains grow at a much slower rate and remain comparably small. This is due to a generally low boundary mobility and high triple junction drag at low temperatures, where abnormal grain growth occurs because normal grain growth is globally restricted. At a much higher annealing temperature, the anisotropic nature of grain growth arising from orientation-dependent density gradients will be extenuated because the residual dislocations inside grains are more likely to be mobile and be absorbed by their surrounding grain boundaries. Additionally, growth conditions will be globally enhanced by an increase in the average boundary mobility and a reduction of triple junction drag. This will lead to normal grain growth.
(6) The above hypothesis of the interplay between dislocation density gradient, boundary mobility, triple junction drag and annealing temperature was explored through level set modeling of grain growth incorporating those aspects. The simulation outcome reproduced the same trends for the normal and abnormal grain growth occurring at the two investigated temperatures, including the characteristic strengthening of the (0001) <$11\bar{2}0$> component. This suggests that application of this modeling approach in microstructure studies of magnesium alloys can provide valuable new insights into the problem of grain growth and associated texture evolution.
Acknowledgement
R.S Pei is grateful for financial support from the Chinese Scholarship Council (CSC).
Reference
DOI
URL
PMID
[Cited within: 1]

Electron backscatter diffraction (EBSD) in conjunction with scanning electron microscopy was used to assess the magnitude of microstructural scale deformation (local deformation) for deformed Type 316 stainless steel. Local misorientation, which is an averaged misorientation between neighboring measurement points, is often used for assessment of local deformation. However, the local misorientation is unsuitable for a quantitative evaluation because it depends not only on the local deformation but also on various factors such as measurement accuracy and the distance between points used in the misorientation calculation (step size). In this study, first, the measurement accuracy was quantified by a parameter called background noise. The factors which affect the measurement accuracy were then discussed from measurements under various conditions. Secondly, in order to reduce the influence of measurement conditions and exclude the dependency of step size in the local deformation assessment, a parameter called the local gradient G(L) was proposed. The local gradient clearly showed the spatial distribution of local deformation regardless of the measurement accuracy, and it had hardly any effect from grid pattern and step size. Finally, the local gradient was correlated with the plastic strain from which it was revealed that the strain gradient near a notch root could be estimated by the EBSD measurement.
DOI
URL
PMID
[Cited within: 1]
Since the automation of the electron backscatter diffraction (EBSD) technique, EBSD systems have become commonplace in microscopy facilities within materials science and geology research laboratories around the world. The acceptance of the technique is primarily due to the capability of EBSD to aid the research scientist in understanding the crystallographic aspects of microstructure. There has been considerable interest in using EBSD to quantify strain at the submicron scale. To apply EBSD to the characterization of strain, it is important to understand what is practically possible and the underlying assumptions and limitations. This work reviews the current state of technology in terms of strain analysis using EBSD. First, the effects of both elastic and plastic strain on individual EBSD patterns will be considered. Second, the use of EBSD maps for characterizing plastic strain will be explored. Both the potential of the technique and its limitations will be discussed along with the sensitivity of various calculation and mapping parameters.

 WeChat