

1. Introduction
In recent years, the development of superhydrophobic surfaces has attracted enormous interests in the area of material science due to its intrinsic capabilities which include self-cleaning, anti-icing, anti-fouling, corrosion protection ability, etc [[1], [2], [3]]. Many techniques such as electrodeposition [4], etching [5], templating [6], chemical vapour deposition [7], nano-/microparticle assembly [8], anodization [9], nanocoating [10], femtosecond laser pulsing [11] and electrospinning [12] have been adopted in creating superhydrophobic surfaces. These techniques focus on the deposition of low surface energy materials on the target surface and creating nano/macro hierarchical roughness on the surface; nature-inspired phenomena. Lotus leaves [13] and insects cuticles [14] are known to possess special microscopic textured surfaces causing them to exhibit superhydrophobic property. However, the durability of these surfaces has continuously posed challenges to researchers, hence, limiting their industrial applications. Most times they exhibit objectionable mechanical properties and poor chemical stability, and their structural integrities are easily compromised whenever they are exposed to harsh environmental conditions. This is because, in most cases, superhydrophobic surfaces occupy the topmost layer on the substrate; therefore, they are susceptible to environmental attacks such as scratching, chemical contamination, and fouling. Also, the nature of the hierarchy roughness of the surface could easily be damaged by gentle physical friction. For the coated surfaces, the lack of durability is partly contributed by the presence of low surface energy materials in the coat which makes coating-substrate adhesion difficult [1,15].
In a bid to overcome these challenges, researchers have developed various ways to create durable superhydrophobic surfaces [16]. Qu et al. employed diethoxydimethylsilane surface-functionalized quartz sand nanoparticles embedded into a polyvinylchloride to create a chemically stable and mechanically durable superhydrophobic surface [17]. Wang et al. used spraying and annealing techniques to prepare a polyphenylene sulfide-based wear-resistant superhydrophobic surface [18]. Paul et al. used a two-step spray method to construct graphene/siloxane superhydrophobic surface with good adhesion property on LY12 aluminum alloy [1]. The emerging new trend is the development of self-repairing superhydrophobic surfaces. Howell et al. embedded 3D vascular systems into polydimethylsiloxane to self-replenish the surface chemical properties [19]. Qu et al. used a modified clay-polymer composite to fabricate a surface that can restore both the surface chemistry and the topography [20]. Dikic et al. employed dangling perfluoroalkyl chains bonded to the polymer network through a polymeric spacer to create a self- repairing hydrophobic surface [21]. However, in order to remove the complexity in the design method, the most recent approaches have shifted to the use of stimuli-responsive microcapsules to develop self-repairable surfaces. These capsules have been successfully employed in nanomedicine [22], anticorrosion [23,24], self-healing [25,26] and so on, this can be attributed to their large inner volume, small size, large surface area, stable membrane, and quick response rate. The release of the encapsulated core content can be triggered by environmental factors such as pH, temperature, light, chemicals, magnetic field, electric field and mechanical damage [[27], [28], [29], [30], [31]]. Wei et al. prepared multi-stimuli responsive microcapsules by a microfluidic technique [32]. Ying et al. developed pH and UV dual responsive microcapsules which can be employed in waterborne coatings via UV initiated polymerization of Pickering emulsions stabilized with nano-titania and nano-silica [33].
Among all the known techniques, the spray coating method has become more attractive because it is simple and can be applied to a wide range of materials. Therefore, in this study, we described a facile one-pot microencapsulation technique using fluorosilane and urea-formaldehyde (UF) as the core and shell materials respectively. The microcapsules were mixed with fluorocarbon resin before applying on the LY12 aluminum alloy via spray method. The choice of fluorocarbon is due to its interesting properties which include non-polarity, a high degree of crystallinity, chemically inertness, low surface energy, hydrophobic and insoluble in almost all the known solvents under normal conditions [34,35]. Furthermore, the high cross-linking ability associated with UF impacts high thermal stability to the shell and offers good resistant to low polar solvent, and it is an appropriate host to reactive core content. The distinctive feature in this report is that the prepared coatings were subjected to various foreseeable environmental conditions capable of degrading the coatings, and the wettability responses were monitored afterward. These include disrupting the surface topography and chemistry of the coatings via oxygen plasma etching, surface scratching, and strong acid and alkaline solutions. Also, the coatings underwent simulated accelerated aging tests where they are exposed to UV irradiation, fluctuating temperature, and humidity. Furthermore, electrochemical impedance spectroscopy (EIS) and scanning vibrating electrode technique (SVET) were used to evaluate the coatings responses in simulated corrosive environments.
2. Experimental
2.1. Materials
Polyvinyl alcohol (PVA), sodium dodecyl sulfate (SDS), ammonium chloride, urea, resorcinol, heptadecafluoro-1, 1, 2, 2-tetradecyltriethoxysilane otherwise known as fluorosilane, formaldehyde solution (37 wt%) and aliphatic polyisocyanate (N3390). The above materials were purchased from Sinopharm Chemical Reagent Co. Ltd Shenyang, China. Fluorocarbon resin (ZEFFLE GK 570) was gotten from Daikin Fluorine Chemical Co., Ltd.
2.2. Preparation of ACFAS filled microcapsules
5 ml of SDS solution (1 wt%) and 3 ml of PVA solution (5 wt%) were added into a beaker containing 75 ml of deionized water to form a surfactant solution. The mixture was stirred using a magnetic stirrer (ZACL), and while stirring 1.5 g urea, 0.15 g ammonium chloride (as the initiator), and 0.15 g resorcinol (as the cross-linking agent) and 3 g fluorosilane were added and allowed to stir for 5 min. The pH of the solution was adjusted to 3.5 using HCl. Thereafter 3.8 g of formaldehyde solution was added and allowed to stir for 4 h at 55 °C. The mixture was centrifuged and the capsules were separated, and then dried for 12 h at 50 °C.
The mechanism of the formation of the microcapsules is an interfacial polymerization process involving two reaction stages as shown in Fig. 1. The first step is an electrophilic substitution process known as methylolation which leads to the formation of mono-, di- and trimethylolureas. The second step is a condensation reaction leading to the formation of either ether or methylene linkages with the subsequent loss of water. The overall reaction rate decreases exponentially from acidic to neutral pH scale.
Fig. 1.
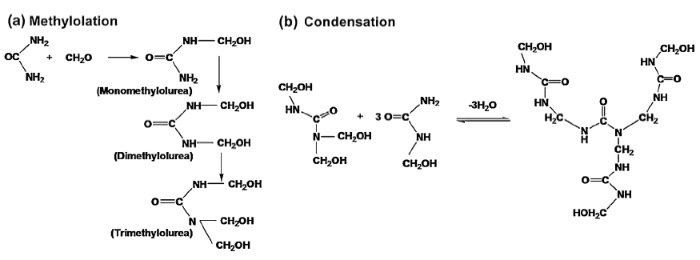
Fig. 1.
Synthesis of the microcapsules by interfacial polymerization: (a) Methylolation, (b) Condensation reaction.
The scanning electron microscope (SEM) and transmission electron microscope (TEM) images in Fig. 2(a) and (b) show that the microcapsules possess a smooth outer surface, spherical in shape with 700 nm average diameters.
Fig. 2.
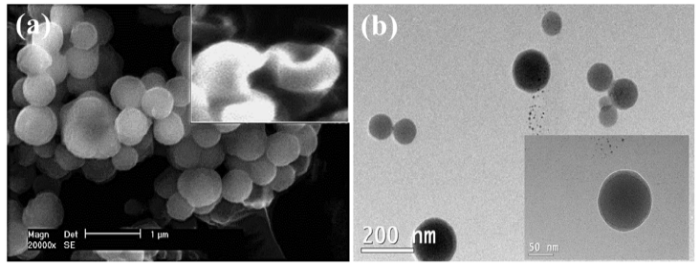
Fig. 2.
(a) SEM, and (b) TEM images of the microcapsule. The insert is an SEM picture of broken microcapsules.
2.3. Preparation of the coatings
Firstly, in order to obtain a uniform roughness on the substrate’s surface, the LY12 aluminum was polished using 600 grit sandpapers on Unipol-820 Precision Metallographical Lapping/Polishing Machine. A mixture containing 5 g GK570 resin, 3 g solvent (DMB or acetone) and PUF microcapsules was stirred at 1500 rpm. Thereafter, N3390 (used as the hardener) was added to the stirred mixture and stirred again before applying on the substrate by means of air spray at a pressure of 0.6-0.8 MPa. Three different samples labeled CS, 16.5PUF, and 23.5PUF were prepared. CS is the control sample with no microcapsule, while 16.5PUF and 23.5PUF are the samples containing the UF microcapsules. The numbers indicate that the amount of UF microcapsules in the two samples is 16.5 wt.% and 23.5 wt.% of the coatings solid content. The coatings thicknesses were maintained at 65 ± 10 μm, the measurements were determined using DeFelskoPosiTector 6000 coating thickness gauge.
2.4. Apparatus and measurements
2.4.1. Samples morphology, treatment, and characterization
The morphology of the microcapsules was observed using a JEOL TEM-2100 F transmission electron microscope. The operating voltage was set at 200 kV and an emission current of 205 μA. The microcapsules were ultrasonically dispersed in acetone before placing on a copper filter and allowed to dry for 24 h.
The surface microstructures and the elemental constituents of the microcapsules and the coatings were analyzed using scanning electron microscope model/ energy dispersive x-ray spectroscopy FEI/Philips XL-30type Field Emission ESEM. A 10 nm thick layer of Au was sputtered onto the samples before the test. Laser confocal scanning microscope (LCSM) ZEISS LSM 700 was employed to measure the surface roughness.
The FTIR analysis of the various samples was done using Nicolet Magan-IR560 infrared spectrophotometer within the wavelength range of 400-4000 cm-1.
After oxygen plasma etching, the chemical composition of the film surface was analyzed using Escalab 250 Thermo Fisher XPS system with 150-W Al Ka radiation at 1486.6 eV, The XPS results were fitted and optimized using the XPSPEAK4.1 software. The core-level spectra of the constituents’ elements were corrected according to the C 1s 284.6 eV standard.
Thermogravimetric analysis (TGA) was carried out using TGA Q500 from room temperature to 900 °C at a 10 °C/min heating rate under N2 atmosphere. Differential thermal analysis (DTA) was done using DT-TGA SETSYS Evolution 18 form 150 °C-500 °C, also at 10 °C/min in N2 atmosphere.
Oxygen plasma etching treatments were carried out using a PR500 plasma cleaner manufactured by Yamato Scientific Co. Ltd. The oxygen flow rate is 180 sccm under 90 W power.
2.4.2. Wettability measurements
The water contact angles of the samples were observed using the JC2000D2 contact angle goniometer. 10 μl droplet size of deionized water at room temperature was used, multiple drops were dispensed on the surface and the average value was taken.
2.4.3. Accelerated weathering
Accelerated weathering measurement was done using a QUV/Spray Accelerated Weathering Test Chamber produced by Q-Lab Corporation USA. The chamber is equipped with UVA fluorescent lamps (0.89 W/m2 at 340 nm). The exposure cycles were kept at 8 h UV irradiation (60 °C temperature) followed by 4 h condensation (50 °C temperature). All the samples were exposed for 293 h of combined irradiation and condensation cycles.
2.4.4. Anticorrosion performance
Electrochemical impedance spectroscopy (EIS) measurements were carried out using Princeton applied research potentiostat/galvanostat model 273A and signal recovery model 5210 lock-in amplifier. A three-fold electrode system cell was employed: the coated samples were used as the working electrode having 12.56 cm2 exposed areas, while platinum plate electrode and saturated calomel electrode (SCE) were used as a counter electrode and reference electrode respectively. The samples were immersed in a 3.5% NaCl solution at atmospheric temperature. The EIS data were obtained at open circuit potential with 20 mV sinusoidal AC perturbation over 100 kHz to10 mHz frequency range. The various impedance data were analyzed using ZSimpWin 3.10 software developed by the Princeton Applied Research. Multiple measurements were taken to ensure data reproducibility.
Scanning vibrating electrode technique measurements were carried out using SVET equipment with Pt-Ir microelectrode supplied by Applicable Electronics Inc. (USA) and controlled by Science wares ASET program. The samples (5 mm × 5 mm exposed area) were mounted on an epoxy resin holder and immersed into a 0.1 M NaCl solution. Before the measurement, a metallic needle was used to penetrate the coating in order to create two artificial defects. The Pt black tip electrode with a diameter of 30 μm was placed 150 μm above the surface of the samples. The vibrating frequencies were 270 Hz (X) and 320 Hz (Y), and the local ionic current densities were mapped on 40 × 40 grid.
3. Results and discussion
3.1. FTIR Analysis and wettability behaviors
The FTIR spectra of the UF microcapsules are shown in Fig. 3(a). The peak at 3310 to 3520 cm-1 can be assigned to the characteristics absorption peak of N-H stretching although overshadowed by the broadband representing OH group, however, the N-H bend is observed at 1550 to 1650 cm-1, the presence of doublet indicates a strong contribution from the free N-H group [36], The peak at 1250 cm-1 is assigned to C-N stretch, while the peak appearing from 1630-1680 cm-1 indicates the presence of C=O amide group. For the UF microcapsule containing fluorosilane, the Si-O-Si peak is seen at 1010-1080 cm-1. Interestingly, the decrease in the O-H and N-H peaks for the 7 days exposed microcapsule is indicative of less presence of hydrophilic species, thereby suggesting an increase in the hydrophobic property. This increase in hydrophobic property is attributed to the effect of the atmospheric moisture on the shells of the microcapsules as shall be discussed later.
Fig. 3.
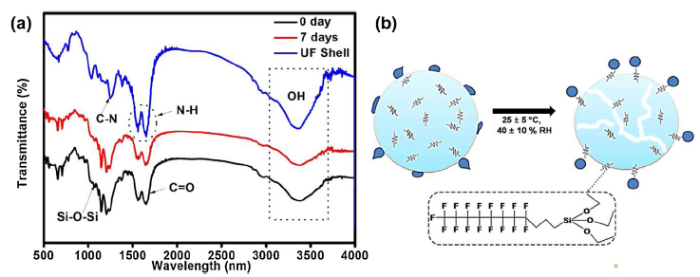
Fig. 3.
(a) FTIR spectra of the PUF microcapsules: microcapsules without the fluorosilane core content (PUF shell), fleshly prepared microcapsules (0 days) and seven days atmospherically exposed microcapsule (7 days). (b) Schematic representation of the migration of the core contents to the shell surface during atmospheric exposure.
The freshly prepared fluorosilane containing UF microcapsules are hydrophobic with a water contact angle of 97°. This is attributed to the abundant presence of hydrophilic groups (hydroxyl and amino species) on the surface of the UF microcapsule after the formation stage. However, as represented in Fig. 3(b), after one day of atmospheric aging, there is supposedly an inside-out diffusion of the fluorosilane to the outer surface due to its high volatility, hence, initiating microcapsule’s outer surface modification. And as a result, the water contact angle significantly increased to 150°, however, the water droplets could stick to the surface of the UF microcapsule. But, after seven days of aging, there is a unit rise in the water contact angle to 151°, and water droplets could roll off the surface with a 7° sliding angle. A similar result has been reported elsewhere [37]. Notably, UF products are usually restricted to interior applications because they are prone to undergo hydrolytic degradation and stress rupture under warm or cyclic moisture, and humid environment [38]. Therefore, in this case, the ruptured areas created diffusion pathways for the volatile fluorosilane to migrate to the outer surface. This stress rupture is a result of the brittleness of the microcapsules which initiates crack on the surface thereby allowing the penetration of moisture. The increase in the water contact angle during the atmospheric aging is in good agreement with the FTIR results.
3.2. Thermal analysis
The thermal stability of the microcapsules was analyzed using DTA/TGA data as presented in Fig. 4(a-c). The empty microcapsule without the fluorosilane is assigned to the PUF shell plot in Fig. 4(a), the DTA spectrum shows an endothermic peak with a maximum at 198 °C signifying a mass loss of 11% as shown in the TGA spectrum. This loss continues at a steady rate until the polymer undergoes extensive disintegration above 300 °C. The initial endothermic peak can be ascribed to the loss of water and free formaldehyde on the shell surface [39], this can also include the conversion of methylene ether linkages into methylene linkages [40]. The first exothermic peak above 200 °C indicates the onset of shell decomposition processes. Formaldehyde, water, CO2, CO, ammonia, methane, monomethyl amine, and trimethylamine are among the gaseous products released [39,40]. In contrast, the initial endothermic peak for the freshly prepared sample (0 days) is 187 °C, and 157 °C for the seven days atmospheric aged sample as shown in Fig. 4(b,c). The figures also revealed 7% and 2% weight losses for the freshly prepared and the 7-days aged samples respectively. The decrease in the initial weight loss when compared with the 11% obtained for the UF shell sample can be attributed to the less hygroscopic water present in the fluorosilane containing capsules. These confirmed the hydrophobic state of the capsules, and further suggest that the 7-days aged microcapsules are superhydrophobic. The onset of shell degradation for the fluorosilane containing samples also began above 200 °C showing that the introduction of fluorosilane did not affect the thermal stability of the microcapsules. Furthermore, the exothermic peak from 302 °C indicates the onset of the evaporation of the core content; it also indicates that the core content of the microcapsules is about 69%. The thermal degradation of fluorosilane starts at 200 °C as shown in Fig. S1.
Fig. 4.
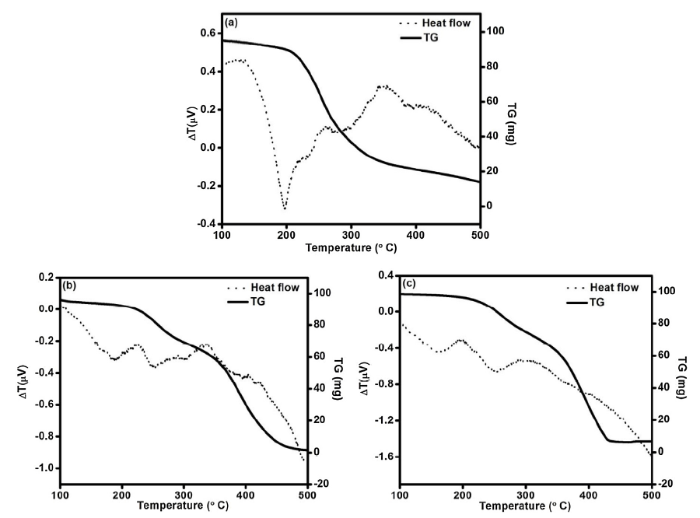
Fig. 4.
DTA/TGA spectra of the PUF microcapsules: (a) PUF Shell, (b) freshly prepared microcapsules, and (c) 7 days atmospherically exposed microcapsules.
3.3. Solvent-effect on the wettability property
The 16.5PUF and 23.5PUF coatings were produced using weak polar solvents (DMB, MIBK and n-butyl acetate) and a strong polar solvent (acetone). This is done to confirm the effect of the solvents on the wettability properties of the coatings containing UF microcapsules. The wettability results for the coatings produced with DMB solvent gave the water contact angles as 105° for 16.5PUF and 136.8° for 23.5PUF. The water contact angles for 23.5PUF coatings produced using other weakly polar solvents; n-butyl acetate and methyl isobutyl ketone are 115° and 110° respectively. Interestingly, the water contact angles for the coatings with acetone solvent are 112° for 16.5PUF and 151° for 23.5PUF with a 19° sliding angle. This signifies that the microcapsule’s shell has poor resistance to strong polar solvents resulting in the release of the core contents to the shell surface thereby increasing the hydrophobic property of the coatings. Similar observations have been reported elsewhere [37]. We also observed that 23.5PUF has a higher contact angle value than 16.5PUF due to the presence of more developed surface roughness as revealed in Fig. 5. It is suggested that the trapped air inside the textured surface of the 23.5PUF sample aided the suspension of water droplets thereby minimizing their contacts with the surface [41,42]. Furthermore, the CS sample is hydrophobic with a 92.5° water contact angle; this can be attributed to the presence of hydrophobic C-F species in the GK570 resin.
Fig. 5.

Fig. 5.
SEM images of (a) Control (b) 16.5PUF (c) 23.5PUF coated samples. Inserts are the images of the water droplets on the coatings.
3.4. pH, plasma-etching and scratch tests wettability responses
The coatings wettability responses in acid (pH 1.87) and alkaline (pH 12.70) solutions were assessed. The water contact angle of 23.5PUF and 16.5PUF samples remained unchanged after 6 h of immersion in acidic solution, while the contact angle of both samples significantly decreased after 6 h of immersion in alkaline solution. The contact angle of 23.5PUF decreased to 122° while 16.5PUF decreased to 65°. The decrease in the hydrophobic property can be ascribed to possible alkali-silica-reaction (ASR) occurring on the sample’s surface. Researchers have shown that ASR occurs in the presence of reactive silica, high hydroxyl ion concentration (especially from NaOH), and sufficient moisture. Hence, it is believed that the hydroxide ions could break apart the bonds between adjacent silicon groups in a silane, or break the bond between the silane and the substrate [43].The hydrophobic recovery patterns of the samples were monitored as revealed in Fig. 6(a), both samples recovered fully to their initial water contact angles after three (3) days.
Fig. 6.
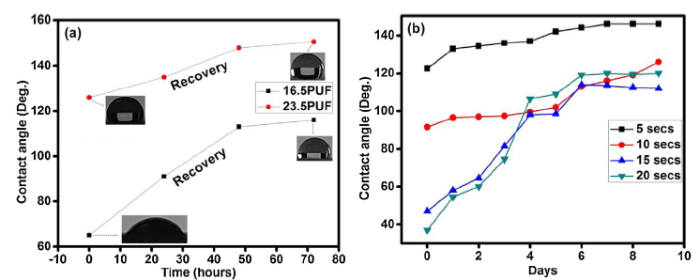
Fig. 6.
Hydrophobic recovery of the samples after immersion in alkaline solution (a), and oxygen plasma etching (b). Inserts are the images of the water droplets on the coatings.
In contrast, other coatings were produced using empty microcapsules without fluorosilane core content. The coatings were immersed in acid and alkaline media and afterward exposed to atmospheric aging. The results revealed that the water contact angles of the coatings decreased after immersions and no hydrophobic recovery occurred after prolonged exposure (Table S1 in supplementary material). This confirmed that the recovery observed in 16.5PUF and 23.5PUF is as a result of the released of the fluorosilane from the microcapsules. To further evaluate the self hydrophobic recovery ability of the coatings, the superhydrophobic sample was subjected to the oxygen plasma etching process. This is done to minimize the presence of hydrophobic species on the surface of the coatings, hence, decreasing the water contact angle. The 23.5PUF sample was etched for 5, 10, 15 and 20 s, after which the contact angle was reduced to 122°, 91.5°, 47°, and 37° respectively. The etched samples were aged at room temperature for nine (9) days and the recovery process was monitored and presented in Fig. 6(b). The samples offered significant recovery of the hydrophobic properties after the initial loss; this hydrophobic recovery can be attributed to the effect of atmospheric moisture on the UF microcapsules which necessitated the release of the fluorosilane as earlier discussed.
To further understand the self-recovery behavior of the etched samples, XPS measurement was employed to analyze the chemical composition of the film surface after the oxygen plasma etching and 9-days atmospheric exposure. As seen in Fig. 7, the longer the etching time, the smaller the peak intensities signifying a decrease in the quantity of each element present in the film’s surface. Fig. 7(b) shows a higher presence of fluorine element (hydrophobic species) on the surface of the sample after 9-days of self-repairing when compared to the samples in Fig. 7(a). This is a strong indication of hydrophobic self-recovery. Furthermore, the F1 s spectra were deconvoluted to effectively reveal the compounds present on the film surface. The deconvolutions of the peaks of the spectra were done using a non-linear least-squares algorithm with a combination of Shirley baseline and Gaussian-Lorentzian [44]. In Fig. 8, the binding energy peaks at 689.4/690.3 eV and 688 eV correspond to CF2-CF2 and CF2-CH2 respectively [45,46]. As observed in Fig. 8(a-d), CF2-CF2 is absent in the etched samples, with the exception of the sample etched for five seconds indicating the effect of etching time on the disappearance of CF2-CF2. In Fig. 8(e-h), the peak for CF2-CF2 is present in the sample after 9-days of atmospheric exposure revealing the self-repairing effect of the coating. This observation is validated further using the C 1s deconvoluted peaks shown in Fig. 9. As expected, the sample etched for five seconds (Fig. 9a) exhibited a peak at binding energy 292 eV which is ascribed to CF2-CF2 [47], while the samples etched for 10-20 seconds did not show the peak for CF2-CF2. Interestingly, for the etched samples exposed for 9-days, the peak for CF2-CF2 can be seen at binding energies 291 eV and 292 eV, which indicates the recovery of hydrophobicity. It is important to note that there is a negligible change in the Si peaks of the etched samples after 9-days of atmospheric recovery as seen in Figs. 7 and S2. The binding energy peak at 103 eV corresponds to the Si-O-Si bond [48].
Fig. 7.
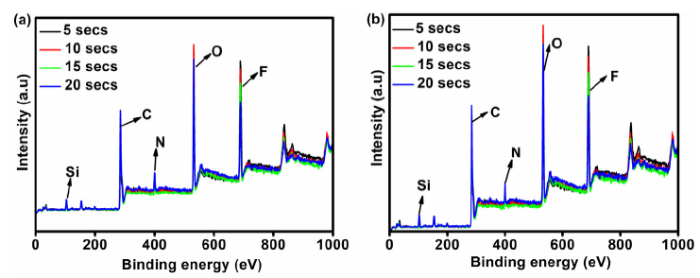
Fig. 7.
XPS spectra of the samples: (a) immediately after plasma etching, (b) after 9-days of self-repairing process.
Fig. 8.

Fig. 8.
F 1s deconvoluted spectra of the plasma etched sample: (a-d) immediately after plasma etching, (e-h) after 9-days of self-repairing process.
Fig. 9.
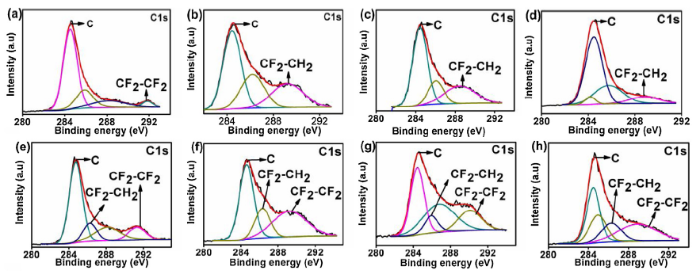
Fig. 9.
C 1s deconvoluted spectra of the plasma etched sample: (a-d) immediately after plasma etching, (e-h) after 9-days of self-repairing process.
The wettability response of the coatings to mechanical damage was determined by using JV-IV wear tester to scratch the surfaces of the coating. 1000 grit sandpaper was attached to the machine and a load of 500 g was placed on the sample as shown in Fig. S3; the rotation speed was fixed at 60 rpm and allowed to last for 4 turns. After the scratch, there is an appreciable increase in the contact angles for both samples; 16.5PUF increased from 113° to 125° water contact angle, while 23.5PUF increased from 151° to 155°, and the sliding angle decreased from 19° to 9°. This increase in water contact angle largely depends on the change in the surface morphology of the coatings as revealed in Fig. 10. Before the mechanical damage, the microcapsules are largely covered by the fluorocarbon resin, and the surface roughness is not well developed, however, after the test, the covering provided by the fluorocarbon is seen to have been removed by the sandpaper and the surface roughness appears to be more developed (also see Fig. S4).
Fig. 10.
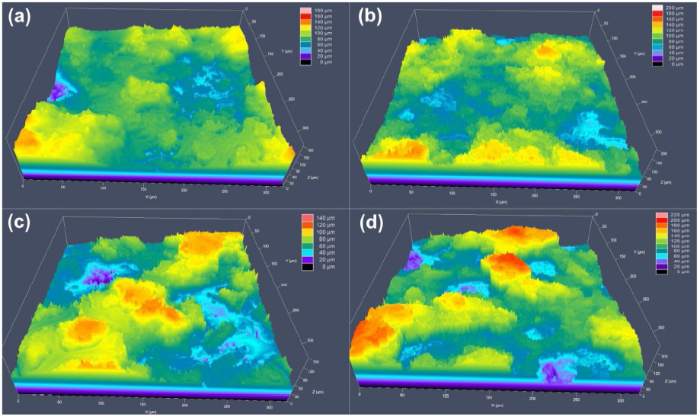
Fig. 10.
LCSM images of the samples before and after mechanical damage test. (a) 16.5PUF and (b) 23.5PUF before the test, (c) 16.5PUF and (d) 23.5PUF after the test.
3.5. UV accelerated aging test wettability response
The coatings were exposed to QUV accelerated weathering test for 293 h and the results revealed that the water contact angle increased for the samples containing microcapsules while the control sample remained unchanged after the exposure. 16.5PUF sample increased to 132°, while the 23.5PUF sample increased to 158° with 5° sliding angle. These increases in the water contact angles are due to the change in the surface roughness and surface chemistry of the samples as shown in the LCSM (Fig. 11) and SEM/EDX (Fig. S5) results.
Fig. 11.
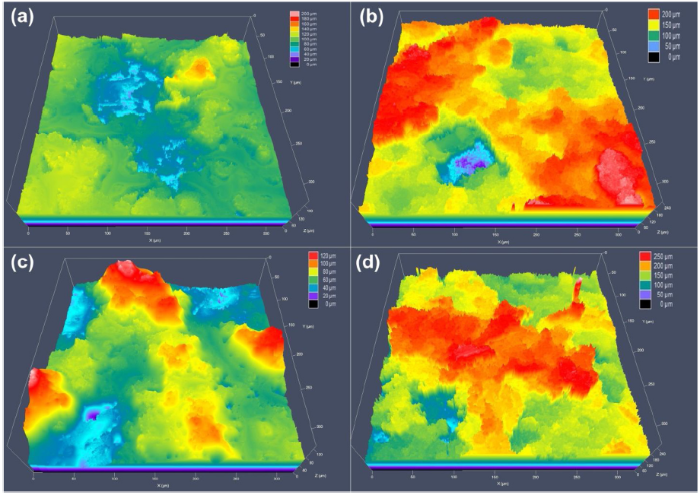
Fig. 11.
LCSM images showing the surface roughness of the samples before and after the QUV accelerated weathering test: (a) 16.5PUF and (b) 23.5PUF before the test, (c) 16.5PUF and (d) 23.5PUF after the test.
The LCSM pictures revealed an observable increase in the average surface roughness (RSa) for the samples. The RSa values for 16.5PUF increased from 14.396 μm to 17.438 μm, and the 23.5PUF RSa values increased from 25.625 μm to 31.24 μm. The change in the surface roughness can be attributed to the breaking of the microcapsules which was a result of cyclic moisture attack as earlier discussed. The SEM/EDX plots revealed a significant presence of Si and fluorine elements on the 16.5PUF and 23.5PUF surfaces. The release of the low surface energy materials onto the samples surfaces was further confirmed from the normalized FTIR spectra in Fig. 12. The higher peak intensities at 1000-1150 range for 16.5PUF and 23.5PUF samples indicate that there are higher presences of Si-O-Si linkages on the surfaces of the samples after the accelerated weathering test. Similar results have been shown elsewhere [33].
Fig. 12.
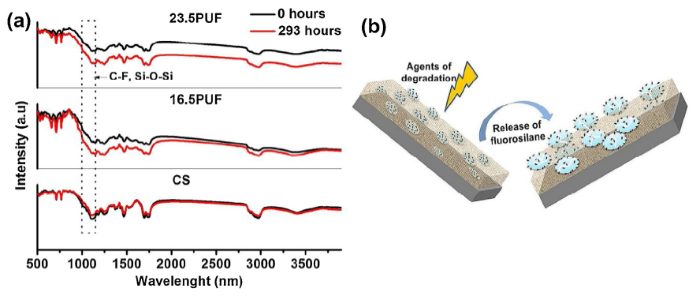
Fig. 12.
(a) FTIR spectra of the coatings after QUV accelerated weathering test, (b) The schematics representing the release of the fluorosilane from the coatings during the test.
As shown in Fig. 12, there is no significant change in the FTIR spectra of the fluorocarbon resin indicating that the resin was stable throughout the exposure time. It, therefore, suggests that only the urea-formaldehyde microcapsules were degraded during the accelerated aging time. This degradation is believed to have triggered the release of the fluorosilane to the surface of the microcapsules thereby causing the water contact angle to rise. Interestingly, the aging process of UF is known to involve the liberation of formaldehyde. Also, from Fig. 1 we observed that the formation of urea-formaldehyde is a reversible condensation process that removes water in the forward direction, therefore, the backward direction involves hydrolysis. This reversible dissociation of ether linkages and methylene bridges is the reason urea-formaldehyde possesses low resistance against water and humid environment. The vulnerability of the UF products to hydrolytic degradation is known to largely depend on its chemical structure and the extent of cross-linking, and it could be accelerated by the strong acid environment and high temperature [49]. As expressed in Eqs. (1) and (2), the ether linkage was first broken into urea methylol groups, and further broken into urea and formaldehyde.
3.6. Anticorrosion performance
3.6.1. EIS measurements
To investigate the impact of the fluorosilane encapsulated microcapsules on the anticorrosion properties of the coatings, the coated samples were immersed in 3.5% NaCl solution and Electrochemical Impedance Spectroscopy was used to evaluate their anti-corrosion performance for a period of 360 h. Firstly, the impedance modulus obtained at the lowest frequency |Z|0.01 Hz of Bode plots is used as an appropriate standard for comparing the corrosion resistance of the various coatings [1]. Fig. 13 reveals a general decrease in impedance values of the CS sample from 4.37 × 10⁷ Ohm. cm2 at 0.5 h of immersion to 2.21 × 10⁶ Ohm. cm2 after 360 h. This is due to the degradation of the protective coating as the immersion time increases. Contrastingly, the microcapsule filled coatings 16.5PUF and 23.5PUF demonstrated a recovery of impedance after initial periods of descent. The initial impedance values of 16.5PUF and 23.5PUF samples are 6.54 × 10⁷ Ohm. cm2 and 6.83 × 10⁷ Ohm. cm2 respectively, however, after the drop in impedance values and subsequent recovery, the final impedance values at 360 h are 1.04 × 10⁷ Ohm. cm2 and 2.25 × 10⁶ Ohm. cm2 for 16.5PUF and 23.5PUF respectively. This implies that at the initial stage of immersion, the 23.5PUF sample has a higher anti-corrosion performance compared to the other coatings due to its superhydrophobic surface, but, as immersion time progresses, there tend to be a collapse of the air bubbles on the surface, followed by an erosion of the surface roughness; the key factors necessary for superhydrophobicity [41,42]. As a result, there is an ingress of electrolytes into the coating/substrate interface resulting in the drop in impedance value. However, as the fluorosilane within the shell is released, the penetration of electrolyte is hindered thereby causing recovery of the impedance values. Interestingly, 16.5PUF exhibited a significant sustainable impedance recovery up to 107 magnitudes the same as the initial impedance value indicating that the corrosion activity on the coating was substantially inhibited. Also, the identical frequency of the resistive plateaus (between 10-2 - 102 Hz) and the capacitive arcs (between 103 - 105 Hz) from 4 h to 360 h of immersion confirms the stability of the 16.5PUF coatings against electrolytic attacks.
Fig. 13.
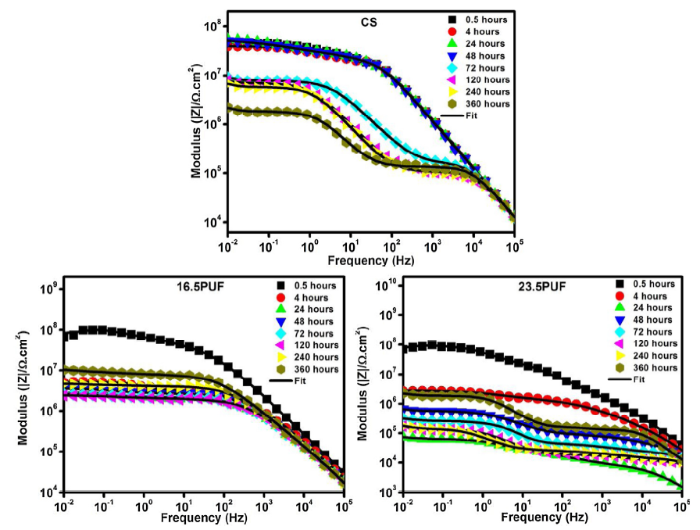
Fig. 13.
Bode spectra showing the evolution of the impedance modulus against the frequency with immersion time for the different coatings.
The Bode phase angle spectra of the coatings are shown in Fig. 14, the spectra can be rightly categorized into three which are the high-frequency peak (103-105) that describes the response of the coatings, followed by the intermediate frequency peak (1 - 102) which reveals the response of the aluminum oxide layer and thirdly, the peak at the low-frequency region (10-1- 10-2) which could be attributed to aluminum corrosion. The narrowness of the peaks of the CS sample at the high-frequency region from 48 h of immersion showed the onset of the penetration of electrolytes into the coating and did not show any sign of recovery afterward. However, both 16.5PUF and 23.5 PUF showed recovery as indicated by the increase in arc diameter at the high-frequency region after the initial period of decrease.
Fig. 14.

Fig. 14.
Bode spectra showing the evolution of the phase angle against the frequency with immersion time for the different coatings.
The Electrical Equivalent Circuits (EEC) in Fig. 15 was adopted to approximately fit the Bode spectra, and also use to describe the electrochemical response of the physical process happening in the coatings. The EEC model offered a good fit (x2 < 0.01) and also contains all agreeable capacitive and resistive elements seen in a coating system. The elements include the resistances of the solution (Rs), coating (Rc), oxide (Rox), charge transfer (Rct), and diffusion (Rw). It also contains the constant phase elements representing the coating (CPEc), oxide (CPEox), charge transfer (CPEct), and diffusion (CPEw). ‘W’ and ‘L’ represent the Warburg finite diffusion and the inductance respectively. In order to account for the dispersive nature of the time constants due to the nonuniformity of the coating layers, we used constant phase elements in place of capacitances. The EECs with three-time constants in Fig. 15(a) and (b) were used to fit the Bode spectra of the CS sample throughout the immersion period. This suggests that at the initial stages of immersion (0.5-48 h) there is a corrosion process occurring at the substrate/metal interface but it is not largely pronounced resulting in an overlapping of the time constants. At 120 h of immersion, the EEC in Fig. 15(b) was used to model the coating system suggesting that the Faradaic process at this stage is diffusion controlled. For the 16.5PUF sample, EEC in Fig. 15(c) was used to fit 0.5-4 h of immersion indicating the deposition of passive layers on the substrate/coating interface. Fig. 15(a) approximately fits the remaining hours of immersion; this suggests the disappearance of the passive layer, and also an overlapping of the time relaxation constants, further proving that there was no significant corrosion process on the substrate throughout the immersion time. Fig. 15(c) was used to fit the 23.5PUF sample at 0.5 h of immersion, while Fig. 15(a) fits the immersion at 4 h. However, the EEC in Fig. 15(d) fits the remaining time of immersion revealing the time constant associated with mass transport of corrosive species.
Fig. 15.
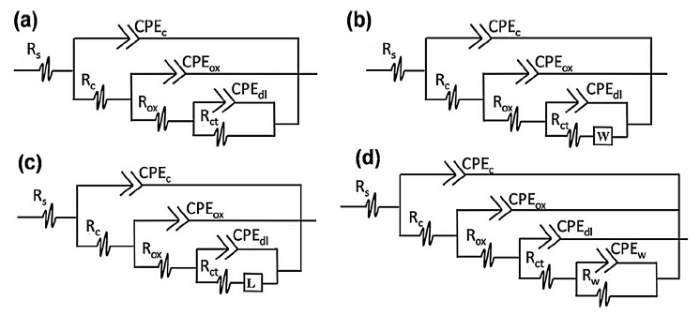
Fig. 15.
Equivalent electrical circuits (EEC) used to fit the EIS spectra during the 360 h of immersion.
The coating capacitance (Cc) relates to the water permittivity of the coating [50]. The relationship between the values of the EEC elements and the physical properties of the coatings is expressed as Cc = εε0A/d, where ε is the dielectric constant of the coating, ε0 is the permittivity of vacuum (8.85 × 10⁻¹⁴ F/cm), A is the surface area of the electrode and d is the coating’s thickness [1]. From Fig. 16(a), there is no significant change in the Cc values of the CS coating throughout the immersion time indicating minimal microscopic pores and lower diffusion pathways in the coating. 16.5PUF sample showed the highest Cc value at the initial immersion time probably due to the uneven distribution of the microcapsules in the coating as shown in Fig. 17(b). These could lead to defects in the coatings resulting in micro-holes acting as water diffusion pathways. However, there is a sharp decrease in the Cc value at 24 h of immersion which remained steady throughout the immersion time. This can be a result of the release of the fluorosilane in the microcapsule which hindered the water from penetrating into the coating. The 23.5PUF sample gave the least Cc value as a result of its superhydrophobic nature; but the loss of the superhydrophobic property increased the Cc value at 24 h of immersion, however, the release of the fluorosilane from the microcapsules inhibited the water diffusion as immersion time progresses. In general, the final values of Cc obtained for microcapsule containing coatings are lower than that of CS samples indicating the water-repelling effects of the microcapsule content.
Fig. 16.
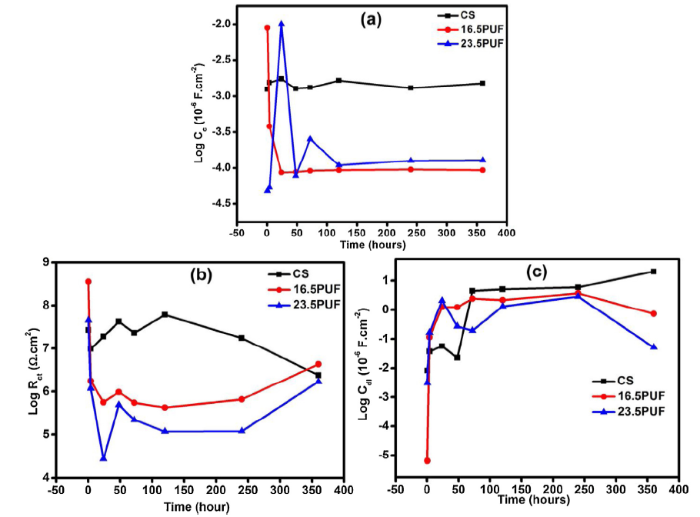
Fig. 16.
Evolution of (a) coatings capacitance (b) charge transfer resistance and, (c) double layer capacitance with immersion time.
Fig. 17.
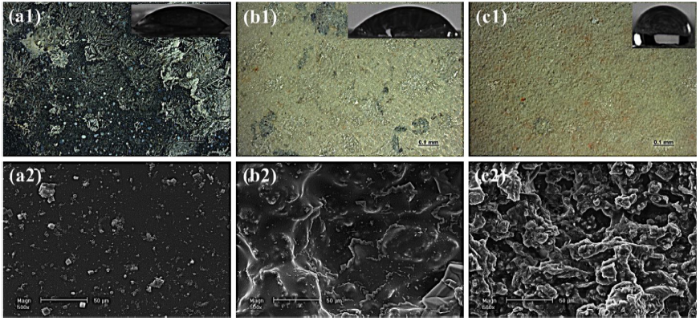
Fig. 17.
Images of the samples after EIS measurements: (a) CS (b) 16.5PUF (c) 23.5PUF. ‘1′ and ‘2′ are the digital micrographs and SEM images respectively. Inserts are the images of the water droplet on the surfaces of the coating.
The charge transfer resistance (Rct) as shown in Fig. 16(b) describes the rate of corrosion. It reveals the kinetics of the electrochemical reactions occurring at the interface and is directly dependent on the water-repelling ability of the coating [51]. The overall increase in the Rct values after the initial drop as seen in the microcapsule-containing coatings can be attributed to the corrosion inhibiting actions necessitated by the release of the water-repelling fluorosilane from the microcapsules. The double-layer capacitance (Cdl) is known to be directly related to the area exposed to the electrolyte. This exposed area can be from the delamination of the coating, and it tends to propagate as coatings degradation continues [50]. In addition, it gives information on the wet adhesion of the coating to the substrate. The less Cdl values obtained for 16.5PUF and 23.5PUF as seen in Fig. 16(c) signifies smaller exposed areas and can be a result of the low extent of corrosion and suppressed corrosion evolution due to the water-repelling effect of the released fluorosilane.
Interestingly, the water contact angle of 23.5PUF after 360° hours of immersion is 120°, an indication that the surface is still hydrophobic. However, CS and 16.5PUF samples became hydrophilic with 45° and 52° water contact angles respectively. Furthermore, there are no observable active corrosion sites on the samples surfaces as seen in the SEM images (Fig. 17); this is also supported by the EDX results in Fig. S6.
3.6.2. SVET measurements
Fig. 18.
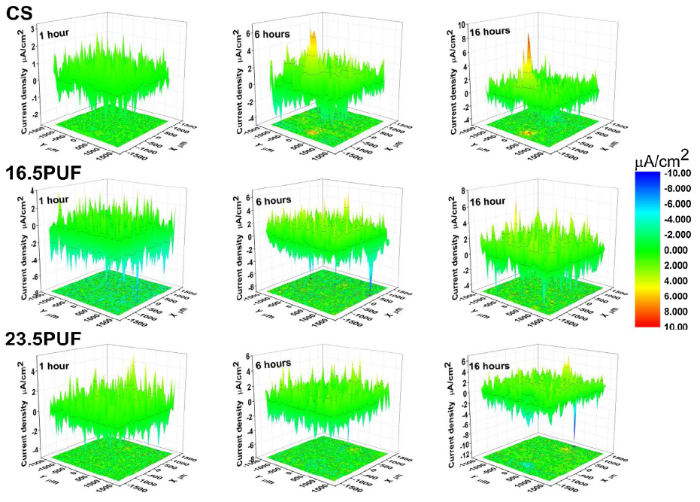
Fig. 18.
SVET current density maps of the coated samples immersed in 0.1 M NaCl solution.
For the CS sample, the maps showed a trend of increase in the anodic current density at the point of defects from 6.71 μA/cm2 after 6 h of immersion to 7.76 μA/cm2 after 16 h of immersion, this was accompanied by gradual expansion of the cathodic current density without any significant reduction throughout the immersion time. In contrast, the 23.5PUF and 16.5PUF samples revealed a general trend of suppression of corrosion activities throughout the immersion time, interestingly; the 16.5PUF sample did not show any obvious sign of strong anodic currents nor weak cathodic current at the points of artificial defects. Also, 23.5PUF sample revealed a minimal corrosion activity at the point of artificial defects only at 16 h of immersion. In addition, from the optical images in Fig. 19, we observed a higher presence of corrosion products at the points of artificial defects after prolonged immersion on the CS sample; this is an indication of the delamination of the coatings as a result of the penetration of the electrolytes through the artificial defects.
Fig. 19.
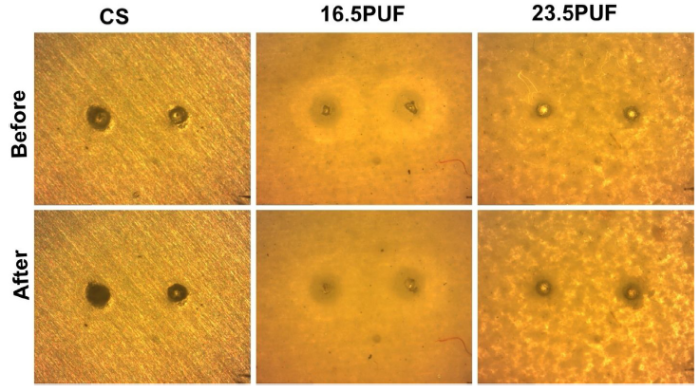
Fig. 19.
Optical images of the artificial defects on the coated samples before and after SVET measurements.
3.7. Pull-off adhesion performance
The pull-off adhesion strength for CS, 16.5PUF and 23.5PUF are 2.4 MPa, 2.2 MPa, and 2.3 MPa. These results are similar indicating that there is no significant change in the adhesion strength as a result of the addition of microcapsules. Furthermore, the evaluation of the failure mode as shown in Fig. S7 reveals that adhesive failure occurred in the 16.5PUF sample since the coating failed at the substrate, while 23.5PUF samples had a cohesive failure because the coatings failed within the layer.
4. Conclusion
We have been able to develop multi-stimuli responsive microcapsules with good thermal stability and resistance to low polar solvents. This is made possible by microencapsulation of the low surface energy material (fluorosilane) via interfacial polymerization of urea and formaldehyde monomers. Under atmospheric exposure, the microcapsules are found to release their core content resulting to surface chemistry modification thereby making them superhydrophobic. When the microcapsules were mixed with GK570 resin and sprayed on the LY12 aluminum alloy substrate, they offered good adhesion property because there is minimal direct contact between the low surface energy material and the substrate since they are largely enclosed in the microcapsules. This is significant progress since it addresses the surface adhesion problem often encountered in superhydrophobic coatings. Furthermore, on exposure to harsh environmental conditions, the water contact angles increased due to the quick response of the microcapsules, and in the case of loss in hydrophobic property, the trend of hydrophobic recovery is remarkable. The coatings offered good corrosion protection because from the electrochemical tests we observed a significant suppression of evolution of corrosion process as a result of the release of the microcapsules core content which in turn inhibited the ingress of corrosive species into the coatings.
Author contributions
The manuscript was written through the contributions of all authors. All authors have given approval to the final version of the manuscript.
Declaration of Competing Interest
The authors declare no competing financial interests.
Appendix A. Supplementary data
Supplementary material related to this article can be found, in the online version, at doi:https://doi.org/10.1016/j.jmst.2019.11.022.
Acknowledgment
The authors acknowledge the financial support from the Shenyang Science and Technology Plan Project (Y17-1-039).
Reference

 WeChat