Search for articles:
XiTing Zhong , Feng Liu
Corresponding authors:
Received: 2019-07-18
Revised: 2019-08-16
Accepted: 2019-08-17
Online: 2020-04-01
Copyright: 2020 Editorial board of Journal of Materials Science & Technology Copyright reserved, Editorial board of Journal of Materials Science & Technology
More
Abstract
Dynamic recrystallization (DRX) plays significant roles in manipulating of microstructures during hot deformation and the result mechanical properties; however, the underling mechanism leading to multi scale-microstructures remains poorly understood. Here, the DRX mechanism under wide processing conditions (i.e. 950-1200 °C, 0.001-10 s-1) in Incoloy 028 alloy was investigated, where the relationships among flow stress, Z parameter and grain size, as well as the evolution of characteristic microstructures (grain size, sub-grain boundaries, and high angle grain boundaries), are established. As the values of Z parameters decrease (corresponding to decreased flow stresses), three typical softening mechanisms successively occur, ranging from continuous DRX controlled by dislocation glide, discontinuous DRX dominated by dislocation motion (climb and cross/multiple slip) and grain boundary migration, to dynamic normal/abnormal grain growth resulting from grain boundary migration, with transition regions where two adjacent mechanisms occur simultaneously. Correspondingly, these above three softening mechanisms result in ultrafine, fine and coarse grains, respectively. The present findings demonstrate a comprehensive understanding of DRX mechanism over a wide range of processing conditions, and further provide a new guideline for preparing single crystals.
Keywords:
Hot working accompanied by dynamic recrystallization (DRX) plays a crucial role in the formation of multi-scale structures in various metals and alloys, and hence has been a subject of fundamental research and industrial application for decades [[1], [2], [3], [4], [5], [6]]. Generally, the mechanism responsible for the microstructural evolution during hot deformation can be clarified as discontinuous dynamic recrystallization (DDRX) and continuous dynamic recrystallization (CDRX) [1,2]. As an efficient dynamic softening process, the DDRX involves two stages: nucleation and growth, where new grain is nucleated by bulging of serrated grain boundaries (GBs) [7,8], typically in materials with low to medium stacking fault energy (SFE) under hot deformation [1]. In contrast, the CDRX is accomplished by the formation of high angle grain boundaries (HAGBs) gradually by increasing the misorientation angle of low angle grain boundaries (LAGBs), as commonly used to develop ultrafine grained structures in a wide variety of structural metals and alloys in severe plastic deformation [[9], [10], [11]].
Generally, the mechanisms regarding the CDRX and DDRX processes have been independently investigated, while extensive experiments demonstrated that CDRX and DDRX could take place simultaneously under certain thermo-mechanical conditions (e.g. warm deformation). For example, it is shown [7,[12], [13], [14]] that the nucleation process for the typical DDRX structure (necklace structure) can be assisted by the formation of HAGBs through the development of sub-boundaries, as one of the CDRX features. Furthermore, the variation of deformation condition could lead to a transformation between CDRX and DDRX [[15], [16], [17], [18], [19]]. For example, the dominated mechanism for microstructure evolution was shown to shift from DDRX to CDRX which can be realized by increasing strain (ε) in Magnesium alloy [15], decreasing deformation temperature (T) and/or increasing strain rate ($\dot{ε}$) in IN718 superalloy [16], ZK60 [17] and Titanium [18]. In addition, in the middle Zener-Hollomon parameter (Z) values, the mechanism transforms from CDRX to DDRX with decreasing T and/or increasing $\dot{ε}$, is observed in Inconel 718 and ALLVAC 718 Plus [19]. On this basis, whether CDRX and DDRX occur simultaneously or transform to each other, therefore, is highly related to the deformation conditions (T, $\dot{ε}$, ε). Yet, present studies mainly focus on the mechanisms of CDRX and/or DDRX upon relatively limited thermo-mechanical conditions, and hence a comprehensive understanding of underlying mechanism regarding the DRX transition phenomena over a wide thermo-mechanical condition has not been provided. The main motivation of this work, therefore, is to investigate transition mechanism of DRX during hot deformation and to explore its potential application in manipulating the microstructure.
In this paper, using Incoloy 028 austenitic stainless steel as a model system, we thoroughly investigated the true stress-strain behavior and the microstructure evolution under the temperature range of 950 °C - 1250 °C and strain rate range of 0.001-10 s-1 by means of thermo-mechanical simulation, Electron Backscattered Diffraction (EBSD) and Transmission Electron Microscope (TEM). On this basis, the transition of DRX mechanism is elaborated by the comparative analysis between flow stress behavior and microstructure evolution. Further, we propose a strategy to fabricate multi-scale grains with different substructures.
Incoloy 028 alloy with the chemical composition (Ni-27Cr-29Fe-0.03C-3.5Mo-2.5Mn - 1.0Cu, all in wt.%) was studied here. The specimen was solution treated at 1200 °C for 2 h followed water quenching to room temperature. Isothermal constant strain rate compression tests were carried out on a Gleeble 3500 thermo-mechanical simulator using the cylindrical specimens of 8 mm in diameter and 12 mm in height. Tantalum foils were applied between specimens and the platens to minimize the friction during deformation. The deformation sample was heated to 1200 °C at a rate of 30 °C/s, holding for 5 min, then cooled to the deformation temperature (950-1200 °C, in steps of 50 °C) at a rate of 10 °C/s, and held for 30 s to homogenize the internal temperature. At deformation temperature, compression tests corresponding to different height reductions were conducted under the strain rate range of 0.001-10 s-1. After deformation, specimens were water quenched to freeze the hot deformed microstructure.
Microstructural observation of the deformed specimens on the section parallel to the rolling axis was performed via Scanning Electron Microscope (SEM) equipped with an EBSD detector. For EBSD observations, samples were electro-polished with a solution of 10 % perchloric acid in ethanol at 20 V for 30 s at room temperature. The electro-polished specimens were checked on a TESCAN MIRA3 XMU SEM with the operating voltage of 20 kV and the working distance of 15 mm. The data analysis was carried out using the HKL-Channel 5 software. Furthermore, to observe the morphology of deformation substructures in the alloy, the foils for TEM were prepared by standard procedures of mechanical grinding to 40-60 μm and ion milling. TEM examination was made on a Philips TENCAL-20 microscope operated at 200 kV. Recrystallized grain size was measured by the mean linear intercept method.
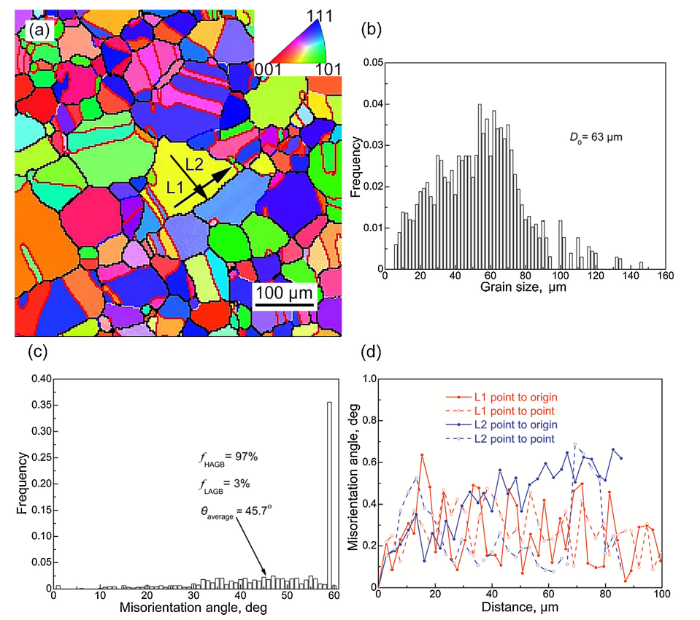
The orientation imaging microscopy (OIM) map of solution treated Incoloy 028 alloy is shown in Fig. 1, where randomly oriented equiaxed grains with straight GBs and annealing twin boundaries are observed. Correspondingly, the average grain size (D0) is estimated as 63 μm based on the statistical distribution (Fig. 1b) and the fractions of HAGBs and LAGBs are evaluated as 0.97 and 0.03 (see Fig. 1c), respectively. Further examination of the changes of misorientation angle in grain interior suggests the dislocation/substructure-free feature, as typically shown in Fig. 1d, where both the point to point (local) and point to origin (cumulative) misorientation are no more than 1°.
Fig. 1. Microstructure of solution treated specimen before hot deformation: (a) Orientation imaging microscopy (OIM) map, (b) grain size distribution, (c) misorientation angle distribution, (d) misorientation angle changes along the lines marked L1 and L2. Black and red lines represent grain boundaries with misorientation angle greater than 15° (HAGB) and twin boundary. Colors correspond to crystallographic orientations indicated in inverse pole figure (IPF).
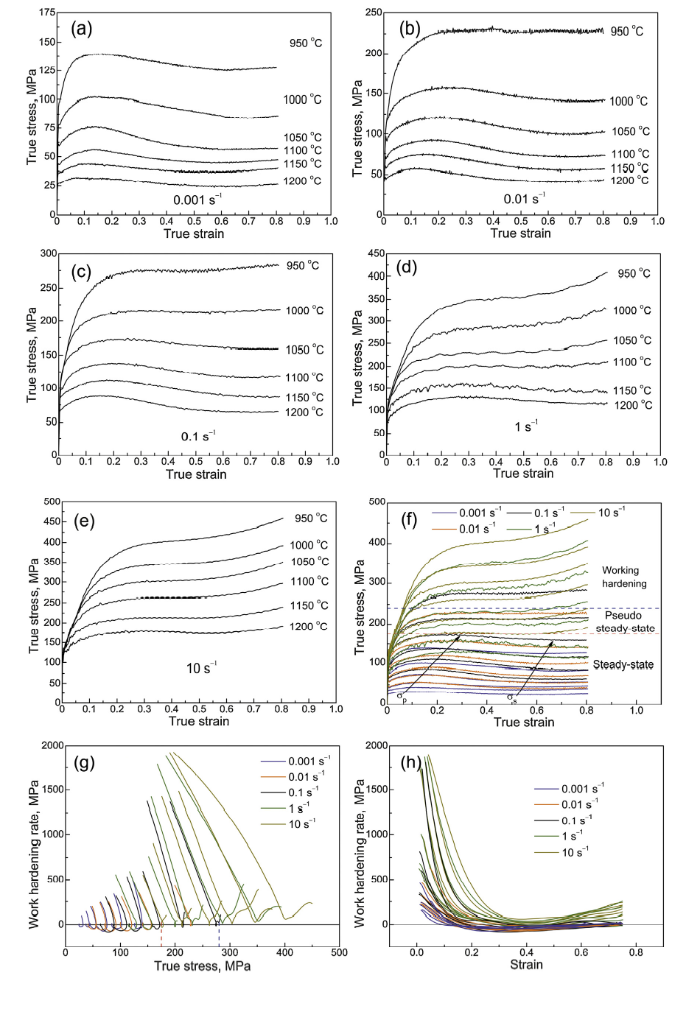
Fig. 2 shows a series of true stress-true strain (σ-ε) curves and corresponding work-hardening rate ($θ=\frac{\partial σ}{\partial ε}$) [1,20] of Incoloy 028 alloy under wide deformation conditions (950-1200 °C, 0.001-10 s-1). With decreasing T and increasing $\dot{ε}$ , the overall level of the flow stresses (Figs. 2a-e) increases, and the σ-ε curves exhibit different shapes with strain. Namely, the steady-state flow (significant peak stress σp and steady state stress σs), the pseudo steady-state flow (no σp, but σs) and the work hardening flow (no significant σp and σs), as shown in Fig. 2f. Correspondingly, three forms of work-hardening rate curves in Fig. 2g are classified through the size relationship between the minium work-hardening rate (θmin) and 0, where θmin is the major parameter for the deformation behavior evolution [21], i.e. less than 0, approximately equal to 0 and greater than 0. The curves of work-hardening rate with strain under different deformation conditions are presented in Fig. 2h.
Fig. 2. Experimental flow stress-strain curves and corrected ones for Incoloy 028 alloy deformed at different strain rates within temperature range of 950-1200 °C: (a) 0.001 s-1, (b) 0.01 s-1, (c) 0.1 s-1, (d) 1 s-1, (e) 10 s-1, (f) all flow stress curves and (g) (h) work-hardening rate under different deformation conditions.
Therefore, three different deformation behaviors can be distinguished. At high T and low $\dot{ε}$, corresponding to relatively low flow stresses (below 170 MPa), the steady-state σ-ε curves display distinct σp and constant σs, attesting to typical characteristics of the DDRX flow curve [[1], [2], [3],22]. On the other hand, work hardening dominates (θmin >0) at low T and high $\dot{ε}$ with large flow stresses over 300 MPa, displaying the CDRX mechanism [[1], [2], [3],23]. Besides the two typical flow curves, a transition zone in the moderate flow stress region corresponding to the simultaneous occurrence of DDRX and CDRX is manifested.
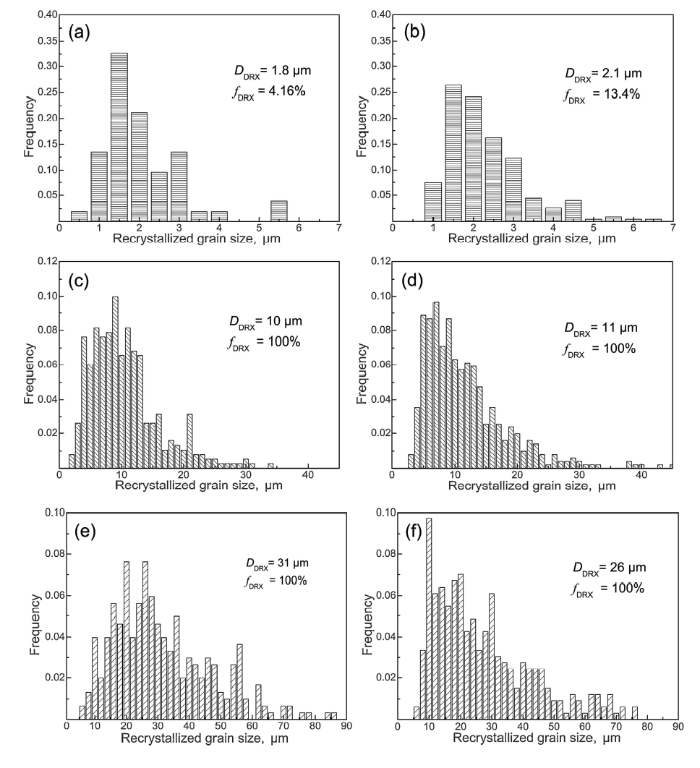
Typical microstructures and recrystallized grain size distributions at the true strain of 0.916 are presented in Fig. 3, Fig. 4. Generally, with the decrease of σ, the recrystallized volume fraction (fDRX), the average DRX grain size (DDRX) and the distribution range increase, while the number of deformation substructures decrease. For the high σ, as shown in Fig. 3a and b, the microstructure is composed of elongated original grains within abundant deformation sub-boundaries, and a couple of micrometer scale grains around initial GBs which are perpendicular to the rolling axis. Accordingly, the histograms in Fig. 4a and b present uniformly average DDRX (∼2 μm) with small fDRX (< 15 %). Corresponding to the low σ region, the representative DDRX microstructures are shown in Fig. 3e and f, where the deformed microstructures are completely replaced by the relatively uniform and dislocation-free grain structures. The distribution of recrystallized grain sizes are wide (5-90 μm), and the DDRX are about 30 μm, see in Fig. 4e and f. Moreover, the microstructures of moderate σ region in Fig. 3c and d show a completely uniform and fine dislocation-free recrystallized microstructure, and the average grain size is about 10 μm (Fig. 4c and d).
Fig. 3. Microstructures of Incoloy 028 alloy hot deformed to a true strain of 0.916 at various deformation conditions: (a) 950 °C, 1 s-1; (b) 1050 °C, 10 s-1; (c) 1050 °C, 1 s-1; (d) 1200 °C, 10 s-1; (e) 1200 °C, 1 s-1; (f) 1150 °C, 0.01 s-1. White, black and red lines represent grain boundaries with misorientation angles: 1∼15° (LAGBs), greater than 15° (HAGBs) and twin boundaries, respectively. The IPF indicating the colors correspond to crystallographic orientations is shown for the compression axis (C. A.).
Fig. 4. Recrystallized grain size distribution by various deformation conditions to a true strain of 0.916: (a) 950 °C, 1 s-1; (b) 1050 °C, 10 s-1; (c) 1050 °C, 1 s-1; (d) 1200 °C, 10 s-1; (e) 1200 °C, 1 s-1; (f) 1150 °C, 0.01 s-1.
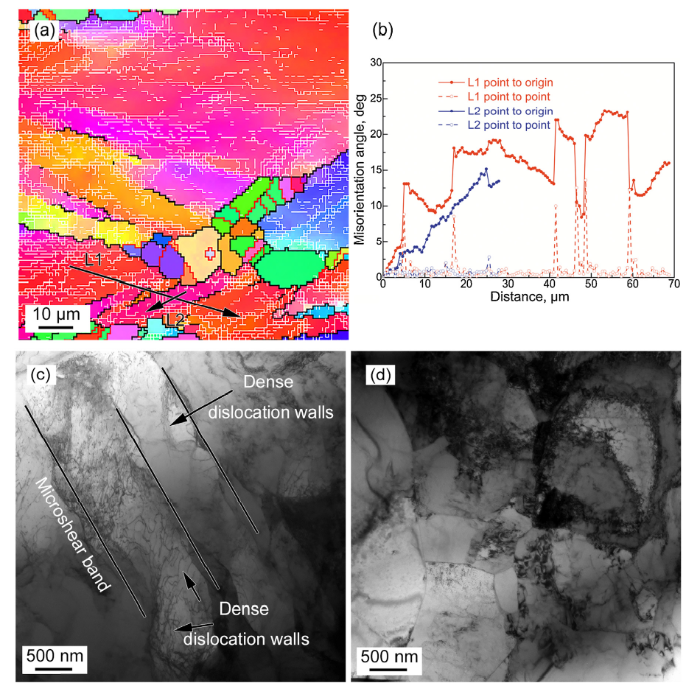
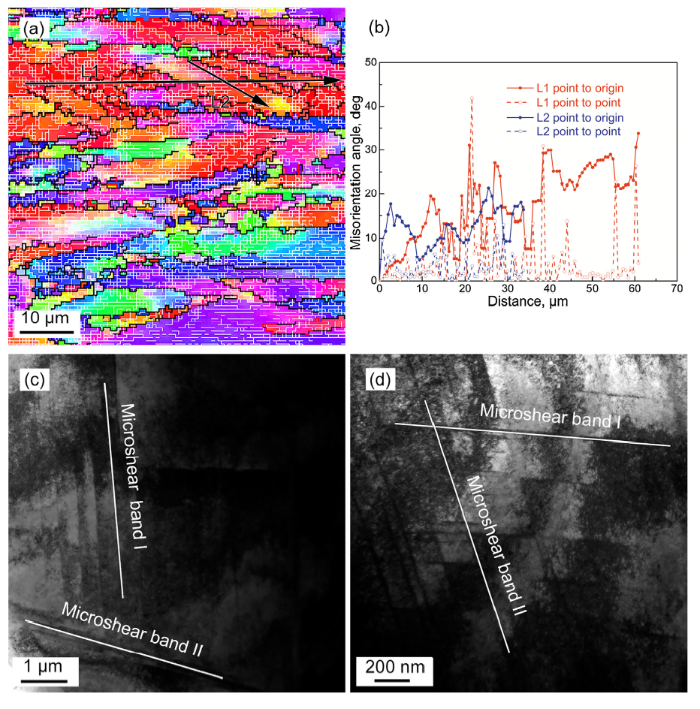
Typical microstructures corresponding to the high σ region are displayed in Fig. 5, Fig. 6. The structural changes at T = 1050 °C, $\dot{ε}$= 10 s-1 and ε = 0.6/0.916, are exhibited in Fig. 5, where, numerous parallel LAGBs are formed inside the initial grains, and some recrystallized grains evolve at the original GBs. Particularly, some discontinuous HAGBs appear in the deformed grains (Fig. 5a) through the development of deformation induced sub-boundaries, implying the operation of CDRX. In addition, typical misorientation variations within a deformed grain next to the recrystallization zone are presented in Fig. 5b. Based on the periodically fluctuated platforms of cumulative misorientation larger than 15°, it can be confirmed that several parallel band-like microstructures are formed along the initial GBs (line L1) in deformed grains [11,24,25]. Furthermore, the cumulative misorientation in the microband (line L2) gradually increases to 14°, demonstrating the strain gradient in the deformed grain, which will transform into HAGBs. The corresponding TEM micrograph of dislocation substructures developed at the strain of 0.6 is shown in Fig. 5c. Accordingly, the alignment of strain induced sub-boundaries, i.e. MSBs and dense dislocation walls (DDWs), form in the deformed grain, which is consistent with Fig. 5a and b. Besides, there are numerous sub-grain boundaries in the MSBs, illustrating the strain gradient in the MSBs which gradually rotate into HAGBs. Therefore, fine recrystallized grains are generated with the development of MSBs and sub-grain rotation, as shown in the micrograph at a strain of 0.916 (Fig. 5d).
Fig. 5. Microstructure (a) and changes of misorientation angle along the lines marked by lines L1 and L2 (b) deform at 1050 °C and 10 s-1 to true strain of 0.6. TEM micrographs of the specimen deformed at 1050 °C with the strain rate of 10 s-1 to (c) 0.6, (d) 0.916. The colors and line styles in the OIM micrographs have the same definitions as those in
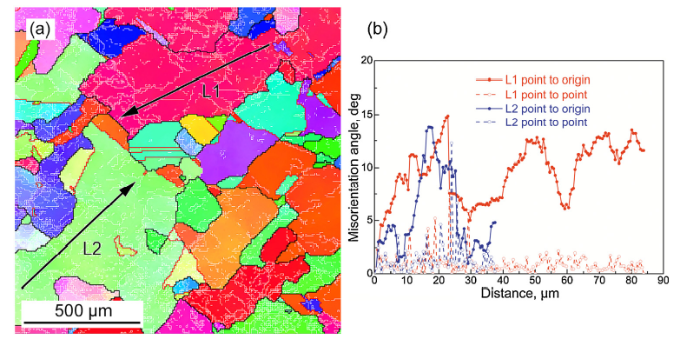
Fig. 6. Microstructure (a) and changes of misorientation angle along the lines marked by lines L1 and L2 (b) deform at 950 °C and 1 s-1 to true strain of 0.916. TEM micrographs of the specimen deformed at 1050 °C with the strain rate of10 s-1 to (c) 0.5, (d) 0.916. The colors and line styles in the OIM micrographs have the same definitions as those in
Typical microstructures with higher σ, corresponding to T = 950 °C, $\dot{ε}$= 1 s-1 and ε = 0.5/0.916, are displayed in Fig. 6. As can be seen from Fig. 6a, the original grains are elongated vertical to the direction of deformation, with abundant substructures inside, and a small number of fine recrystallized grains exist along the original GBs. Besides, a large number of approximately parallel HAGBs appear in the red deformed grains, based on the internal cumulative misorientation variation in Fig. 6b which is bigger than 15°. The TEM image (Fig. 6c) at a strain of 0.5 shows plentiful dislocations inside the deformed grains, so that the grain is divided into multiple regions by the MSBs. With the deformation proceeding, the MSBs intersect at a specific angle (Fig. 6d), which indicates that the LAGBs at the intersections rapidly transform into HAGBs and subsequently along the MSBs, leading to the appearance of new grains.
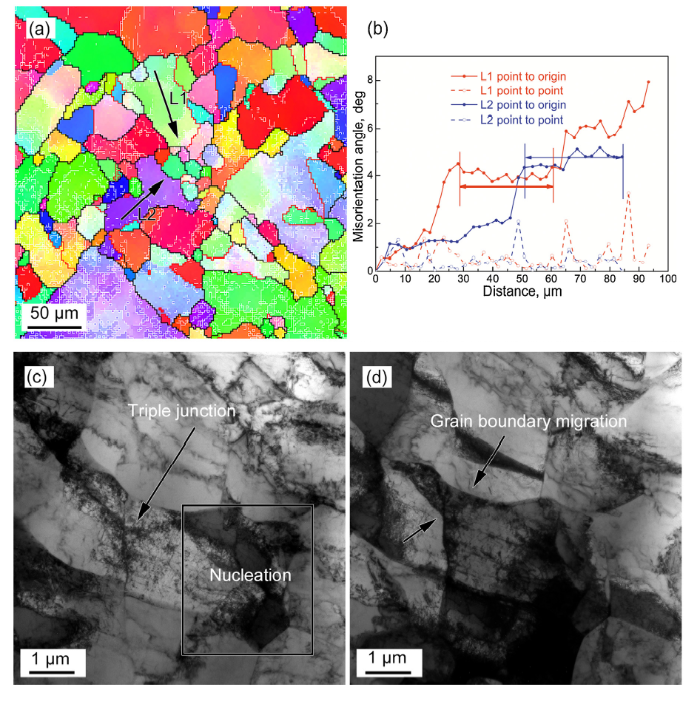
Specific microstructures in the low σ region corresponding to high T and low $\dot{ε}$ deformation are shown in Fig. 7, Fig. 8. The microstructure and misorientation angle versus the distance of deformed at T=1150 °C, $\dot{ε}$ = 0.01 s-1 and ε = 0.32 are exhibited in Fig. 7a and b. In contrast to the high σ region, rather homogeneous deformation structures develop in the original grains, and some dislocation-free DRX nucleus form predominately at triple junctions. The misorientation angle changes toward a triple junction (lines L1 and L2) in interior of two adjacent initial grains are shown in Fig. 7b. It can be seen that sub-grains/cells form within the deformed grains [26,27] as indicated by the cumulative misorientation platform both along L1 and L2. Furthermore, the step widths along lines L1 and L2 are about 30 μm, which is larger and more equiaxed in contract to the case of high σ. Besides, the cumulative misorientation angle accumulates with increasing the distance (Fig. 7b), illustrating that triple junctions are the priority place to realize nucleation for the DDRX owing to the misorientation angle gradient [28].
Fig. 7. Microstructure (a) and changes of misorientation angle along the lines marked by lines L1 and L2 (b) deform at 1150 °C and 0.01s-1 to true strain of 0.35; (c) (d) TEM micrographs of the specimen deformed at 1050 °C with the strain rate of 0.001 s-1 to 0.916. The colors and line styles in the OIM micrographs have the same definitions as those in
Fig. 8. Microstructure (a) and changes of misorientation angle along the lines marked by lines L1 and L2 (b) deformed at 1200 °C and 0.001s-1 to a true strain of 1.2. The colors and line styles in the OIM micrographs have the same definitions as those in
TEM micrographs by deformation of T = 1050 °C, $\dot{ε}$= 0.001 s-1 and ε = 0.916 are shown in Fig. 7c and d, to illustrate the nucleation and grain growth during DDRX. Considerable dislocations and large sub-grains are detected in the deformed grains, and new DRX nuclei (inside the rectangle) form at the triple junctions. Meanwhile, abundant dislocations enrich around the nuclei (Fig. 7c), indicating that the high strain gradients are gradually built up close to the triple junctions during deformation in order to maintain the strain compatibility between neighboring grains. These triple junctions thus serve as prominent nucleation sites for recrystallization, which is consistent with Fig. 7a and b. During the growth of DRX nuclei, the recrystallized grain boundary migrates from the low dislocation density side (less statistically stored dislocations) to the high side (indicated by the arrow in Fig. 7d).
Typical microstructure with ultralow σ deformed at T = 1200 °C, $\dot{ε}$= 0.001 s-1, ε = 1.2, is presented in Fig. 8, where uneven large deformed grains (average value = 198 μm) especially two abnormal coarse original grains, and some recrystallized grains at triple junctions are observed. The microstructural characteristics indicate the high GB migration rate and the occurrence of recrystallization. In addition, there are considerable well developed sub-grains in the abnormal grains, and the sub-grain size is 100-200 μm according to the “stepped” characteristic of the misorientation angle variations along L1 and L2 (Fig. 8b). On this basis, dynamic grain growth (DGG) [29,30] and/or dynamic abnormal grain growth (DAGG) [31,32] are operate under the deformation conditions of high T and low $\dot{ε}$, and the various sub-grain sizes in different deformed grains provide the driving force for grain boundary migration.
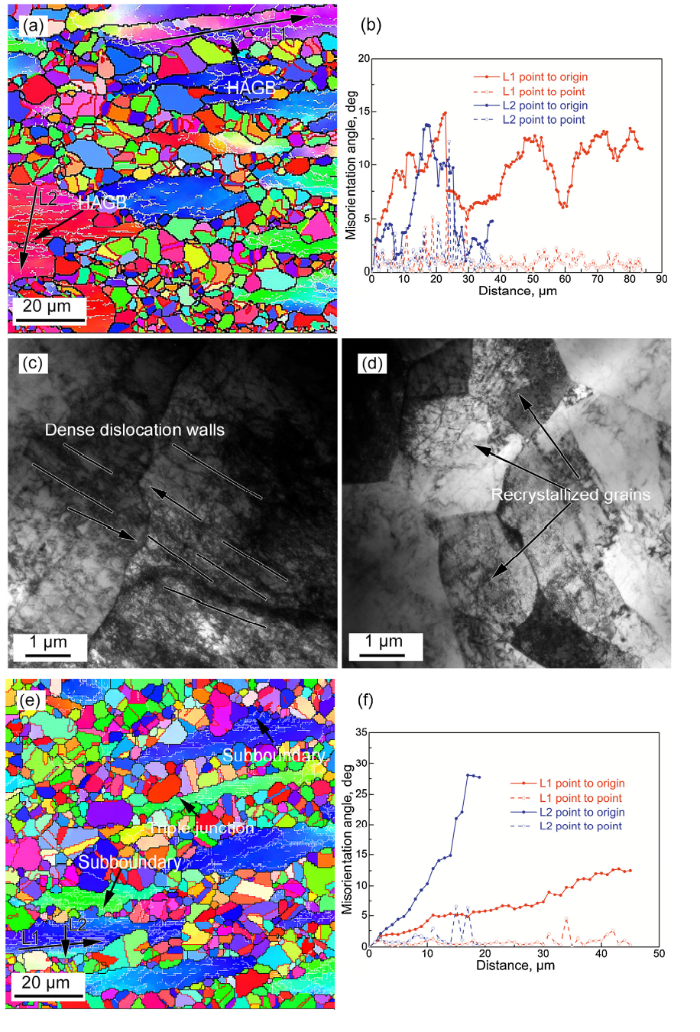
Fig. 9 shows the microstructures of moderate σ, which involves three deformation conditions, namely, high T and $\dot{ε}$, low T and $\dot{ε}$, and medium T and $\dot{ε}$. Corresponding to the first deformation condition (e.g. T = 1200 °C, $\dot{ε}$ = 10 s-1 and ε = 0.5), Fig. 9a and b show the OIM map and variations of misorientation angle with distance. The original grains are decorated by fine recrystallized grains and some discontinuous HAGBs (Fig. 9a) surrounded by plentiful LAGBs. Besides, a large number of elongated sub-grains are formed in the deformed grains, as indicated by the microstructural characteristics and the complex periodic fluctuation of cumulative misorientations (Fig. 9b). And, some LAGBs transform into HAGBs (indicated by the arrows in Fig. 9a) by absorbing the movable dislocations, which illustrates the presence of CDRX.
Fig. 9. Microstructure (a) and changes of misorientation angle along the lines marked by lines L1 and L2 (b) deform at 1200 °C and 10 s-1 to a true strain of 0.5; TEM micrographs of the specimen deformed at 1050 °C with the strain rate of 0.1 s-1 to a true strain of (c) 0.6 and (d) 0.916; microstructure (e) and changes of misorientation angle along the lines marked by lines L1 and L2 (f) deform at 1100 °C and 1s-1 to a true strain of 0.6. The colors and line styles in the OIM micrographs have the same definitions as those in
The TEM images under low T and $\dot{ε}$ (T = 1050 °C, $\dot{ε}$= 0.1 s-1 and ε = 0.6/0.916) are shown in Fig. 9c and d. The approximately parallel substructures (DDWs) perpendicular to the initial GB are different, which pushes the GB bulge into the side of low dislocation density (less dense dislocation walls, Fig. 9c), thus, providing nucleation sites for the DDRX. Furthermore, deformed substructures are formed in the recrystallized grains with the process of deformation, reducing the driving force for the migration of deformed grains. Subsequently, the small recrystallized grains with straight GBs are obtained, as seen in Fig. 9d.
For moderate T and $\dot{ε}$ deformation conditions, e.g. T = 1100 °C, $\dot{ε}$ = 1 s-1, ε = 0.6, the characteristic microstructure and misorientation variations are shown in Fig. 9e and f, where most of the original structure has been replaced by 2-3 layers of recrystallized grains, and the deformed grains are slender within an array of stretched sub-grains. Meanwhile, the following layer nucleation partially occurs at the triple junctions assisted by the nearby sub-boundaries (arrows in Fig. 9e). Moreover, the transformation of LAGBs into HAGBs is another way to nucleation, which depends on the large misorientation gradients developed in the deformed grains, as indicated in Fig. 9f. It can be seen the cumulative misorientation increases to 12.5° along the grain boundary (line L1) and the vertical grain boundary direction increases to 28° (line L2).
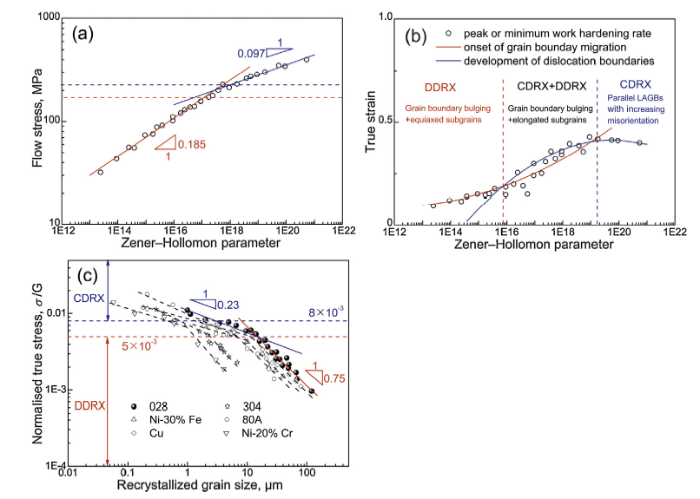
Based on the σ-ε and work-hardening rate curves in Fig. 2, the relationships among Zener-Hollomon parameter (Z), σ and ε at peak or θmin which is the major parameter for the evolution of deformation behavior [4,21], are presented in Fig. 10a and b. The parameter Z (= exp(Q/(RT))) is the temperature compensated strain rate factor which can be used to characterize the combined effects of $\dot{ε}$ and T [33], where Q is the deformation activation energy (selected as 465 kJ/mol using our pervious result [34]), R ( = 8.314 J/(mol·K)) is the gas constant. The σ vs Z plot in Fig. 10a clearly shows a change in the slope (in a log-log scale), and the transition zone is located at the moderate flow stress region, indicating the gradually change of deformation behavior [35]. In addition, the variation of ε with Z in Fig. 10b indicates either the onset of strain induced grain boundary migration or the development of dislocation boundaries [36], demonstrating the mechanism change of DRX responsible for new grain development.
Fig. 10. Relationship between Zener-Hollomon parameter and (a) stress, (b) strain at peak or θmin, (c) relationship between σ at strain of 0.916 normalized by shear modulus (σ/G) and DDRX of Incoloy 028 alloy.
Also, the connection between DDRX and σ normalized by shear modulus (G) at the strain of 0.916 depend on Fig. 3, Fig. 4, is presented in Fig. 10c where reference data [23,[36], [37], [38], [39]] are included. Similar to copper and steel, the DDRX of Incoloy 028 alloy can be related to σ/G by power-law function with exponent of -0.23 and -0.75 in the regions of high and low σ, respectively. Generally, with the increase of Z (i.e. σ), new grains dynamically develop from DDRX to CDRX, prompting a transition zone at the σ/G level of about 5 × 10⁻³ to 8 × 10⁻³ where the two mechanisms operate concurrently.
From flow stress behavior and microstructure evolution, with the decrease of Z parameter, i.e. σ, different deformation behaviors operate and three DRX mechanism regions are distinguished: (1) high Z (above 2 × 10¹⁸), i.e. σ (above 240 MPa), (2) moderate Z (2 × 10¹⁷-2 × 10¹⁸), i.e. σ (170-240 MPa), and (3) low Z (below 2 × 10¹⁷), i.e. σ (below 170 MPa) range.
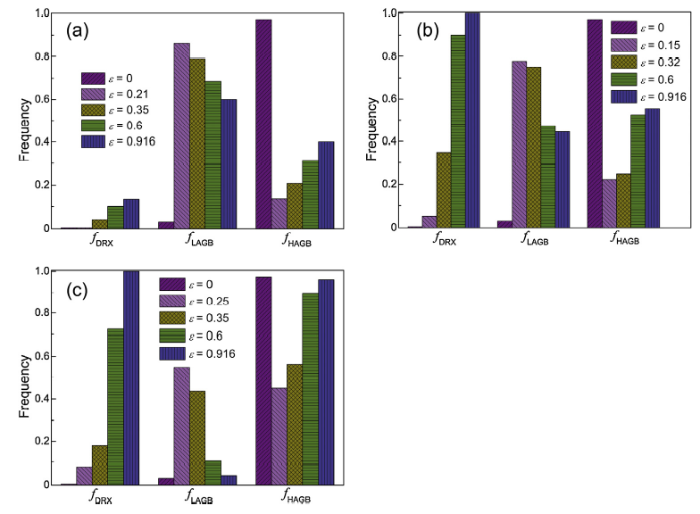
In the region of high Z, i.e. high σ, HAGBs form through the development of parallel and/or intersecting LAGBs, which demonstrates the occurrence of CDRX, cases in Fig. 5, Fig. 6. During deformation at low T and high $\dot{ε}$, the driving force for GBs migration is slumped, owing to the low mobility of HAGBs and abundant dislocations which accumulate rapidly at both sides of GBs. Based on the hindered long-range migration of GBs [1], therefore, the dynamic softening mainly depends on the rearrangement of dislocations, namely the dislocations glide/slip to form low-energy configurations. This indicates a weak dynamic softening effect, resulting in the work-hardening flow stresses (Fig. 2) and high fraction of LAGBs (fLAGB, Fig. 11a). Meanwhile, parallel and/or intersecting LAGBs (DDWs/MSBs) form in the deformed grain by a limited number of active slip systems [[24], [25], [26], [27]] as reflected in Fig. 5, Fig. 6, and then strain-induced new grains develop primarily by absorbing mobile dislocations continuously, as shown the increasing fDRX and fHAGB (fraction of HAGBs) in Fig. 11a.
Fig. 11. The fraction of DRX, LAGBs and HAGBs at different strains in the (a) high flow stress region (1050 °C, 10 s-1), (b) low flow stress region (1150 °C, 0.01 s-1) and (c) moderate flow stress region (1100 °C, 1 s-1).
On the other hand, in the region of low Z, corresponding to low σ, the development of new grains is mainly associated with the operation of DDRX mechanism, as displayed in Fig. 7. In this case, GBs are easy to bulge into the low stored deformation energy sides, and numerous dislocations and sub-grains appear via the intense dislocation motion (climb and cross/multiple slip) near GBs. So, recrystallized grains form at the bulging of GBs, especially at or near triple junctions (Fig. 7) where first obtain the needed energy for nucleation [28]. Subsequently, a remarkable dynamic softening effect is exhibited during the replacement of deformed structures by the migration of dislocation-free crystallites, leading to the obvious peak of σ, as shown in Fig. 2. Meanwhile, deformation substructures are produced continuously in the new grain growth, which promotes a new cycle of nucleation. Finally, a steady state [40] is obtained, when the deformation substructures formation (nucleation) rate and the recrystallized GBs migration (grain growth) rate are dynamically balanced. Therefore, the microstructure in the low Z region is characterized by exquixed grains and sub-grains (Fig. 2), and the equivalent fHAGB and fLAGB in the steady state, as shown in Fig. 11b.
In the moderate Z region, i.e. moderate σ region, the GB bulging and development of LAGBs are operate at the similar strain (Fig. 10b), which promotes the operation of CDRX and DDRX simultaneously, resulting in the multilayer nucleation and impeded grain growth, as shown in Fig. 9. Due to the influence of T and $\dot{ε}$, the original GBs bulge in a small range, accompany with the elongated sub-grains and strain gradient from grain boundary to the center (Fig. 9f). Accordingly, the first layer of recrystallized grains nucleates at the bulge GBs, while, the grain growth is suspended because of the capillary pressure effect and the replacement of the high dislocation density region (abundant substructures, Fig. 9). With the deformation proceeding, a new layer of recrystallized grains are subsequently produced, thanks to the formation of HAGBs through the development of LAGBs near the triple junctions, seen in Fig. 9e. Therefore, CDRX involved in the formation of HAGBs in situ works as a nucleation process for DDRX. With the simultaneous activation of the CDRX and DDRX mechanisms, the deformation defects in the system are effectively eliminated, resulting in the lowest fLAGB and highest fHAGB among all flow stress behaviors as shown in Fig. 11c.
It should be noted that in the ultralow σ region (T = 1200 °C, $\dot{ε}$ = 0.001 s-1, ε = 1.2), DGG/DAGG and DDRX operate simultaneously, which leads to uneven grains with different sizes (Fig. 8). As thermal activation processes [1,2,29], effective softening effect and well developed sub-grains are produced by the intense GBs migration and dislocation motion (climb and slip) [1,26]. Therefore, few DRX nuclei occur at the triple junctions where the surrounding deformed grains with similar sub-grains. Meanwhile, one or more abnormal large irregular grains with larger sized sub-grains appears, which provides the possibility to prepare single crystals of more than several centimeters, such as in commercial purity molybdenum [31] and tantalum [32] during plastic deformation at high temperatures.
As addressed previously, the observed DRX mechanism regions accompany with multiple microstructures are mapped with regard to the deformation conditions of Incoloy 028 in Fig. 12, which is suitable for other medium stacking fault energy materials [3], e.g. Inconel 718 [16], Ni-30Fe [38]. Namely, with the decrease of Z (i.e. σ), new grains develop from CDRX to DDRX, including the transition zone where continuous and discontinuous DRX coexist at the moderate flow stress region, and DGG/DAGG operates at ultralow flow stress region. Correspondingly, the substructure characteristic of the deformed matrix varies from highly misoriented MSBs, elongated sub-grains with strain gradient to large sized exquixed sub-grains. The proposed transition of DRX mechanism and unique substructure development suggest that the plastic deformation process is dominated from the GBs formation to migration, namely the nucleation rate decreases and grain growth rate increases with the reduction of Z (i.e. σ). Therefore, nanocrystals will be produced in the ultrahigh Z (upper left corner in Fig. 12) region where GBs formation is the main plastic deformation mechanism. Meanwhile, single crystals will be formed in the ultralow Z (lower right corner in Fig. 12) region where GBs migration controls the plastic deformation.
Fig. 12. Schematic diagram of the DRX mechanism transition under different deformation temperatures and strain rates of Incoloy 028 alloy.
The dynamic recrystallization mechanism of Incoloy 028 alloy was studied in compression tests at temperature range of 950-1200 °C and strain rate range of 0.001-10 s-1. The main results can be summarized as follows:
1 With increasing temperature or decreasing strain rate (Z parameter decreases), corresponding to the reduction of flow stress, the dynamic softening mechanism varies from CDRX to DDRX even DGG/DAGG, i.e. the transition from the formation to migration of HAGBs, resulting in multi-scale microstructures.
2 Two dynamic softening mechanisms coexist in the transition zone, where CDRX works as a nucleation process for DDRX in the moderate flow stress region, and DDRX and DGG/DAGG operate simultaneously in the ultralow flow stress region.
3 The main deformation mechanism gradually converts from dislocation glide to cross/multiple slip, climb and grain boundary migration with the decrease of Z parameter, leading to various substructures (microshear bands, elongated and exquixed sub-grains) and the increase of grain boundary fluctuation.
This work was supported by the National Key R&D Program of China (grant numbers 2017YFB0703001, 2017YFB0305100); the Natural Science Foundation of China (grant numbers 51431008, 51790481, 51804336, 51901185); the Research Fund of the State Key Laboratory of Solidification Processing (grant numbers 2019-BJ-04, 2019-TZ-01); and the Natural Science Basic Research Plan in Shaanxi Province of China (grant number 2019JM-132). We would like to thank the Analytical & Testing Center of Northwestern Polytechnical University for EBSD and TEM experiments.

 WeChat
/
| 〈 |
|
〉 |

