Search for articles:
Zhao-Qi Zhang , Cun-Guo Lin, Li Wang, Xiao-Bo Chen
Corresponding authors:
Received: 2019-07-9
Revised: 2019-08-19
Accepted: 2019-08-24
Online: 2020-03-15
Copyright: 2020 Editorial board of Journal of Materials Science & Technology Copyright reserved, Editorial board of Journal of Materials Science & Technology
More
Abstract
Magnesium (Mg) and its alloys have been widely used in a variety of industrial fields, however, the high corrosion rate and surface contamination restrict their applications. In this study, a corrosion-resistant polymer coating with self-cleaning properties on Mg alloy AZ31 was successfully fabricated via a pretreatment of amino-silane (poly(3-aminopropyl)trimethoxysilane, PAPTMS) and subsequently covered with a polypropylene (PP) film. Surface morphology and chemical compositions were examined using field-emission scanning electron microscopy (FE-SEM), X-ray diffraction (XRD), and Fourier transform infrared spectrophotometry (FT-IR) and X-ray photoelectron spectroscopy (XPS) as well. Contact angle was measured to determine hydrophobicity of the composite coatings. Water permeability of the coatings was evaluated through electrochemical impedance spectroscopy (EIS). Corrosion resistance of the coating was investigated using electrochemical and hydrogen evolution tests. Results indicated that PAPTMS/PP coatings possessed a micrometer-scaled porous spherical microstructure, and super-hydrophobicity with high water contact angle (162 ± 3.4°) and low sliding angle (5 ± 0.6°) due to the low surface energy (10.38 mJ/m2). Moreover, the coating exhibited a smaller water diffusion coefficient (8.12 × 10⁻¹⁰ cm2/s) and water uptake volume fraction (24.5 %), demonstrating low water permeability and good physical barrier performance. As a result, the corrosion current density of PAPTMS/PP coating exhibited approximately three orders of magnitude lower than that of the AZ31 substrate, suggesting excellent corrosion resistance. Finally, corrosion-resistant mechanism of the hybrid coating was proposed.
Keywords:
Recently, magnesium (Mg) and its alloys are already widely applied in automotive, military and aerospace [1], owing to their low density, light-weight, good cast ability and recycling utilization [2,3]. However, the susceptibility to corrosion hampers their extensive applications of Mg alloys [4,5]. Thus, corrosion protection for Mg alloys via various surface modifications have been employed, such as polymeric coatings [6,7], micro-arc oxidation (MAO) coatings [1,3], chemical conversion coatings [8], silane coatings and their composite coatings [9,10].
Among the available coatings, silane coating has been extensively used in anti-corrosion field duo to its environmental benign property, low cost and easier operation [11,12]. Earlier studies have indicated that silane pretreatment can protect Mg alloy substrate from corrosion and enhance the adherence of polymers to the substrate [[13], [14], [15]]. Our group found that silane treatment improved the corrosion resistance of Mg substrates with self-healing ability [7].
In the case of corrosion protection of metals, superhydrophobic and self-cleaning coatings have attracted more and more attention [[16], [17], [18], [19]]. Especially, the superhydrophobic coatings modified via stearic acid (SA, CH3(CH2)16COOH) with low surface energy on metal substrates, offer excellent corrosion protection [20]. The reason for this result can be attributed to their corrosion protection effect on substrates [17,21]. Yao et al. [22] applied ceria/silane to modify Mg-Al-layered double hydroxide coating on AZ31 substrates, which can exhibit self-cleaning properties and effectively protect the Mg alloy. Moreover, the self-cleaning characteristic can be used in self-cleaning window glasses, glassware, sport equipment, solar panels and so on [23,24].
Polymer coatings have found extensively structural applications on steels and promising structural use on Mg alloys [25]. Commercial polymers such as polytetrafluoroethylene (PTFE), polyethylene (PE) and polypropylene (PP) [26,27] are environmentally-friendly and cheap, showing superhydrophobic ability. PP shows superior corrosion resistance for protection of metal substrates [28,29], however, PP is very difficult to be attached to metal substrates due to its non-polarity. It is proposed that adding amount of PP-g-MAH (malefic anhydride (MAH) grafted PP) to PP will significantly improve the attachment ability of PP [30]. Moreover, the earlier research indicated that (3-aminopropyl) triethoxysilane (APTES) prepared onto the substrate, which can significantly enhance the bond force between PP coating and its metal substrates [7].
Unfortunately, the major issue is the peeling-off or pre-failure of polymer coatings resulted from cathodic hydrogen evolution due to high water permeability. Our group [31] demonstrated that hydrogen blister occurs on porous poly(L-lactic acid) (PLA)/ micro-arc oxidation (MAO) hybrid coating on Mg-1Li-1Ca alloy, which could be interpreted as the ingress of water molecules onto the MAO/substrate interface through the porous PLA film and MAO coating. Hydrogen evolution and formation of hydroxide magnesium led to an increase in volume beneath the localized PLA coating. Foyet et al. [32] reported that a mixed epoxy/amine coating on aluminum alloy exhibited high corrosion resistance performance due to the fact that the coating had a low permeability. Interestingly, Castela et al. [33] employed EIS technique and gravimetric method to study the water permeability of polyvinyl chloride (PVC) film, which illustrated that the water volume fraction, calculated from gravimetric method, is lower than the obtained data from the impedance due to the penetration of aggressive ions into the PVC film. The polymer coating, fabricated on substrate materials, exhibited high water permeability, which can lead a reduction in physical barrier and corrosion resistance performance [34]. Therefore, it is extremely significant to reduce the water permeability of polymer coatings.
To date, corrosion resistance and self-cleaning properties of poly(3-aminopropyl)trimethoxysilane (PAPTMS)/polypropylene (PP) composite coatings on Mg alloy AZ31 have scarcely been reported. In the paper, a good attempt in this regard, the corrosion resistance and superhydrophobic PAPTMS/PP coating is prepared on Mg alloy AZ31. The intention of the research is to study the anti-corrosion and self-cleaning ability of PAPTMS/PP coating, which may provide the possibility of utilization in broad industrial applications ranging from sports equipment to aviation materials and automotive parts.
Mg alloy AZ31 was employed in the study. PP and APTMS were bought from the Qingdao Jingke Chemical Reagent Co., Ltd., China. The maleic anhydride grafted polypropylene (PP-g-MAH) was bought from Hebei Jintian plastic New Material Co., Ltd., China.
The size of AZ31 sheets was 20 mm × 20 mm × 5 mm; and the sandpaper was applied to ground the substrate. The deionized water and ethanol were used to clean and dried it in warm air. The AZ31 substrate was soaked in solution A with 1 mol L-1 NaOH at 70 ℃ for 30 min to gain the hydroxylated surface.
A mixture of solution B (APTMS: ethanol: deionized water; 3:22:75, V/V/V) was prepared and stirred at 25 ℃ for 8 h. Subsequently, the hydroxylated AZ31 substrate was dipped in solution B at 30 ℃ for 15 min. Then, the specimen was placed at 100 ℃ for 30 min. As a result, the H2O molecules, derived from hydrolysis condensation reactions, were removed. Moreover, PAPTMS was synthesized by the condensation of hydrolytic APTMS.
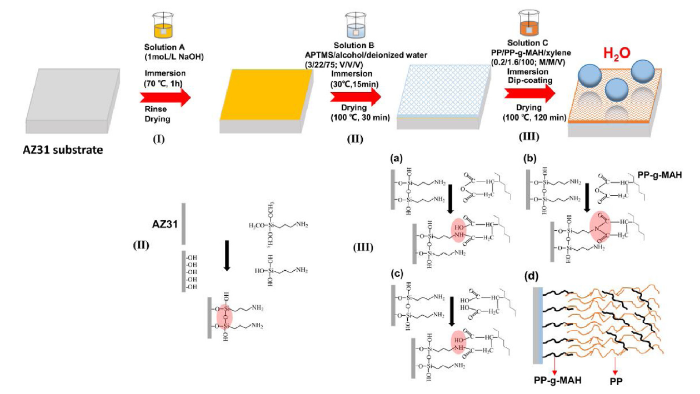
The mixed solution C (PP: PP-g-MAH: xylene = 0.2:1.6:100; M/M/V) was prepared at 125 ℃. After both PP and PP-g-MAH were completely dissolved, PAPTMS coating was soaked in solution C for 5 min; and then PP coating could be coated on the PAPTMS surface by dipping process. Finally, the specimen was placed in a furnace at 100 ℃ for 2 h, and placed it in the air to cool down naturally. The fabrication process of PAPTMS/PP coating is depicted in Fig. 1.
Fig. 1. Schematic illustration of PAPTMS/PP coating.
Surface morphologies of coating were observed through field-emission scanning electron microscopy (FE-SEM, Nova NanoSEM450, USA). The Fourier transform infrared spectroscopy (FT-IR, Nicolet iN10 MX, USA) was used to probe the formation of chemical bonds at room temperature. The crystal structure was examined through an X-ray diffractometer (XRD, Rigaku D/MAX 2500PC, Japan). The element compositions and interfacial interactions were studied using X-ray photoelectron spectroscopy (XPS, EscaLab 250Xi, USA).
The hydrophobicity of the coating was checked via gauging the water contact angle (CA) and sliding angle (SA). It is noted that CA was measured using water, glycol and diiodomethane as liquid phase; and the volume of liquid phase was 5 μL. The average value of CA was calculated by measuring 5 different positions on the coating. In addition, the surface energy of coatings could be calculated by LW-AB method [35].
The self-cleaning behavior is an essential property of superhydrophobic coating. In the test, about 30 mg of charcoal powder was unevenly poured on the tilted surface, and dropping water droplet (30 μL) on the surface to observe the self-cleaning performance of coating [21].
To inspect the surface stability of PAPTMS/PP coatings, a syringe (10 mL capacity, needle diameter ∼0.8 mm, fully filled with coloured water) was applied to continuously produce water jet by syringe pressing rate of ∼2 mm/s, and the water jet impacted on the surface from the height of 2-3 cm. Two situations could occur after water jet repeatedly hit the surface for 100 s, either it rebounded from the surface to affirm the stability, or it impinged inside the coating to confirm the unstable structure of the coating [36,37].
The adhesive force of the coating on substrate was studied by an MML Nanotest system. The detailed parameters and procedures referred to our previous literature [6]. The tests of adhesive force were performed three times.
2.8.1. Electrochemical tests
The electrochemical test was studied by a classical three-electrode system, and the exposed area of samples was 1 cm2 in the 3.5 wt% NaCl solution. Polarization curves (Tafel) were measured through a constant sweep rate (2 mV/s). The impedance spectroscopy (EIS) were recorded from100 kHz to 10 mHz with a 10 mV amplitude perturbation. It is noted that the EIS and Tafel were measured four times to ensure the stability and reproducibility. The corrosion rate (Pi, mm·year-1) could be obtained through the following relationship [7]:
Pi = 22.85Icorr (1)
2.8.2. Hydrogen evolution tests
The PAPTMS/PP coating was soaked in 3.5 wt% NaCl solution at 298 K for 250 h. Then, a graduated burette connected to an inverted funnel, and the solution level in the burette has been intermittently recorded. Meanwhile, the pH value of solutions was also measured. The hydrogen evolution rate (HER) needed to report continually in quadruplicate. Besides, the HER, vH (mL·cm-2 h-1), could be obtained:
vH = V/st (2)
where V represents the evolved volume of hydrogen, s and t are the immersed area and time. PH (mm·year-1), representing the corrosion rate, according to [38]:
PH = 54.696vH (3)
The water permeability of coating was evaluated via the EIS technique according to the method in the literature [34]. The coating capacitance Cc was calculated at a fixed frequency (10 kHz) in the case, the formula as follow:
Cc =$\frac{1}{2πfZ"}$ (4)
where Cc represents coating capacitance, Z“ is the impedance imaginary part (10 kHz). The water diffusion coefficient (D) could be obtained via Eq. (5) [34]:
$\frac{lnC_c-lnC_d}{lnC_∞-lnC_d}=\frac{2\sqrt{t}}{L\sqrt{π}}\sqrt{D}$ (5)
where Cc represents the capacitance at time t, Cd is the initial capacitance, C∞ is saturated coating capacitance and L is the thickness of coating. Subsequently, the saturated water volume fraction (φ) of the coatings could be calculated via Eq. (6) [39]:
φ =$\frac{ln\frac{C_∞}{C_d}}{ln80}$ (6)
The thickness of coating was measured by a thickness gauge. The average value of thickness was calculated through 5 measurements, and the thickness of coatings is about 60 μm in the case.
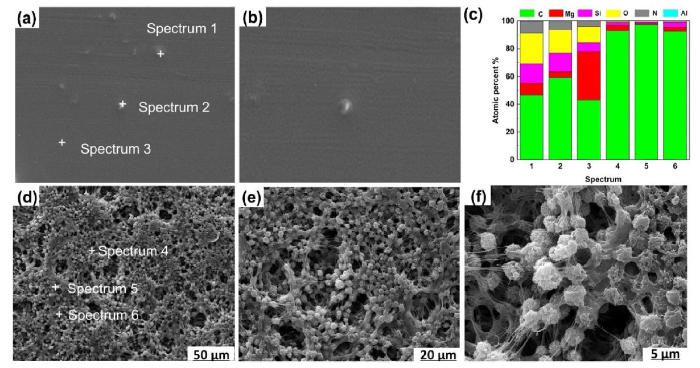
Fig. 2 displays FE-SEM pictures of the samples. It is clear that a transparent film could be observed (Fig. 2(a and b)), and the EDS depicts the presence of Si, C and N (Fig. 2(c)), revealing that the PAPTMS coatings were successfully formed onto the AZ31 substrate. Interestingly, some white and bulges spots were observed on the surface, it can be attributed to the self-condensation of silanol to oligomer [31]. Moreover, the large number of micro-spherical structures could be observed on surface (Fig. 2(d-f)). The presence of high content (> 90 at. %) of C (Fig. 2(c)) implied the PP coatings prepared on samples.
Fig. 2. FE-SEM images of (a-b) the PAPTMS coatings, (c) elemental compositions of samples in wt%, and (d-f) the PAPTMS/PP coatings.
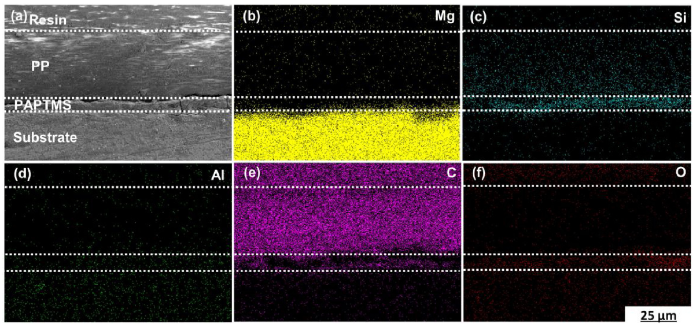
Fig. 3(a) depicts the cross-sectional SEM images of PAPTMS/PP coatings. The PAPTMS and PP coating exhibited coating thickness of 10.65 ± 1.25 and 49.65 ± 1.38 μm, respectively. For corresponding EDS images (Fig. 3(b-f)). The elemental mapping indicated that the PAPTMS coating was primarily composed of C, O and Si. The high content of Si (Fig. 3(c)) demonstrated that the formation of PAPTMS coating on the substrate. Moreover, the distribution of C and O (Fig. 3(e and f)) suggested that the PP coating was successfully prepared.
Fig. 3. Cross-sectional morphologies of (a) PAPTMS/PP coating; the EDS mapping of (b) Mg, (c) Si, (d) Al, (e) C and (f) O.
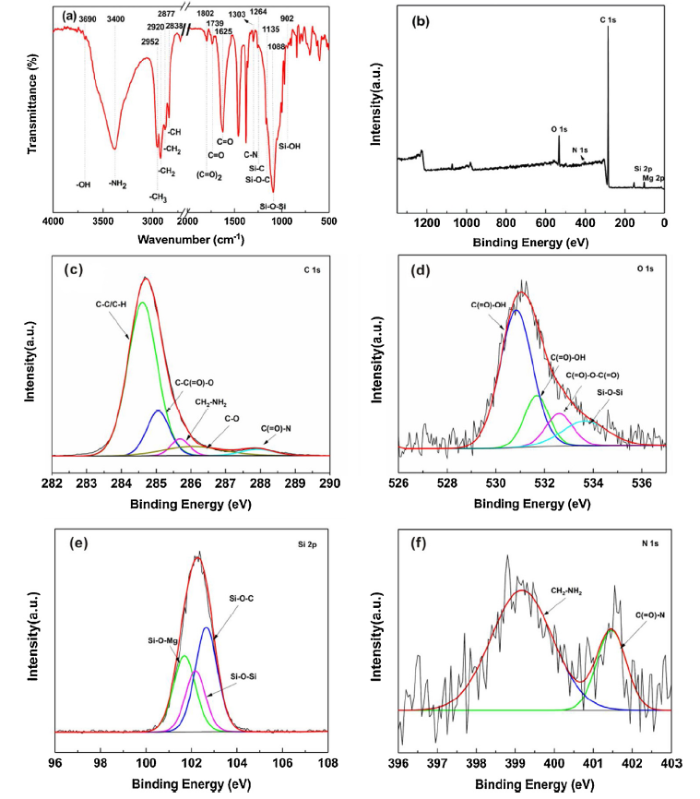
Fig. 4(a) designates the FT-IR spectra of samples. The peak at 3400 cm-1 was because of -NH2 group. The sharp peaks at 1376 cm-1 and 2952 cm-1, 1462 cm-1 and 2877 cm-1, 2838 cm-1 were based on—CH3, —CH2, —CH of the PP. The—CH2 (2920 cm-1) was ascribed to PAPTMS. After that, the adsorption peak at 1135 cm-1 was attributed to Si—O—C; and then the band at 1088 cm-1 was assigned to the Si—O—Si. Si—OH group was situated in 902 cm-1. The sharp band at 1264 cm-1 was ascribed to Si-C [40]. Results demonstrated that the PAPTMS coatings were successfully coated Mg alloy AZ31 [41]. Moreover, the band at 1802 cm-1 suggested that the existence of the (C=O)2, which could be attributed to the anhydride structure (PP-g-MAH). The appearance of carboxyl groups (—COOH) [42,43] was due to the presence of C=O peak at 1739 cm-1. Meanwhile, the C=O band (1625 cm-1) and C—N band (1303 cm-1) were attributed to the amide groups. The FT-IR results revealed that the PAPTMS/PP coating was obtained on the AZ31 substrate.
Fig. 4. FT-IR spectra (a) and XPS spectra of PAPTMS/PP composite coating: (b) survey of elements, high resolutions of (c) C 1s, (d) O 1s, (e) Si 2p and (f) N 1s.
Fig. 4(b-f) displays the survey and high resolutions of XPS spectra of the PAPTMS/PP coatings. The existence of C, O, Si, N and Mg elements could be observed from Fig. 4(b). With respect to C 1 s spectra (Fig. 4(c)), the peak was composed of five contributions at 284.6, 285.07, 285.6, 286.12 and 287.6 eV, which represented C—C/C—H, C—C(=O) —O, CH2—NH2, C—O and C(=O)—N, respectively [44]. As displayed in Fig. 4(d), O 1s spectra, it was composed of four contributions centered at 530.80, 531.85, 532.87 and 533.55 eV, which represented C(=O)—OH, C(=O)—OH, C(=O)—O—C(=O) and Si-O-Si [14], whereas the C(=O)—OH peak was attributed to the hydrolyzed PP-g-MAH (C(=O)—O—C(=O)). With respect to Si 1 s spectra (Fig. 4(e)), the peak was composed of three contributions at 101.7, 102.3 and 102.8 eV, which were Si-O-Mg, Si-O-Si and Si-O-C groups, respectively [45]. In addition, the spectrum of N 1s was divided into two peaks (Fig. 4(f)), which corresponded to CH2—NH2 (399.2 eV) and C(=O)—N (401.5 eV) groups. The existence of C(=O)—N was because of the interfacial interactions between the (—(C=O)2—O) on PP-g-MAH and/or the—COOH on hydrolyzed PP-g-MAH and the -NH2 on PAPTMS [44].
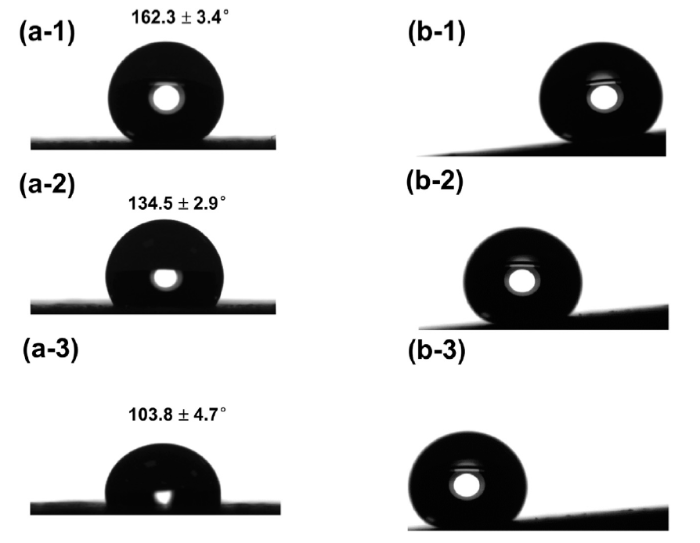
The contact angle (CA) was measured using water, glycol and diiodomethane as dropped liquid phase. The CA of the PAPTMS/PP coating could be observed about 162.3 ± 3.4° for water (Fig. 5(a-1)), 134.5 ± 2.9° for glycol (Fig. 5(a-2)) and 103.8 ± 4.7° for diiodomethane (Fig. 5(a-3)), respectively. The sliding angle (SA) of the samples is shown in Fig. 5(b), the SA of PAPTMS/PP coating was about 5 ± 0.6° could be observed. Results indicated the PAPTMS/PP coating possessed superhydrophobic properties, which could be attributed to the synergy of the spherical microstructures and the low surface energy of PP.
Fig. 5. Contact angle (CA) measured using (a-1) water, (a-2) glycol and (a-3) diiodomethane as liquid phase; (b) sliding angle (SA).
The surface energy of samples was obtained through LW-AB method. The surface energy of samples can be expressed as Lifshitz - van der Waals component (γLW) and Lewis acid-base component (γAB), and Lewis acid-base component could be divided into Lewis acid component (γ+) and Lewis base component (γ-) [46], i.e.
γ =γLW+γAB (7)
And
γAB=2$\sqrt{γ^+γ^-}$ (8)
The interaction between solid and liquid interfaces is as follows:
γSL=γS+γL-2($\sqrt{γ_S^{LW}γ_L^{LW}}+\sqrt{γ_S^+γ_L^-}+\sqrt{γ_S^-γ_L^+}$) (9)
Substituting Eq. (8) into Eq. (9) to obtain:
γL(1+cosθ)=2($\sqrt{γ_S^{LW}γ_L^{LW}}+\sqrt{γ_S^+γ_L^-}+\sqrt{γ_S^-γ_L^+}$) (10)
From Eq. (10), it needs to know the $γ_L^{LW}$, $γ_L^+$ and $γ_L^-$ (Table 1) of three liquids phase, and the θ (Fig. 5) of three liquids with the samples. Therefore, all surface energy parameters of three liquids phase were substituted into Eq. (10); $γ_S^{LW}$, $γ_S^+$, $γ_L^-$ and $γ_S^{AB}$ could be calculated, as shown:
$γ_S^{LW}=7.97\frac{mJ}{m^2},γ_S^+=0.75\frac{mj}{m^2},γ_S^-=1.93\frac{mj}{m^2}andγ_S^{AB}=2.41mJ/m^2$ (11)
Substituting Eq. (11) into Eq. (7) to obtain
γS=10.38 mJ/m2 (12)
Table 1 Surface energy (γ) parameters of three liquids phase, mJ/m2.
| Liquids | γL | $γ_L^{LW}$ | $γ_L^+$ | $γ_L^-$ |
|---|---|---|---|---|
| Water | 72.8 | 21.8 | 25.5 | 25.5 |
| Glycol | 48.0 | 29.0 | 1.92 | 47.0 |
| Diiodomethane | 50.8 | 50.8 | 0 | 0 |
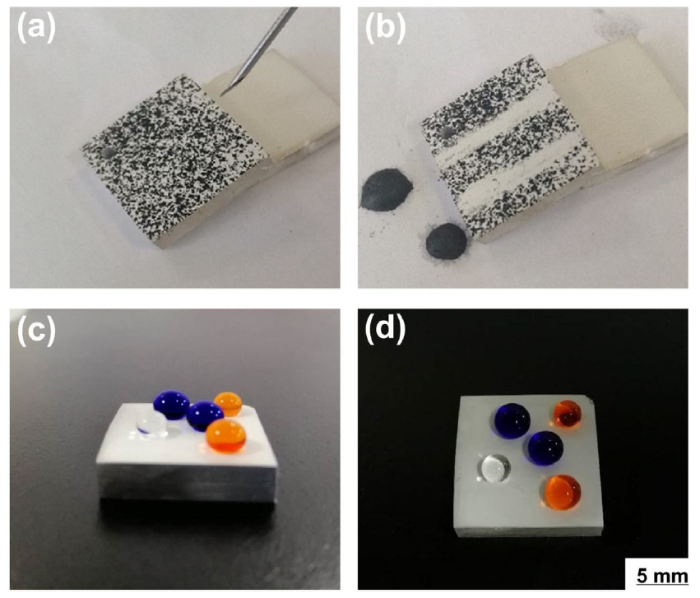
Usually, low surface energy coatings possess self-cleaning property. The self-cleaning test of PAPTMS/PP coatings is depicted in Fig. 6(a and b). Obviously, the self-cleaning behavior of PAPTMS/PP coating could be observed. In addition, Fig. 6(c and d) depict the digital photos of the spherical water dropped on the PAPTMS/PP coatings. which could be ascribed to the low surface energy of coatings. Moreover, the water drops kept hydrophobicity for more than 4 h, or even longer. However, the volume of water drops gradually decreased due to the volatilization of water (Fig. S1).
Fig. 6. Self-cleaning tests of (a, b) the PAPTMS/PP coatings; Optical photographs (c, d) of the spherical droplets on the surface (front and vertical view).
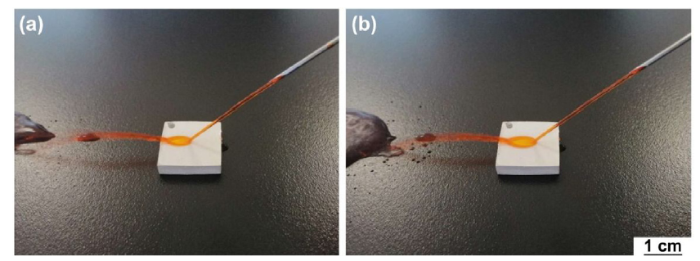
In general, the super-hydrophobic (Fig. 5) and self-cleaning (Fig. 6) properties are clearly observed for the samples. Hence, the stability of the coatings needed to be further investigated for improving the coatings performance. As shown in the stability test of samples, the water jets impacted on the surface and bounced back confirming stability of the coatings (Fig. 7(a)). By increasing the time for water to hit the coating surface, water jet was rebounding continuously and no damage was observed on the surface (Fig. 7(b)). SEM image further indicated that no cracks and damage formed on the surface after 100 s of water impingement (Fig. S2). Results revealed that the PAPTMS/PP composite coatings possessed excellent stability. In addition, a video of the process is shown in supporting information (Video S1).
Fig. 7. Stability tests of water jet hit the PAPTMS/PP coating at different time: (a) and (b).
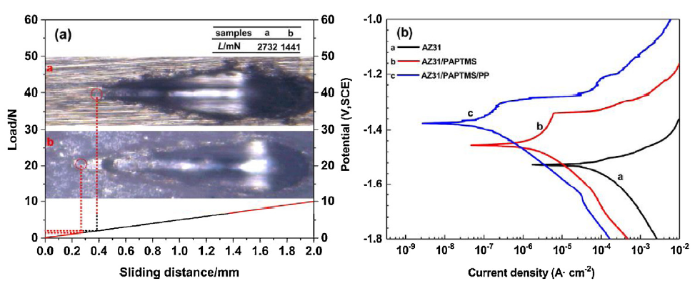
The scratch tests are shown in Fig. 8(a). The scratch tests were used to evaluate the critical loads in the course of bond failure of the substrate/coating system. The critical loads of PAPTMS and PAPTMS/PP coatings were 2732 and 1441 mN, respectively. The adhesion strength (2732 mN) of PAPTMS coating was because of the formation of chemical bonds, whereas the adhesion strength (1441 mN) of PAPTMS/PP coating was due to the entanglement between PP-g-MAH chains and PP chains after the surface preparation of PP-g-MAH through chemical interactions. The adhesive force of PAPTMS/PP coating was much more than the Al2O3 sol-gel coating (692.9 mN) and the MAO coating (1020 mN) on the Mg substrate [47,48]. Results suggested that both the coatings had excellent adhesion.
Fig. 8. Scratch tests (a) and polarization curves (b) of samples.
The polarization curves of specimens are shown in Fig. 8(b). The corrosion potential (Ecorr) and corrosion current density (Icorr) were derived from Tafel extrapolation method, and the data is shown in Table 2. The AZ31 substrate exhibited the highest Icorr in the case, indicating that the corrosion rate is the largest. Interestingly, the Icorr of the PAPTMS coating decreased to 1.95 × 10⁻⁶ A·cm-2, implying that the PAPTMS coatings possessed improved corrosion resistance. The Icorr (9.08 × 10⁻⁸ A·cm-2) of the PAPTMS/PP coatings was approximately three orders of magnitude lower than the AZ31 substrate, revealing that the PAPTMS/PP coatings could effectively protect substrate. Moreover, the corrosion potential (Ecorr) of PAPTMS/PP coatings increased from -1.51(AZ31 substrate) to -1.38 V/SCE, which indicated that PAPTMS/PP coating could effectively improve the corrosion resistance.
Table 2 Electrochemical data of the polarization curves.
| Samples | Ecorr (V/SCE) | Icorr (A·cm-2) | βa (mV·dec-1) | -βc (mV·dec-1) | Pi, (mm·year-1) |
|---|---|---|---|---|---|
| AZ31 | -1.51 | 4.96 × 10⁻⁵ | 50.62 | 147.76 | 1.14 |
| AZ31/PAPTMS | -1.45 | 1.95 × 10⁻⁶ | 37.29 | 140.71 | 4.46 × 10⁻² |
| AZ31/PAPTMS/PP | -1.38 | 9.08 × 10⁻⁸ | 20.36 | 106.92 | 2.07 × 10⁻³ |
The anodic Tafel slope (βa) and cathodic Tafel slope (βc) of the AZ31 substrate were 50.62 and 147.76 mV·decade-1, respectively. The PAPTMS coatings decreased to 37.29 and 140.71 mV·decade-1. Finally, the βa and βc farther reduced to 20.36 and 106.92 mV·decade-1 for the PAPTMS/PP coating, respectively. Results reflected a more effective protection of the PAPTMS/PP coatings for substrate. Moreover, a discussion of Icorr and HER will be provided in Section 4.
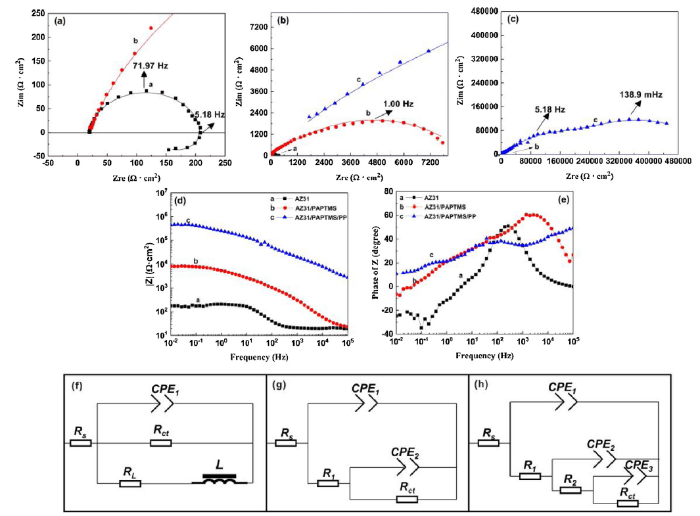
Fig. 9(a-c) shows the Nyquist plots of samples. For AZ31 substrate (Fig. 9(a)), a capacitive loop (high and medium frequency) could be observed, which represented the charge transfer process. Whereas a inductive loop (low frequency) was because of the pitting corrosion of the Mg substrate [7]. The PAPTMS/PP coating exhibited the largest diameter of the capacitive loop compared with other samples (Fig. 9(c)). Result suggested that the PAPTMS/PP coating had superior corrosion protection.
Fig. 9. (a-c) Nyquist plots, (d) Bode plots of |Z| vs. Frequency and (e) Bode plots of phase angle vs. frequency; equivalent circuits of (f) the AZ31 substrate, (g) the PAPTMS coatings and (h) the PAPTMS/PP coatings.
. The bigger Z modulus at lower frequencies presented high corrosion resistance. As shown in Bode plots (Fig. 9(d)), the PAPTMS/PP coatings exhibited the biggest Z modulus (450,578 Ω·cm2) at lower frequencies compared with AZ31 substrate (178 Ω·cm2) and PAPTMS coating (8098 Ω cm2). Result revealed that the PAPTMS/PP coating had a good anti-corrosion performance, which is coincident with the corrosion current density of polarization curves in Fig. 8(b).
Fig. 9(e) shows the Bode curves of samples. The two times constants of the PAPTMS/PP coatings could be observed. The capacitance loop at high frequency (103-105 Hz) corresponded to the PP coatings, and medium frequency (10-1-102 Hz) corresponded to the PAPTMS coatings. The values of phase angle at a low-frequency of AZ31 substrate, PAPTMS coating and PAPTMS/PP coating were -24°, -6° and 49°, respectively, which indicated that the PAPTMS/PP coatings could enhance corrosion resistance of samples.
(Fig. 9(f)) shows the equivalent circuits of samples. For AZ31 substrate, Rs is the solution resistance, Rct represents the charge transfer resistance, RL symbolizes a resistor at low frequency and L is the inductance, which represents the pitting corrosion. The inductive loop represents the case of pitting corrosion in the low frequency, which is represented by the RL and L. The capacitance loop (high frequency) is represented by Rct and constant phase element (CPE1), which represented corrosion products layer. However, for the PAPTMS coatings (Fig. 9(g)) and PAPTMS/PP composite coatings (Fig. 9(h)), R1, 2 is resistance of the coatings. The PAPTMS coatings include the outer layer (R1) and the inner layer (Rct). Interestingly, the invisible inductive character of the PAPTMS/PP composite coatings manifest that the PAPTMS/PP coatings possessed superior anti-corrosion ability and it consists of a loose outer layer and a dense inner layer (Rct), the loose outer layer was composed of R1 and R2. The increase in Rct from 190.5 Ω·cm2 (AZ31 substrate) to 28,020 Ω·cm2 (PAPTMS/PP coating) confirmed that the coating showed excellent corrosion protection (Table 3).
Table 3 Electrochemical data for EIS curves obtained by equivalent circuit fitting.
| Sample | Rs (Ω·cm2) | CPE1 (Ω-1·cm-2·sn) | n1 | R1 (Ω·cm2) | CPE2 (Ω-1·cm-2·sn) | n2 | R2 (Ω·cm2) | CPE3 (Ω-1·cm-2·sn) | n3 | Rct (Ω·cm2) | RL (Ω·cm2) | L (H·cm-2) |
|---|---|---|---|---|---|---|---|---|---|---|---|---|
| AZ31 | 19.80 | 1.85 × 10⁻⁵ | 0.92 | - | - | - | - | - | - | 190.9 | 312.9 | 81.2 |
| AZ31/PAPTMS | 19.82 | 2.44 × 10⁻⁶ | 0.80 | 1.03 ×10² | 3.56 × 10⁻⁵ | 0.80 | - | - | - | 7578 | - | - |
| AZ31/PAPTMS/PP | 1554 | 1.25 × 10⁻⁷ | 0.59 | 2.11 × 10⁴ | 4.02 × 10⁻⁷ | 0.56 | 2.79 × 10⁵ | 3.65 × 10⁻⁶ | 0.69 | 2.80 × 10⁵ | - | - |
Hydrogen evolution test was applied to evaluate the corrosion resistance of samples [49]. Fig. 10(a) shows the hydrogen evolution volume (HEV), the HEV could be ranked in an increasing order as follows: the PAPTMS/PP coating (0.65 ± 0.31 mL·cm-2) < the PAPTMS coating (3.80 ± 0.22 mL·cm-2) < the AZ31 substrate (5.35 ± 0.45 mL·cm-2). Moreover, For the hydrogen evolution rates (HER) of the samples (Fig. 10(b)), which can be ranked in a decreasing order as follows: the AZ31 substrate (4.2 × 10⁻¹ ± 2.2 × 10⁻² mL·cm-2 h-1) > the PAPTMS coatings (2.5 × 10⁻² ± 1.25 × 10⁻³ mL·cm-2 h-1) > the PAPTMS/PP coatings (1.6 × 10⁻² ± 1.8 × 10⁻³ mL·cm-2 h-1), indicating that the PAPTMS/PP coatings possessed excellent corrosion resistance.
Fig. 10. Hydrogen evolution tests of (a) hydrogen evolution volume and (b) hydrogen evolution rates for (a) the AZ31 substrates, (b) the PAPTMS coatings and (c) the PAPTMS/PP composite coatings in 3.5 wt% NaCl solution for 250 h of immersion.
Fig. 11 depicts the digital camera photographs and FE-SEM images of the AZ31 subtrate (a and d), the PAPTMS coating (b and e), and the PAPTMS/PP coating (c and f). For AZ31 substrate (Fig. 11(a and d)), the complete corrosion damage of the surface was observed. The main elemental component was Mg and O (Fig. 11(g)), which indicated the corrosion products were mainly Mg(OH)2. For PAPTMS coatings (Fig. 11(b and e)), the samples were partially subjected to corrosion damage, suggesting that the PAPTMS coatings protected the sample. The elemental composition of Mg, O and a small amount of Si were observed on the surface (Fig. 11(g)). Interestingly, the PAPTMS/PP coatings remained intact, and the coating exhibited no sign of corrosion on its surface (Fig. 11(c and f)), which demonstrated that the PAPTMS/PP coatings could improve the anti-corrosion of the samples. The observations are consistent with the results derived from electrochemical tests.
Fig. 11. Digital camera photographs and FE-SEM images of (a) and (d) the AZ31 subtrate, (b) and (e) the PAPTMS coating, (c) and (f) the PAPTMS/PP coating immersed in 3.5 wt% NaCl solution for 250 h; (g) corresponding elemental analysis of samples.
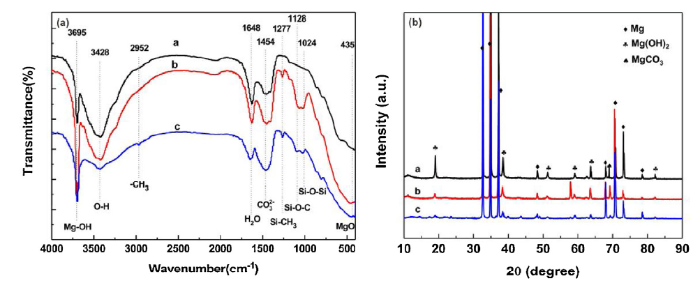
Fig. 12(a) shows the FT-IR spectra of samples after 250 h of immersion. The peaks of Mg—OH and CO32- (at 3695 cm-1 and 3428 cm-1, respectively) might be owing to the corrosion products Mg(OH)2 and MgCO3 [7]. The characteristic band of —CH3 (at 2952 cm-1) represented that the PP still remained on the sample. The other characteristic peaks of Si—CH3 (at 1277 cm-1), Si—O—C (at 1128 cm-1) and Si—O—Si groups (at 1024 cm-1) were observed, which could be attributed the PAPTMS coatings. Results suggested that the PAPTMS/PP coatings possessed excellent structure stability. Fig. 12(b) displays the XRD patterns of samples. The intensity of the Mg(OH)2 represented the corrosive degree, the PAPTMS/PP coating exhibited the smallest intensity of peak in the case, indicating that the PAPTMS/PP coatings possessed a good corrosion resistance
Fig. 12. FT-IR spectra (a) and XRD patterns (b) of samples immersed in 3.5 wt% NaCl solution after 250 h of immersion.
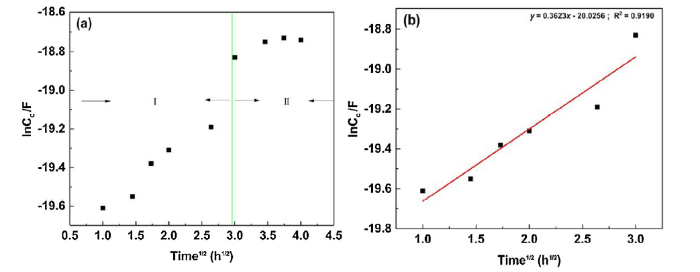
Water permeability is a significant means to studied the permeability resistance. The D and φ of coatings were used to evaluate the performance of water permeability resistance in the case. Fig. 13(a) depicts the ln Cc- t1/2 curve of coating, and curve (b) is linear region curve. The variation of coating capacitance corresponding to immersion time could be divided into two typical stages (Ⅰ and Ⅱ). In the early immersion (0-9 h, stage Ⅰ), the coating capacitance increased quickly, meaning the water slowly permeated into the coatings. Subsequently it tended to stability after about 9 h of immersion (stage Ⅱ), suggesting that the φ of the coating reached saturated stage. It is noted that the diffusion of water in the coating showed a homogeneous way and obeyed Fick's law (Fig. 13(b)) [39]. The Cd and C∞ could be calculated by the fitting results. Then, the D of PAPTMS/PP coating was obtained through Eq. (13):
$\frac{dlnC_c}{d\sqrt{t}}=\frac{2\sqrt{D}(lnC_∞-lnC_d)}{L\sqrt{π}}$ (13)
where $\frac{dlnC_c}{d\sqrt{t}}$ is the slope of linear part [34]. Therefore, the D value was about 8.12 × 10⁻¹⁰ cm2/s, which concurred with the experimental data in the reported paper (10-8-10-12 cm2/s) [39]. Then, the φ of the coating at saturated stage was obtained about 24.5 % by Eq. (5). The value of φ is higher than the reports (2.0%-15.98%) [32,50],which is because of the interlayer of composite coating stored part of the water, whereas the reported literatures were mainly single layer coating. Results indicated the PAPTMS/PP coatings had low water permeability, which could be attributed to the twined chain structure of PP and reticular structure of PAPTMS [7].
Fig. 13. Cc- t1/2 curve of PAPTMS/PP coating/AZ31 system: (a) complete immersion stage and (b) linear part.
Furthermore, the corrosion rates of Pi (Table 2) and PH (Table 4) were compared in the case. Although the corrosion rates (Pi and PH) were calculated via different methods, which could be ranked in the same increasing order: AZ31/PAPTMS/PP < AZ31/PAPTMS < AZ31. However, there is slightly difference between the Pi and PH. In general, the HER represents the dissolution rates of Mg alloy as a function of soaking time, which is same as the weight loss rate [7]. Whereas Icorr were calculated though the polarization curves, which cannot reflect the true corrosion rate due to anodic hydrogen evolution and the dissolution of Mg [51]. This scenario could be interpreted as negative difference effect [52].
Table 4 PH of the samples after immersion time of 1, 100 and 250 h, mm·year-1.
| Samples | 1 h | 100 h | 250 h |
|---|---|---|---|
| AZ31 | 21.88 | 2.55 | 11.71 |
| AZ31/PAPTMS | 1.37 | 1.48 | 0.82 |
| AZ31/PAPTMS/PP | 0.91 | 0.21 | 0.14 |
Over the years, the functional applications of polymer coatings on Mg alloys have been broadly investigated. The corrosion resistance of polymer coating was compared in Table 5. The results of most of the literatures suggested that the Icorr of coatings reduced two or three orders of magnitude compared with the Mg substrate. Moreover, only few papers employed immersion test to study the corrosion resistance of coatings. For instance, Guo et al. [2] reported the Icorr of Mg(OH)2/PMTMS/CeO2 composite coatings could decrease three orders of magnitude compared to AZ31 substrate. However, the coating was peeling off the Mg substrate after 198 h of soaking. Similarly, Cui et al. [7] prepared a MAO/ PMTMS coating on the AZ31 Mg alloy. Although the Icorr of the composite coating could also decrease three orders of magnitude compared to the AZ31 substrate, the coating was detached from the AZ31 substrate after 248 h of immersion. In the paper, the PAPTMS/PP coatings decreased approximately three orders of magnitude compared to the AZ31 substrate (4.96 ± 0.06 × 10⁻⁵ A·cm-2 to 9.08 ± 0.09 × 10⁻⁸ A·cm-2), and the coating still completely preserved and effectively protected the substrate after immersion for 250 h. Therefore, the higher corrosion resistance of PAPTMS/PP coating could expand the application of Mg alloys.
Table 5 Corrosion resistance of polymer coatings on Mg alloys in NaCl solution.
| Coatings | Substrate | Thickness (μm) | Electrolyte (wt%) | Icorr (A/cm2) | Ecorr (V/SCE) | Immersion (h) time (day) | Refs. | ||
|---|---|---|---|---|---|---|---|---|---|
| Substrate | Coating | Substrate | Coating | ||||||
| PEO/ SPTFE | MA8 | 20 + 1∼1.5 | 3.0 | 5.3 × 10⁻⁵ | 3.1 × 10⁻⁹ | -1.56 | -1.27 | - | [53] |
| Mg(OH)2/SA | AZ31 | 23.5 + 11 | 3.5 | 3.2 × 10⁻⁵ | 1.7 × 10⁻⁷ | -1.54 | -1.23 | 120 | [20] |
| PEO/PANI + SAE | AZ91D | 10 + 20 | 3.5 | 4.2 × 10⁻² | 2.0 × 10⁻⁴ | -1.47 | -1.34 | - | [54] |
| HZC/FAS | AZ31 | 120 | 3.5 | 2.6 × 10⁻⁵ | 2.6 × 10⁻⁸ | -1.54 | -0.55 | - | [55] |
| MAO/PMTMS | AZ31 | 2.8 + 13.6 | 3.5 | 1.4 × 10⁻⁵ | 2.8 × 10⁻⁸ | -1.51 | -1.41 | 248 | [7] |
| MA | Mg-Mn-Ce | - | 3.5 | 2.1 × 10⁻⁵ | 1.4 × 10⁻⁷ | -1.59 | -1.48 | - | [56] |
| Ni-Co/SA | AZ91D | 8.5 | 3.5 | 1.5 × 10⁻⁵ | 9.2 × 10⁻⁹ | -1.59 | -0.17 | - | [57] |
| Mg(OH)2/PMTMS/CeO2 | AZ31 | 8.04 | 3.5 | 1.5 × 10⁻⁵ | 2.4 × 10⁻⁸ | -1.44 | -1.67 | 192 | [2] |
| PDMS/SiO2 | AZ31 | - | 3.5 | 6.9 × 10⁻⁵ | 1.2 × 10⁻⁶ | -1.45 | -1.11 | - | [58] |
| PAPTMS/PP | AZ31 | 10.5 + 49.5 | 3.5 | 5.1 × 10⁻⁵ | 9.0 × 10⁻⁸ | -1.51 | -1.38 | 250 | Present work |
Fig. 1 shows the preparation mechanism of the PAPTMS/PP coatings. In the first place, the formation mechanism of PAPTMS coatings as follows:
X-Si(OR)3 + 3H2O → X-Si(OH)3 + 3R-OH (14)
X-Si(OH)3 +X-Si(OH)3 →3X-Si-O-Si-X +3H2O (15)
X-Si(OH)3 +3Mg-OH →3Mg-O-Si-X + 3H2O (16)
Eq. (14) shows that the X-Si(OH)3 was obtained by hydrolysis of APTMS [2]. Then, when the AZ31 substrate pretreated with NaOH solution were immersed into the prepared APTMS solution, the Si-O-Si bands were obtained by hydrolysis-condensation reaction of X—Si(OH)3 with X—Si(OH)3 [59]. Meanwhile, Eq. (16) shows the Si-O-Mg bands were formed on the substrate by condensation of —OH groups with X—Si(OH)3. Result confirmed the PAPTMS coatings were successfully prepared on AZ31 substrate.
PP is of non-polarity, and PP-g-MAH has strong polarity. PP coatings could be successfully prepared blending a small amount of PP-g-MAH. Firstly, the —CONH and —COOH or —N(CO)2R and H2O were formed by the reaction of —COO—OC with —NH2 [44]. Then, some —COO—OC were hydrolyzed —COOH at room temperature [60]. The —CONH was obtained by the reaction of -NH2 with —COOH [61]. The formation mechanism of the reaction of PP-g-MAH with PAPTMS is as follow:
RCOO-OCR + H2N-Si-O-Mg → RCONH-Si-O-Mg + COOH (17)
RCOO-OCR + H2N-Si-O-Mg → R(CO)2N-Si-O-Mg + H2O (18)
RCOO-OCR + H2O→2RCOOH (19)
RCOOH + H2N-Si-O-Mg → RCONH-Si-O-Mg + H2O (20)
Interestingly, the molecular chain structures of PP-g-MAH and PP are similar. They possess preferably affinity and compatibility, and then the molecular chains diffuse to form strong intertwined structures. Thus, the interface between PP-g-MAH and PP is blurred or disappeared [62].
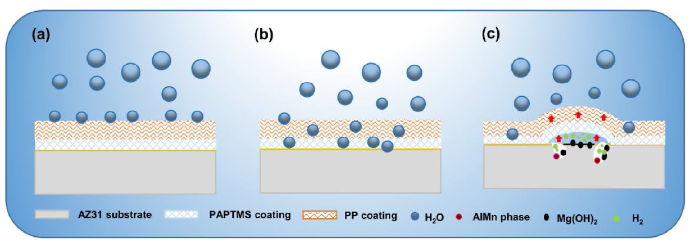
Fig. 14 depicts the schematic diagram of the corrosion mechanism of the PAPTMS/PP coating. The samples needed to be completely immersed in NaCl solution. In the preliminary stage of immersion (Fig. 14(a)), PP coatings as a physical barrier to resist the ingress of H2O molecules due to its hydrophobic properties (Fig. 5) and low water permeability (Fig. 13). As the immersion time increases (Fig. 14(b)), PP coatings were slowly penetrated by H2O molecules and aggressive Cl¯ ions. The PAPTMS coating continued as a function of the immersion time due to swelling. Then, the substrate was exposed to the H2O molecules and Cl- ions. Because the potential of Al-Mn phase is much higher than α-Mg matrix, pitting corrosion appeared around the Al-Mn phase due to the dissolution of the surrounding α-Mg [63], and then the corrosion extended to the entire surface. The mechanism of electrochemical corrosion as follows:
Mg + 2H2O → Mg(OH)2 + H2↑ (21)
With the production of Mg(OH)2 on the specimen, the CO2 molecules (comes from air) and Cl$\bar{i}$ons would react with Mg(OH)2 to form MgCO3 and MgCl2. The reaction as follows:
Mg(OH)2 + CO2 → MgCO3 + H2O (22)
Mg(OH)2 + Cl→ MgCl2 (23)
After an intensive immersion (Fig. 14(c)), the Mg(OH)2 and H2 gradually increased, causing the peeling off of PAPTMS/PP coating. The pH values were also recorded: the AZ31 substrate (from 6.34 ± 0.03 to 9.39 ± 0.15), the PAPTMS coatings (from 6.28 ± 0.05 to 8.18 ± 0.12), and the PAPTMS/PP coatings (from 6.20 ± 0.01 to 7.21 ± 0.11). Results demonstrated that the PAPTMS/PP coatings possessed excellent corrosion resistance.
Fig. 14. Schematic diagram of the corrosion mechanisms of the PAPTMS/PP coatings.
(1)PP coatings with spheroidal structures on a micrometer level were successfully prepared on PAPTMS pretreated Mg alloys. PAPTMS/PP coatings exhibited a superhydrophobic surface with a CA of 162 ± 3.4° and SA of 5 ± 0.6°, respectively; and possessed self-cleaning ability due to the lower surface energy (γS = 10.38 mJ/m2).
(2)Water diffusion coefficient and water adsorption volume fraction were 8.12 × 10⁻¹⁰ cm2/s and 24.5 %, respectively, revealing that the PAPTMS/PP coating possessed low water permeability and excellent barrier performance.
(3)Corrosion current density of PAPTMS/PP coatings decreased about three orders of magnitude compared with AZ31 substrate, indicating that the superior corrosion protection of the composite coatings, which could be ascribed to the super-hydrophobicity and low water permeability properties.
(4)PAPTMS/PP coatings could find promising applications for Mg alloys.
This work was supported by the National Natural Science Foundation of China (51571134) and the SDUST Research Fund (2014TDJH104). Thanks go to Dr. Zhen-lin Wang from Chongqing University of Technology for the scratch tests with his help.
Supplementary material related to this article can be found, in the online version, at doi:https://doi.org/10.1016/j.jmst.2019.08.056.

 WeChat
/
| 〈 |
|
〉 |

