Search for articles:
Yong Hua , Sikiru Mohammed, Richard Barker, Anne Neville
Corresponding authors:
Received: 2019-04-29
Revised: 2019-06-14
Accepted: 2019-08-14
Online: 2020-03-15
Copyright: 2020 Editorial board of Journal of Materials Science & Technology Copyright reserved, Editorial board of Journal of Materials Science & Technology
More
Abstract
Appropriate materials for injection pipelines and tubing for carbon dioxide geologic storage is fundamental to ensure asset integrity and save cost. This paper evaluates the corrosion behaviour of X65, 1Cr, 3Cr and 5Cr, which have the potential to be injection pipeline/tubing materials. The influence of steel Cr content on the general and localised corrosion behaviour was investigated at time periods from 6 to 192 h at 60 °C and 100 bar. The evolution, morphology and chemistry of corrosion products on the surface of each material were evaluated using a combination of scanning electron microscopy, energy dispersive X-ray spectroscopy and X-ray diffraction and related to their overall corrosion protection. Results indicate that prior to the formation of protective films on the steel surfaces, the resistance of the materials to corrosion increase with increasing Cr content (Corrosion resistance: X65 < 1Cr<3Cr<5Cr). However, as corrosion products evolve, the protection afforded to the different steels significantly varies and decreases with increasing Cr content. × 65 becomes the material with the lowest general corrosion rate by the end of the 192 h experiments and 5Cr exhibits the highest corrosion rate (ranking of corrosion resistance: X65 > 1Cr>3Cr>5Cr). In terms of the corrosion products on X65, both inner amorphous and outer crystalline corrosion layers consist of FeCO3. For the Cr-containing steels, the outer layer also comprises FeCO3, but the inner layer is enriched with Cr, and is predominantly amorphous Cr(OH)3. The extent of localised corrosion (determined using surface profilometry) is noticeably less for X65 compared to the Cr-containing steels. The paper raises questions about the benefits that low Cr steels offer towards extending component design life compared to carbon steel under the test conditions considered here.
Keywords:
Carbon capture and storage is considered as one of the main technologies available to assist in the abatement of climate change. The process has the potential to enable significant sequestration of high-pressure carbon dioxide (CO2) in both depleted oil and gas fields and geological reservoirs. CO2 injection can also be used for the purposes of enhanced oil recovery to extend the lifetime of oil and gas reservoirs.
Given the processes involved in CO2 sequestration, corrosion of equipment can occur when large amounts of CO2 in the dense phase are injected into storage sites. The injection pipeline receives compressed CO2 typically in a liquid or supercritical state. When continuous injection is performed down a vertical line, water is displaced from the head of the pipeline. If the continuous process is ever interrupted, brine will proceed to flow back to the injection point, potentially rising hundreds of meters up the injection line before equilibrium is re-established [1]. Consequently, during this period the injection materials become exposed to a saline solution saturated with high-pressure CO2. These sections of the line which are in contact with the CO2-containing brine can suffer particularly high levels of corrosion. Based on this, it is important to understand the corrosion severity under such static conditions and to select appropriate materials to ensure the integrity of the line for the duration of its intended operation.
The most cost-effective material for injection systems from the perspective of capital expenditure is carbon steel. However, this material is notoriously susceptible to CO2 corrosion in the absence of protective corrosion products, making it prudent to also consider alternative materials to reduce operational expenditure if a particularly long design life is required [[1], [2], [3]]. Past research has highlighted the potential of low chromium (Cr) containing steels to offer improved strength, hardenability and corrosion resistance compared to carbon steel [[4], [5], [6], [7]]. These steels typically contain between 1 % and 5 % Cr and can provide a cost effective alternative compared to corrosion resistant alloys (CRAs) [[5], [6], [7], [8], [9], [10], [11], [12], [13]]. Kermani and Morshed [9] suggested that the use of 1-5Cr steel can improve the CO2 corrosion resistance by a factor of 2.5-40 with a cost penalty less than 1.5 times that of carbon steel.
There is a wealth of research reaching back to the 1980s [1,7,8,10,[14], [15], [16], [17], [18], [19]] focusing on the influence of 1 %-5 % Cr addition on steels to improve strength, hardenability and CO2 corrosion resistance, with the majority of observations concluding that Cr addition does improve corrosion performance [7,10]. In addition, a number of successful field trials have been reported [14,20] about the use of low Cr alloyed steels. However, a handful of researchers have identified adverse effects of Cr addition (i.e, a reduction in corrosion resistance of low alloyed steel with increasing Cr content) [14,[21], [22], [23]] under specific operating conditions, presenting conflicting observations. Amit et al. [23] reported 3Cr steel has a higher corrosion rate of 0.78 mm/year compared to the corrosion rate of 0.23 mm/year for 1Cr steel at 135 °C.
One critical observation is the role of Cr-containing steel on influencing the chemistry, structure and morphology of corrosion products and how they contrast with corrosion products on carbon steels. In the majority of experiments, researchers have reported that corrosion rates begin to decline as protective corrosion products establish themselves [24,25]. In simple CO2-containing brines with only sodium chloride (NaCl) as a dissolved salt, authors have reported the corrosion product iron carbonate (FeCO3) developing on carbon steel which assists in mitigating corrosion. However, for Cr-containing low alloy steels, the films can become enriched with undissolved Cr and some of its compounds, supposedly facilitating general and localised corrosion protection [1,16,26,27]. Researchers have also reported the development of duplex structures of the corrosion film on Cr-containing steels, consisting of an inner and outer layer [21,26]. The Cr-enrichment of the inner film was believed to not only provide superior general and localised corrosion protection, but also assist in the prevention of local destruction of films by mechanically strengthening the corrosion product [21,26].
Despite an abundance of research into the potential advantages of low Cr alloyed steels, nearly all of the aforementioned studies have been conducted in environments at relatively low pressure where CO2 exists in its gaseous state and conditions are more akin to what is seen in oil and gas transport, not in high-pressure CO2 injection. A few exceptions to this exist whereby Hassani et al. [15] evaluated the behaviour of 1018 carbon steel, 5Cr and 13Cr at 80 bar CO2 and 60 °C, and indicated that 5Cr was 3 times more corrosion resistant than carbon steel under such conditions, yet still produced a corrosion rate of 6 mm/year over 42 h of immersion. Pfennig et al. [28] also determined the corrosion resistance of 1Cr and 13Cr in both the brine and supercritical CO2 phase at 100 bar and 60 °C. Their research suggested that 1Cr was capable of handling the CO2 stream conditions and the CO2-saturated brine phase, producing corrosion rates comparable to 13Cr over 8000 h exposure, below 0.2 mm/year. However, no comparison was made with carbon steel, 3Cr or 5Cr under these specific conditions or across non-film forming conditions.
This work addresses the knowledge gap in the area of low Cr alloy behaviour in static high-pressure CO2 environments by evaluating the corrosion response of four different steels (X65, 1Cr, 3Cr and 5Cr) over time periods between 6 and 192 h at 60 °C and 100 bar in a 1 wt.% NaCl solution. By examining all four materials, the influence of Cr content within the steel on the general and localised corrosion behaviour was investigated. The evolution, morphology and chemistry of corrosion products on the surface of each material were evaluated over time periods of 6, 24, 48, 96 and 192 h and related to the level of localised and general corrosion protection. In these experiments, a high surface area to volume ratio was deliberately chosen to generate significant film formation in a shorter timeframe. To understand the film formation characteristics, a combination of short duration and long duration experiments was performed. The focus of the short term (6 h) experiments was predominantly to understand the corrosion behaviour of the steels in the absence of protective corrosion products. These experiments can be thought of as more analogous to field conditions in an environment with a solution under-saturated with respect to various corrosion products. In longer duration tests, it is appreciated that a new set of equilibrium conditions become established at higher pH and greater Fe2+ concentration in the bulk solution, which is a limitation of the closed system test methodology. However, the focus from long term experiments (192 h) is to determine the nature of the films developed when precipitation does occur, and to evaluate the extent of protection they offer to the substrate in relation to both general and localised corrosion.
The experiments conducted within this work attempt to simulate the process encountered during intermittent injection of CO2, whereby the brine rises back up the pipeline when injection ceases for a number of days. In this situation, a static fluid with a fixed volume is in contact with a specific internal area of pipeline.
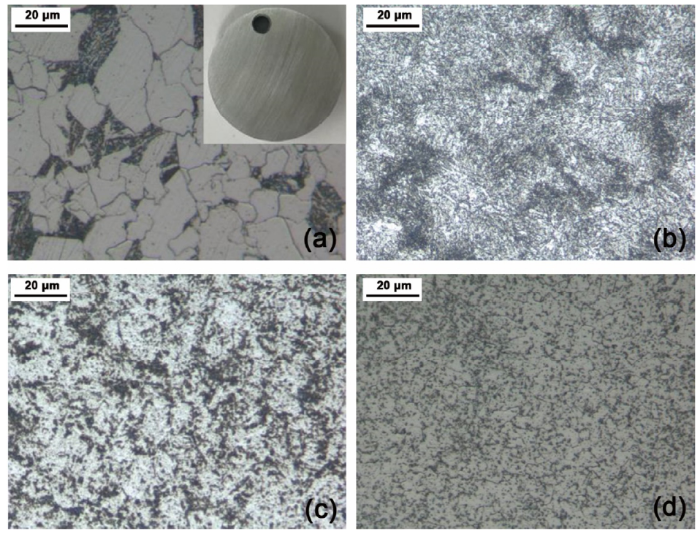
All corrosion rates were measured based on gravimetric analysis of test specimens exposed to the brine solution for different durations between 6 and 192 h using a 1 L stainless steel autoclave. Mass loss specimens were machined from X65 carbon steel, 1Cr, 3Cr and 5Cr steel bars into discs with a diameter of 25 mm and a thickness of 6 mm (an image of the prepared sample is embedded in Fig. 1(a)). The chemical compositions of each of the materials considered are provided in Table 1. Surface preparation consisted of wet-grinding the entire sample surface with 600 grit silicon carbide (SiC) abrasive paper, rinsing with distilled water, followed by acetone, high purity ethanol and drying gently with compressed air. Samples were then stored in a desiccator until needed and weighed immediately before use on an electronic balance to within an accuracy of 0.01 mg before suspending inside the autoclave. Two samples were placed in the autoclave for each test, with experiments being repeated for a minimum of 3 times.
Fig. 1. Optical microscope images of microstructures for (a) X65, (b) 1Cr, (c) 3Cr and (d) 5Cr. Note: A typical sample coupon is shown in the insert in (a).
Table 1 Elemental compositions of X65, 1Cr, 3Cr and 5Cr steels (wt.%).
| Steel | C | Si | Mn | P | S | Cr | Fe |
|---|---|---|---|---|---|---|---|
| X65 | 0.12 | 0.18 | 1.27 | 0.008 | 0.002 | 0.11 | Balance |
| 1Cr | 0.35 | 0.35 | 0.75 | 0.035 | 0.05 | 1.12 | Balance |
| 3Cr | 0.24 | 0.21 | 0.53 | 0.005 | 0.0015 | 3.10 | Balance |
| 5Cr | 0.35 | 0.85 | 0.4 | 0.012 | 0.002 | 5.00 | Balance |
Surface preparation for microstructural characterisation consisted of wet-grinding one sample surface up to 1200 grit SiC abrasive paper, followed by polishing using a polishing cloth with a 3 μm diamond suspension to attain a mirror finish. Etchant concentration was varied depending on the sample alloy composition in accordance with in ASTM E3-01 [29] and E407-99 standards [30]. 2 %-5 % Nital solution was used for the different materials, with etching time varying from 10-20 s. Microstructural analysis was carried out using a LEICA DM 6000 M upright optical microscope.
The microstructures of X65, 1Cr, 3Cr and 5Cr samples are presented in Fig. 1. A ferritic-pearlitic microstructure was observed for X65 carbon steel. The microstructure of 3Cr shows carbides randomly distributed and the microstructure of 5Cr indicated carbides as dark areas in a ferrite matrix, while 1Cr shows an inhomogeneous distribution of martensite and ferrite.
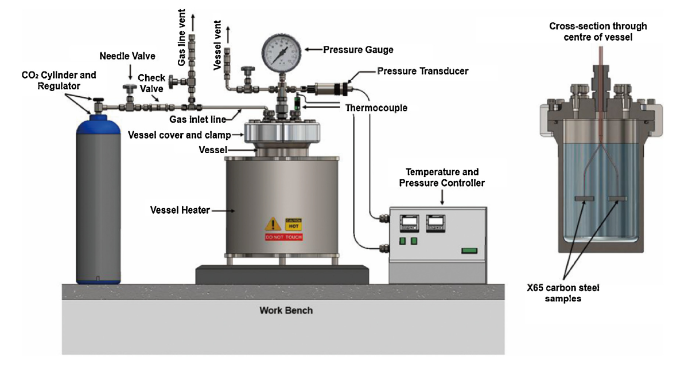
A schematic representation of the autoclave experimental setup is provided in Fig. 2 [[31], [32], [33]]. The 1 wt.% NaCl solution used in each experiment was de-aerated by saturating the solution with CO2 in a separate container for a minimum of 12 h prior to testing. The specimens were suspended within the autoclave using a non-conducting wire whilst also ensuring they were not in contact with the walls of the cylinder to prevent galvanic effects. The prepared, CO2-saturated water was carefully delivered into the autoclave at ambient pressure and temperature and sealed. All lines to the autoclave were then purged with CO2 and evacuated to ensure complete removal of oxygen within the system. The CO2 was then transferred into the autoclave and heated and pressurised to the required temperature and pressure. The starting point of each test was taken from the time at which the autoclave reached the desired temperature and pressure of 60 °C and 100 bar, respectively. Experiments for each material were conducted for 6, 24, 48, 96 and 192 h to determine the changes in corrosion rate with time in static conditions. MultiScale [34] software was used to calculate the initial pH of the brine solution and was determined to be approximately 3.1 under the specified conditions.
Fig. 2. Schematic of autoclave setup.
Upon completion of each test, the specimens were dried thoroughly. They were then weighed and chemically cleaned to remove all traces of corrosion products before weighing again to determine the mass of corrosion product on the steel surface as well as the corrosion rate. The cleaning process consisted of wiping the surface with a cotton pad soaked in Clarke’s solution (20 g antimony trioxide +50 g stannous chloride +1000 mL 38 % hydrochloric acid) in accordance with ASTM Standard G1-03 [35]. After cleaning, samples were rinsed with distilled water, followed by ethanol, before being dried with compressed air.
The mass loss due to corrosion was determined from the mass difference before exposure and after cleaning. The corrosion product mass is the difference before and after chemical cleaning, after exposure to the test environment.
The corrosion rates were calculated by using Eq. (1):
$V_c=\frac{87600Δm}{ρAT}$ (1)
where VC is the corrosion rate of the sample in mm/year, Δm is the mass loss in grams, ρ is the density of the sample in g/cm3, A is the exposed area in cm2 and T is the immersion time in hours.
The surface coverage and morphology of the corrosion products were characterised using a Carl Zeiss EVO MA15 SEM. Raman spectroscopy was used to identify the nature of the corrosion products locally on the surface and to detect the presence of potentially amorphous products not recorded by XRD.
Post-test profilometry measurements were performed on samples (scanning a 3 mm × 3 mm area at a time) using a NPFLEX 3D Surface Metrology System to quantify localised attack. The objective used 10× magnification with approximately a 3.5 mm working distance. The pit depth analysis was conducted in alignment with ASTM Standard G46-94 [36]. The standard stipulates that an average of the 10 deepest pits should be used for pit damage characterisation of the sample area.
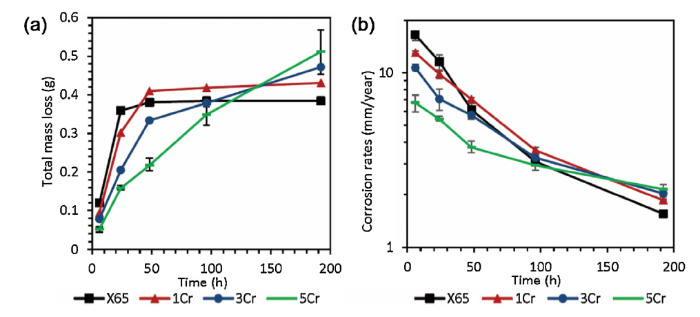
Fig. 3 presents the total mass loss and general corrosion rates of X65, 1Cr, 3Cr and 5Cr steel exposed to CO2-saturated 1 wt.% NaCl solution at 60 °C and 100 bar for different immersion time from 6 and 192 h. Fig. 3(a) expresses the mass loss as a function of time, while Fig. 3(b) indicates the average corrosion rates in mm/year for each material from 6 h to 192 h, assuming a uniform thickness loss over the steel surface.
Fig. 3. Plots depicting total mass loss (a) and general corrosion rates (b) for X65, 1Cr, 3Cr and 5Cr steel exposed to a CO2-saturated 1 wt.% NaCl solution at different immersion time at 60 °C and 100 bar.
Referring to Fig. 3(b), during the initial 6 h, the highest corrosion rate of 16.6 mm/year was observed for X65 carbon steel. The general corrosion rate over the first 6 h for each material decreased as Cr content increased; the general corrosion rate for 5Cr was 6.7 mm/year, which was 2.5 times lower than that for X65 carbon steel. SEM images later in this work indicate iron carbide (Fe3C) exposure due to the fast and selective dissolution of ferrite for X65. The images also indicate that the corrosion products on the carbon steel surface are minimal over this period. For the different Cr steels, a corrosion product layer was already evident on the steel surface after 6 h.
The general corrosion rates of X65, 1Cr, 3Cr and 5Cr steel over 192 h were 1.5, 1.9, 2.0 and 2.1 mm/year, respectively. Despite the materials showing a clear benefit of higher Cr content during the initial 6 h, longer duration tests reflect that Cr addition has much less benefit in terms of material dissolution, arguably demonstrating a negative effect on long-term corrosion behaviour in the closed system. This difference in corrosion rate is actually more significant than the 192 h average corrosion rates indicate. For example, by considering the time intervals and mass loss between 96 and 192 h in Fig. 3(a), X65, 1Cr, 3Cr and 5Cr have corrosion rates of ∼0.01, 0.10, 0.75 and 1.32 mm/year which is much more significant than the integrated corrosion rates represented in Fig. 3(b).
The reduction in corrosion rates over the duration of 192 h for all samples is likely attributed to the formation of protective corrosion products on the steel surface. The following sections of this paper focus on identifying the key differences between the film structures, morphology and composition to understand the difference between the four materials in terms of their corrosion rates.
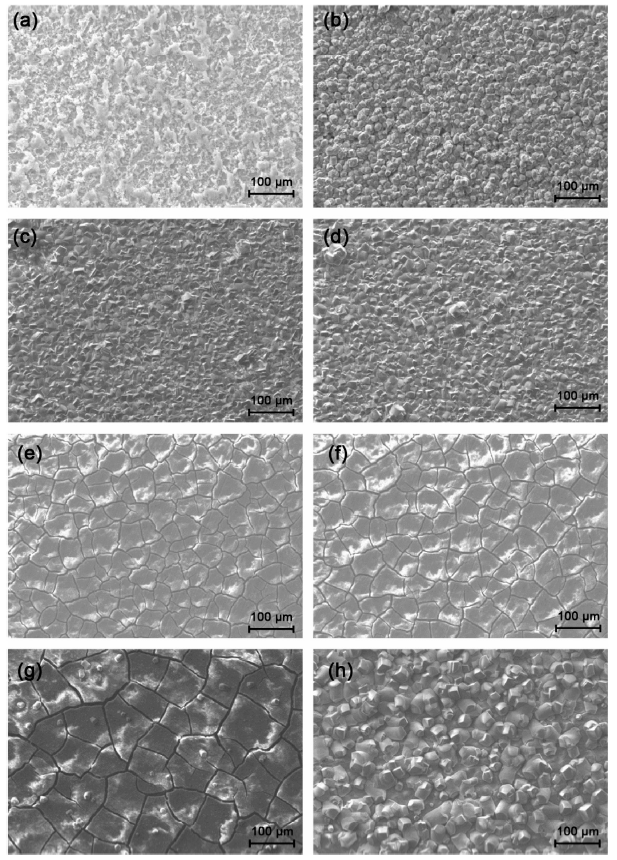
The largest difference in general corrosion rate was observed for X65 and 5Cr as expected. Consequently, the evolution of corrosion products on these two surfaces was studied in detail using SEM. Images of the top surface morphology formed on X65 carbon steel and 5Cr at various immersion times are shown in Fig. 4, and the corresponding cross-sections featuring the thickness of corrosion products are provided in Fig. 4, Fig. 5.
Fig. 4. SEM images of surface morphology of corrosion products formed on X65 exposed to a CO2-saurated 1 wt.% NaCl solution at 60 °C and 100 bar for various immersion periods of 6 h (a), 24 h (b), 96 h (c) and 192 h (d). The corrosion products for 5Cr exposed to a CO2-saurated 1 wt.% NaCl solution at 60 °C and 100 bar for immersion periods of 6 h (e), 24 h (f), 96 h (g) and 192 h (h). The corresponding cross-sections are provided in
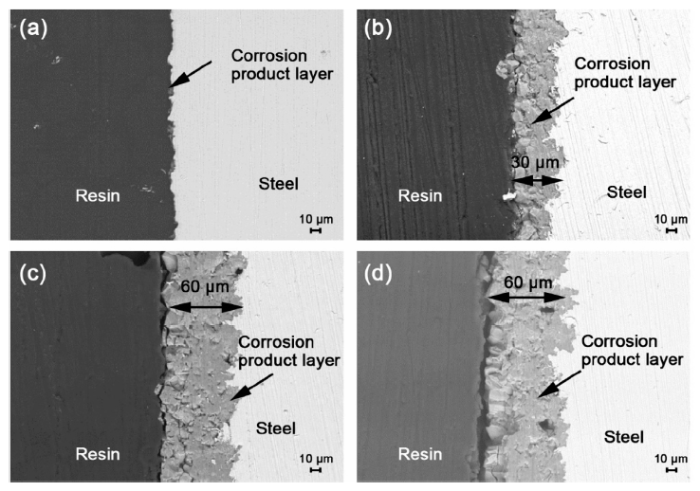
Fig. 5. Corresponding cross sections of corrosion products formed on X65 carbon steel exposed to a CO2-saturated 1 wt.% NaCl solution at 60 °C and 100 bar for various immersion periods of 6 h (a), 24 h (b), 96 h (c) and 192 h (d).
After the first 6 h, a thin Fe3C layer of approximately 1 μm appeared on the X65 steel surface due to the high rate of ferrite dissolution (Fig. 4(a)). (Confirmation of the revealing of this Fe3C layer was provided using XRD in our previous publication. [31]) Crystals then began to cover the steel surface after 24 h (shown in Fig. 4(b)). Although the layer developed after 24 h was 30 μm thick, gaps in the corrosion product were still visible where the electrolyte could easily access the steel substrate. After 96 h, a dense and more compact layer covered the entire surface and increased to a relatively uniform thickness of 60-65 μm. This layer contributed towards a reduction in corrosion rate. No significant change in the film morphology was observed beyond 96 h as shown in Fig. 4(c) and (d).
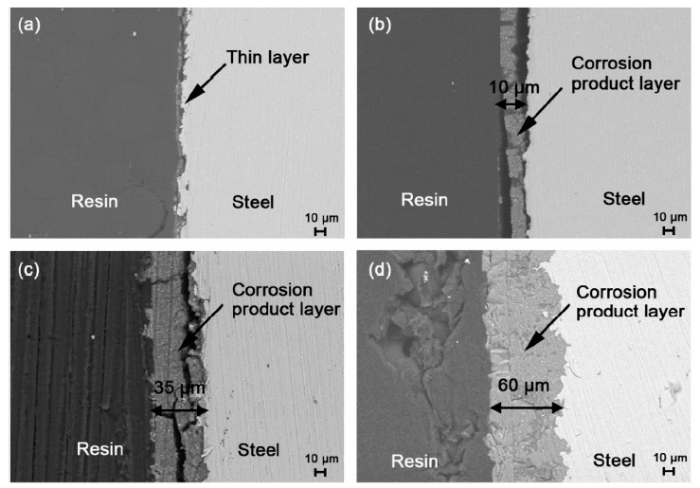
To compare with the corrosion products formed on X65 carbon steel, Fig. 4(e)-(h) presents the SEM top view images of 5Cr steel exposed to the CO2-satuated solution at 60 °C and 100 bar for various immersion time (with corresponding cross-sections in Fig. 6). The SEM images of the 5Cr steel surface showed a very different structure over the first 24 h of exposure compared to X65 steel. The images in Fig. 4(e) and (f) feature a dehydrated/cracked, seemingly amorphous corrosion product film on the surface (based on cross-sections provided in Fig. 6(a)-(c)). There was no difference in top view morphologies between 6 and 24 h, however, the thickness of the corrosion product layer increased from 1 μm to 10 μm (see Fig. 6(a) and (b)). It is clear from these images that the corrosion product which develops on the low Cr steel is generated very quickly, and this may be responsible for its superior corrosion resistance compared to X65 in the early stages of corrosion. However, it is important to stress that although this amorphous film may result in a lower corrosion rate/mass loss compared to X65 over the first 24 h in Fig. 3(a), the corrosion rate of 5Cr is still ∼4.5 mm/year between 6 and 24 h based on mass loss values.
Fig. 6. SEM images of surface morphology and corresponding cross sections of corrosion products formed on 5Cr steel exposed to a CO2-saturated 1 wt.% NaCl solution at 60 °C and 100 bar for various immersion periods of (a) 6 h, (b) 24 h, (c) 96 h and (d) 192 h..
Crystals became visible under the SEM after 96 h exposure of 5Cr to the test solution (Fig. 4(g)), and were randomly distributed on top of the initially developed layer. After 192 h of exposure (Fig. 4(h)) the corrosion product produced a two-layer structure, and the formed crystals started to cover the entire surface. The thickness of the corrosion product layer was measured as approximately 60 μm after 192 h, which was very similar to that of X65 at the same exposure time. However, in contrast to the crystalline film observed on X65 steel after 192 h, there are still identifiable gaps between crystals. Comparing the development of the crystals in Fig. 4(f)-(h) with the mass loss values for 5Cr in Fig. 3(a), the rate of mass loss does not significantly change from 24 to 192 h. A relatively linear increase in mass loss is observed with time, despite the crystals clearly developing on the steel surface. This suggests that the inner amorphous layer is dictating the corrosion response of the steel surface, which is sensible given the crystals are not in direct contact with the substrate and appear not to present a particularly resistant diffusion barrier based on SEM analysis. Such behaviour contrasts with that of X65 steel under the same conditions where a more compact crystalline film has developed over the same time period.
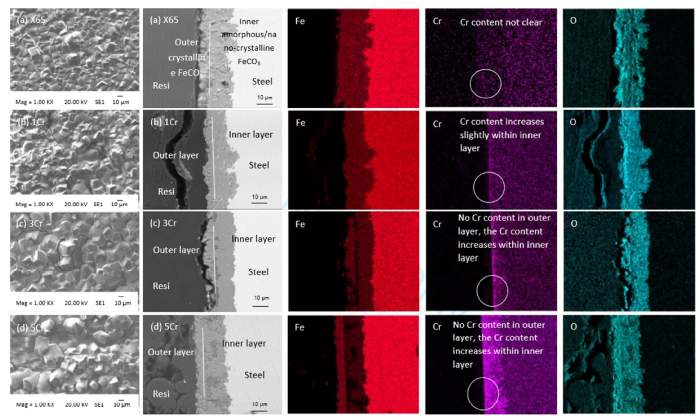
To understand the chemistry of the two-layered corrosion product, a combination of energy dispersive x-ray (EDX), XRD and Raman spectroscopy was employed. The EDX analysis of X65, 1Cr, 3Cr and 5Cr steel cross-sections and element distribution maps of the corrosion product layers after 192 h of immersion are presented in Fig. 7. The results show that the thickness of the corrosion products for X65, 1Cr, 3Cr and 5Cr are similar, reaching approximately 60 μm after 192 h exposure. Additionally, all samples display a duplex, or double layered structure comprising of an inner and outer layer. For X65 steel, the inner and outer layer chemical composition is very similar, comprising of mainly Fe, C and O. However, in the case of the Cr-containing steels, the inner layer contained significant levels of Cr, exhibiting a greater intensity in the EDX maps than that of the steel microstructure. This enrichment of Cr was particularly high at the interface between the inner and outer layer. Referring to Fig. 3, Fig. 6, it is the formation of this inner Cr-rich layer on the low Cr-containing steels which contributes most towards the corrosion resistance and reduces the corrosion rates. In terms of the outer layers on the Cr-steels, only Fe, C, and O could be identified, with minimal Cr being detected.
Fig. 7. SEM cross-section images and EDX maps of X65 (a), 1Cr (b), 3Cr (c) and 5Cr (d) samples exposed to CO2-saturated solution at 100 bar and 60 °C for 192 h.
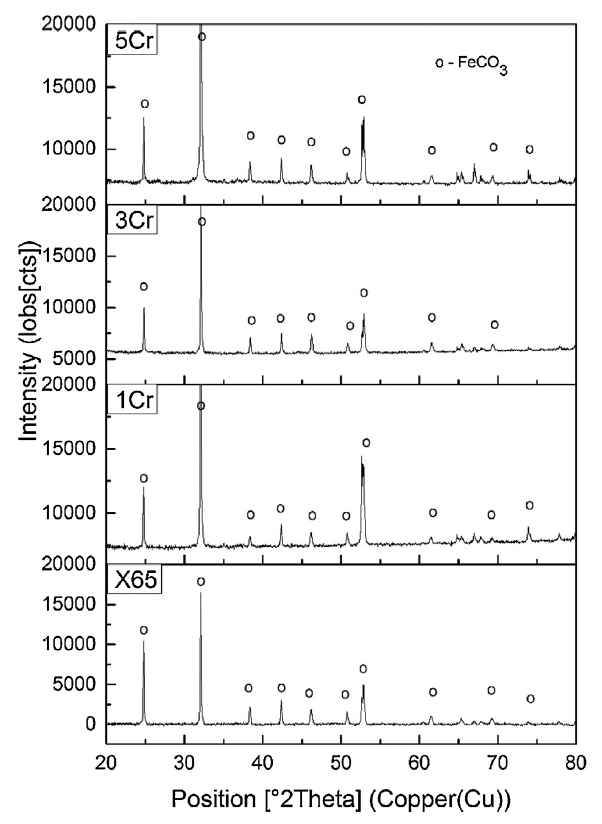
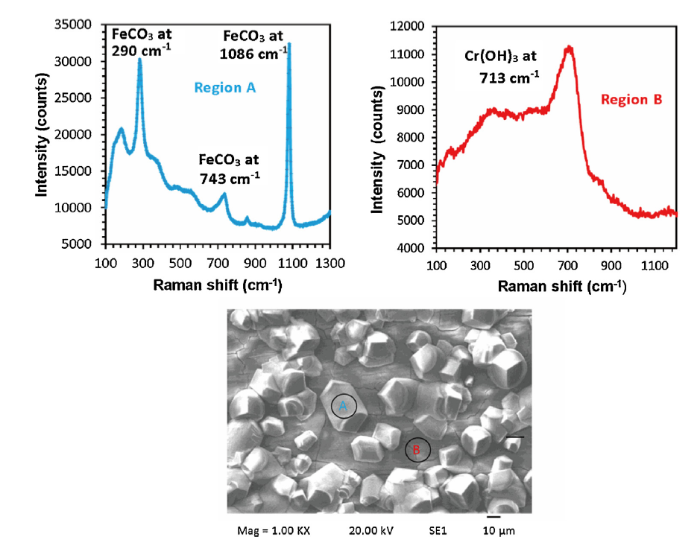
To identify the nature of the corrosion product layers on different steel surfaces after 192 h, XRD measurements were also conducted. The corresponding patterns provided in Fig. 8 showed that the only crystalline phase detected on all materials after 192 h was FeCO3 which relates to the crystals visible on the outer layer. This observation agrees with the work done by Nazari et al. [37], who indicated that FeCO3 formed on X70 samples exposed to 65 °C and pH in the range of 5.5-6.5. No traces of crystalline Cr compounds within the corrosion product layer were detected on any of Cr-containing steels using XRD, indicating that the products are nano-crystalline or amorphous. This observation corroborates with the work of Guo et al., [10] who showed through Transmission Electron Microscopy (TEM) analysis, that the inner layer of 2Cr exposed to a CO2-containing environment possessed an amorphous structure. Raman spectroscopy was used to further identify the inner film on both X65 and the low Cr steels. The spectra provided in Fig. 9 relate to two scans conducted on 5Cr steel; one on the outer layer, and another on the inner layer which was analysed through the gaps present in the outer layer. The spectra are representative of the scans obtained on all three Cr-steels in that for the outer layer, three peaks located at 290, 743 and 1086 cm-1 confirmed the presence of FeCO3 (blue spectra - Region A) and one peak located at 713 cm-1 for the scan on the inner layer confirmed the presence of chromium hydroxide (Cr(OH)3) (red spectra - Region B). In some spectra, traces of FeCO3 (potentially amorphous or nano-crystalline) were also detected within the inner layer, though this mainly comprised of Cr(OH)3. Similar observations of Cr(OH)3 have been reported by Xu et al. [6] who evaluated the corrosion behaviour of 1-6.5Cr steels in CO2-saturated formation water. They also reported that the inner amorphous layer is mainly comprised of Cr(OH)3 by Raman analysis, with the detected main Cr(OH)3 peak being observed at 713 cm-1 by scanning Cr(OH)3 powders. Similar conclusions were also made by Guo et al. [10] who used TEM and XPS analysis to identify the inner layer of 2Cr steel and observed it is comprised of amorphous FeCO3 and Cr(OH)3. Xu et al. [5] also studied the corrosion behaviour of 3Cr steel in CO2-satuated formation water at 80 °C and 8 bar pCO2 and have reported the same double layer structure consisting of a crystalline FeCO3 layer on the top of an inner amorphous Cr-rich layer.
Fig. 8. XRD patterns of X65, 1Cr, 3Cr and 5Cr samples exposed to a CO2-saturated 1 wt.% NaCl solution at 100 bar and 60 °C for 192 h.
Fig. 9. Raman spectroscopy of corrosion products at particular positions from 5Cr steel exposed to a CO2-saturated 1 wt.% NaCl solution at 60 °C and 100 bar for 192 h.
In addition to evaluating the role of corrosion product growth on the general corrosion behaviour, consideration is also afforded here to the propagation of pits on each steel surface as a function of time.
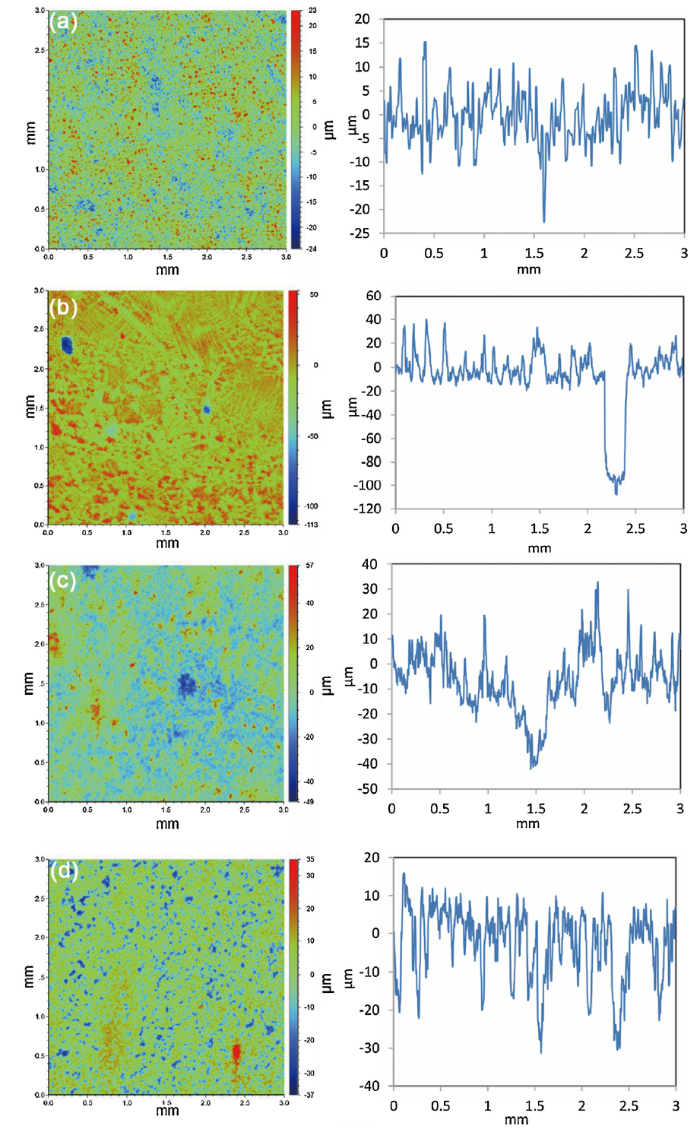
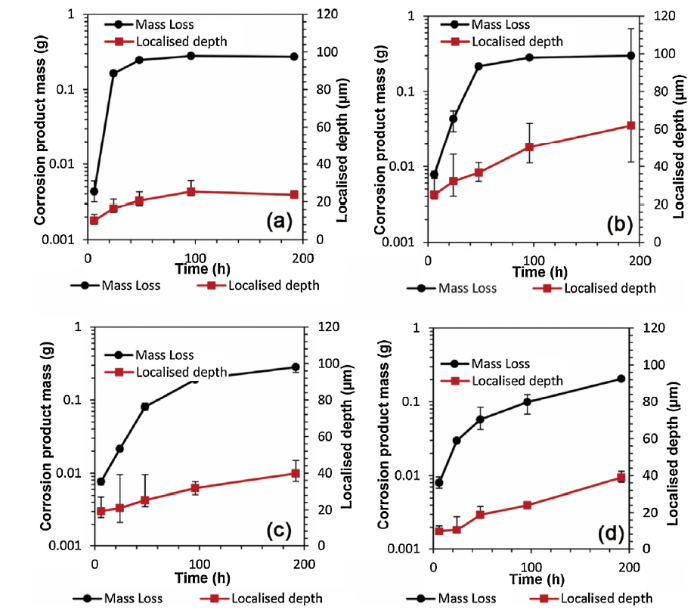
Surface profilometry measurements (examples provided in Fig. 10) were performed after corrosion products were removed using Clarke’s solution on every material after exposure to the test solution for 6, 24, 48, 96 and 192 h. Fig. 11 shows the mass of the corrosion products formed on sample surfaces and the localised depth for X65, 1Cr, 3Cr and 5Cr steel exposed to CO2-saurated solution at 60 °C and 100 bar for different immersion time.
Fig. 10. Example of profilometry images for X65 (a), 1Cr (b), 3Cr (c) and 5Cr (d) steel surfaces after removal of corrosion products after exposure to a CO2-saturated 1 wt.% NaCl solution at 100 bar and 60 °C for 192 h.
Fig. 11. Mass of corrosion products formed on sample surface and measured pit depth for X65 (a), 1Cr (b), 3Cr (c) and 5Cr (d) exposed to a CO2-saturated 1 wt.% NaCl solution at 60 °C and 100 bar at various immersion time.
For X65, the compact FeCO3 layer provides protection against localised corrosion beyond 96 h. However, 1Cr, 3Cr and 5Cr steels show higher localised attack which continues to propagate over the entire 192 h period. The localised depth of 1Cr, 3Cr and 5Cr exceeded that of X65, with 1Cr being the most susceptible to localised corrosion with a pit depth of 62 μm after 192 h. Interestingly, the FeCO3 inner layer on X65 steel suppresses pit propagation, while the inner layer which develops on 1Cr, 3Cr and 5Cr (which mainly comprises of Cr(OH)3) fails to fully suppress pit propagation over 192 h.
This research highlights that prior to the formation of a fully protective FeCO3 layer on the steel surface, the corrosion resistance of the materials increased with increasing Cr content, agreeing with previous studies [7,10]. However, an important message from this work is that as the corrosion products grow over 192 h, the protection afforded to the different steels decreases with increasing Cr content. The results in Fig. 3 show that X65 has the lowest corrosion rate after 192 h exposure and 5Cr becomes the material with the highest corrosion rate. The results also highlight the limitations of inferring corrosion behaviour of materials and their ranking based on experiments over individual fixed time intervals. For example, referring back to Fig. 3, any single set of mass loss measurements at a particular time interval before 96 h would produce the conclusion that increasing Cr content in the steel improves general corrosion resistance. However, extended tests performed in this work show this is not the case for this particular environment beyond 96 h if a corrosion product is capable of developing on the steel surface.
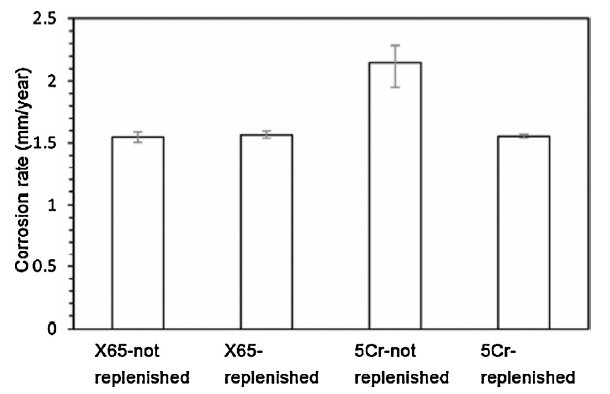
As discussed earlier in this paper, a limitation of the closed vessel experiment is the change in brine chemistry as a function of time and the consequences this has on the corrosion products formation as well as material corrosion behaviour. In order to address this issue and ensure the correct conclusions regarding the protectiveness of the corrosion products developed, solution replenishing was conducted after 48 h for X65 and 5Cr steel. At this instance in time, a fully formed FeCO3 layer was present on X65 steel (shown by the stable corrosion product mass in Fig. 11(a)), while solely the amorphous Cr(OH)3 layer was established on the 5Cr steel. The effect of solution replenishing is shown in Fig. 12, which represents the average corrosion rate over 192 h. The results show that the films formed on X65 and 5Cr after 48 h are as protective as the 192 h data in Fig. 3(b) suggests. This is important as the reduction in corrosion rate with time could be attributed to the change in solution chemistry, not the establishment of the film, and it is important to decouple these effects from one another to understand the true protectiveness of the developed corrosion products.
Fig. 12. Corrosion rates for X65 and 5Cr after 192 h exposure to a CO2-saturated 1 wt.% NaCl solution at 60 °C and 100 bar. The graphs illustrate the effect of replenishing the test solution after 48 h.
The corrosion of carbon steel and low Cr steels in CO2-containing brines is facilitated through the hydration of CO2 which produces carbonic acid (H2CO3). The dissociation of H2CO3 in two steps produces the acidity (H+) within the aqueous phase.
The cathodic reactions of steel are related to the reduction of H+ ions which are either supplied directly, or provided through the dissociation of H2CO3 at the steel surface via a buffering effect [38]. The resulting anodic reactions are either the dissolution of iron, chromium, or both into the solution, depending on the material composition:
Fe(s)→$Fe_{(aq)}^{2+}$+2e- (2)
Cr(s)→$Cr_{(aq)}^{3+}$+3e- (3)
The formation of the corrosion products such as FeCO3 and Cr(OH)3 has been reported by several researchers in CO2 environments [10,39,40] and occur when the products exceed their solubility locally within the system, resulting in precipitation onto the surface of the steel, typically via the following proposed processes:
$Fe_{(aq)}^{2+}+CO_{3(aq)}^{2-}$→FeCO3(s) (4)
Cr3++3OH-→Cr(OH)3 (5)
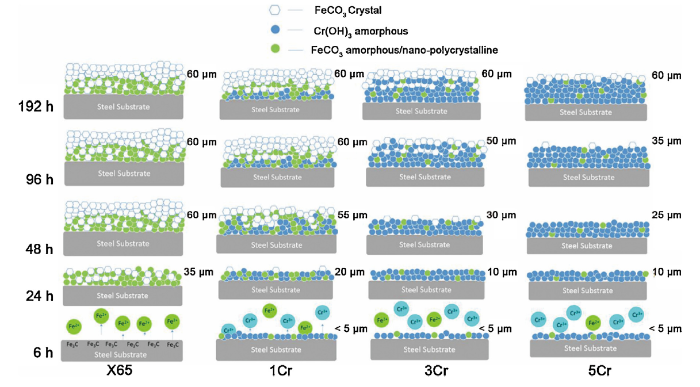
Based on the corrosion product analysis described previously, a schematic representation of the corrosion product formation processes on the four steel surfaces is provided in Fig. 13. With respect to X65 steel, the inner and outer layers begin to form at very similar time [31], with the inner layer displaying less signs of crystallinity. However, from the perspective of the Cr steels, the inner amorphous layer (which is predominantly Cr(OH)3, with potential traces of amorphous/nano-crystalline FeCO3) clearly develops first. Once this layer reaches a critical level of protectiveness/thickness, it is followed by the precipitation of the outer crystalline FeCO3 layer. Given the significant reduction in corrosion rate with time in the early stages of the Cr steels exposure, the majority, if not all of the protection is facilitated by the inner layer.
Fig. 13. Schematic model for the corrosion product evolution of inner and outer layer on X65, 1Cr, 3Cr and 5Cr steels.
Furthermore, the Cr enrichment within the inner layer increases with the Cr content of the steel and this Cr-rich layer provides the corrosion protection, however, the protective nature of these layers in the context of general corrosion reduces with increasing steel Cr content.
The effect of Cr enrichment also appears to have implications for localised corrosion, with a higher pit depth being recorded after 192 h for the Cr steels compared to X65. The inner layer also appears to facilitate the continued growth of pits, partially aided by enabling easier access of the electrolyte to the steel surface in comparison to the compact crystalline FeCO3 layer on the X65 steel surface. In contrast, the inner layer on X65 steel comprised solely of FeCO3 and was able to reduce the general corrosion rate the most effectively compare to the Cr steels, whilst also preventing the propagation of pits beyond 96 h of exposure.
Another key observation is the FeCO3 crystal size on the surfaces of the different steels. Increasing Cr content within the steel resulted in larger (and fewer) FeCO3 crystals forming within the outer layer (shown in Fig. 4). The porosity of the outer layer visibly increases with Cr content in the steel, with an increase in crystal size and reduction in compactness. This correlates with the increase in general corrosion rate with Cr content, suggesting that the outer film may be responsible for providing some protection to the steel surface (although the majority of protection appears to be afforded by the inner layer in the case of the low Cr steels).
The larger, more discrete crystals at higher Cr content indicate a reduction in nucleation and enhanced growth with increasing Cr content in the steel. This can be explained by reviewing how the nucleation and growth characteristics change with the saturation ratio (SR) of FeCO3, which is essentially a measure of the extent to which the solubility limit is exceeded [28]:
SR=$\frac{[Fe^{2+}][CO_3^{2-}]}{K_{SP}}$ (6)
where SR is the saturation ratio of FeCO3, [Fe2+] and $[CO_3^{2-}]$ are the concentrations of iron and carbonate ions in mol/L and Ksp is the solubility product for FeCO3 in mol2/L2.
The nucleation rate of FeCO3 varies exponentially with SR, while growth varies linearly. Consequently, high SR values result in high nucleation and less growth, while lower SR results in less nucleation and greater growth [24]. This suggests that the SR of the solution at the location of FeCO3 precipitation on the outer surface reduces as the Cr content in the steel increases. The growth of the outer film is also delayed as the Cr content in the steel increases. Both these observations correlate with the slower release of Fe2+ ions from the steel surface with increasing Cr content during the earlier stages of corrosion. As the Fe2+ flux from the surface reduces with increasing steel Cr content (due to the suppression of corrosion rate from the Cr(OH)3 film), the solution will take longer to become saturated with respect to FeCO3 and will not reach as high values of SR, resulting in the development of larger, more discrete crystals within the outer layer.
In this work, the corrosion behaviour of X65, 1Cr, 3Cr and 5Cr steel exposed to CO2-saturated 1 wt.% NaCl brine at 60 °C and 100 bar for different immersions time was studied. The findings from this work are as follows:
(1) In the early stages of corrosion, in the absence of significant corrosion product formation, the general corrosion rate of X65 exhibited the highest corrosion rate (16.7 mm/year). Corrosion resistance of the four materials increased with increasing Cr content (corrosion resistance: X65 < 1Cr<3Cr<5Cr), the presence of low Cr content (1 %-5 %) produced a chromium hydroxide (Cr(OH)3) film in the first 6 h of exposure to the test solution. Increasing Cr content within the steel proved beneficial toward mitigating material dissolution in the absence of formation of protective corrosion products, suppressing corrosion rate by a factor of 2.5 for 5Cr steel over the first 6 h.
(2) Longer durations of exposure for all materials resulted in the protective corrosion products consisting of a duplex structure (an inner amorphous/nano-crystalline layer and an outer crystalline layer). The outer layer on all samples comprised of solely FeCO3. The inner layer for X65 consisted of FeCO3 only, while for Cr steel, contained significant levels of Cr enrichment as a result of Cr(OH)3 presence, as well as trace amounts of FeCO3.
(3) After 192 h of exposure, the thickness of the corrosion products was very similar (60 μm), but offered different levels of protection against general and localised corrosion. The Cr enrichment of the inner film appeared to facilitate continued pit propagation, with a reduction in general corrosion protection being observed with increasing Cr content in the steel and in the film.
(4)The corrosion product layer formed on X65 steel after 192 h was able to significantly suppress general corrosion (corrosion resistance: X65 > 1Cr>3C>5Cr). The extent of localised corrosion decreased significantly for X65 as it became covered by dense and compact FeCO3 compared to the Cr-containing steels, and increasing Cr content failed to improve localised corrosion resistance.
(5)The presence of Cr in the steels influenced the nucleation and growth characteristics of FeCO3 crystals on the outer layer which was predominantly due to the rate of release of Fe2+ ions into the solution in the earlier stages of corrosion, resulting in different saturation ratios at the location of FeCO3 precipitation.
(6)The work also highlighted that individual mass loss tests at specific time intervals can result in the misinterpretation of material corrosion resistance ranking when protective corrosion products develop on steel surfaces. Multiple experiments over the film formation period are required to fully characterise material behaviour in the presence of such films to produce reliable conclusions regarding the protection afforded by corrosion products. The results indicate that the low Cr steels are no more suitable for this situation compared to X65 carbon steel under the tests conditions considered here.

 WeChat
/
| 〈 |
|
〉 |