Search for articles:
Qiang Zhu
Corresponding authors:
Received: 2019-07-4
Revised: 2019-08-18
Accepted: 2019-09-10
Online: 2020-03-01
Copyright: 2020 Editorial board of Journal of Materials Science & Technology Copyright reserved, Editorial board of Journal of Materials Science & Technology
More
Abstract
Nickel-based superalloys have become the key materials of micro-parts depending on excellent mechanical properties at high temperatures. The plastic deformation behavior is difficult to predict due to the occurrence of size effect on the mesoscopic scale. In this paper, the effect of specimen diameter to grain size ratio (D/d) on the flow stress and inhomogeneous plastic deformation behavior in compression of nickel-based superalloy cylindrical specimens was investigated on the mesoscopic scale. The results showed that when D/d is less than 9.7, the flow stress increases with the grain size. Aiming at this phenomenon, a flow stress size effect model considering compressive strain partitioning was established. The calculated flow stress values agree well with the experimental values, thus revealing the effect of D/d on the flow stress in compression of nickel-base superalloy on the mesoscopic scale. The inhomogeneous plastic deformation during compression deformation increases with the grain size. The end surface profiles evolve from a regular circular shape to an irregular shape with the grain size. The surface folding phenomenon occurs only in partially compressed specimen with a few grains across the diameter. Crystal plasticity finite-element (CPFE) simulation of compression deformation on the mesoscopic scale real-time displayed the evolution of microstructure. The study of this paper has important guiding significance for understanding the influence of D/d on the compression deformation behavior of nickel-based superalloy on the mesoscopic scale.
Keywords:
With the irresistible trend of miniaturization in many industrial clusters, mesoscopic forming technique has been introduced in the field of microelectronics and micro weapons in recent years [1,2]. Numerous pivotal micro-parts used in aerospace and weaponry fields must satisfy the harsh environment requirements such as high pressure, high temperature, and special medium corrosion. Nickel-based superalloys have become the key materials in aerospace turbines and other applications owing to high temperature strength, decent oxidation and corrosion resistance, outstanding fatigue property and fracture toughness [[3], [4], [5], [6], [7], [8]]. As the feature size of the micro-products is reduced to the sub-millimeter level in the two-dimensional direction, the theory in the macroscopic forming process cannot be fully applied to the mesoscopic forming field, and a size effect phenomenon occurs. Therefore, studying the size effect in mesoscopic plastic forming is of great significance for the practical application of materials.
Compared with macroscopic plastic deformation, the plastic deformation behavior of metals on the mesoscopic scale depends not only on the grain size, but also on the specimen geometry size. Cheng et al. [9] found that the flow stress decreases with the decrease of the specimen size. The distribution of crystal orientation has a significant effect on the flow stress. Wang et al. [10] proposed that the flow stress decreases with the increase of grain size when there are more than 6.2 grains across the specimen diameter in the compression of pure nickel on the mesoscopic scale. Mao et al. [11] conducted a barrel compression test of a medium-sized cylindrical pure copper specimen. The plastic deformation size effect caused by the interaction of microstructure and surface constraints occurs when there are 8 grains across the specimen diameter. Gu et al. [12] found a “smaller is weaker” phenomenon at a D/d of 5 through studying the effect of specimen size on the deformation of platinum nanopillars of fixed grain size. Yang et al. [13] found that not only the grain size but also the wire diameter to grain size ratio influence the tensile yield stresses of polycrystalline copper wires. Chinh et al. [14] investigated the microstructural and mechanical properties of an ultrafine‐grained Al-Zn alloy and found the flow stress was much lower than that of the conventional coarse‐grained (CG) Al-Zn alloy. Seo et al. [15] found that size dependent softening effects were only observed in nickel pillars with average grain sizes in the range of 9.4-13.2 nm. Burek et al. [16] found that a clear transition in the mechanism governing the plastic deformation of bismuth nanopillars is observed as the nanopillar size becomes comparable with the average grain size of 280 nm.
Researchers are working to explain the size effect of the plastic deformation behavior on the mesoscopic scale and have proposed a variety of theoretical models [[17], [18], [19], [20]]. Kim et al. [17] established a model by introducing two parameters into the Hall-Petch equation, revealing the effect of specimen size and grain size ratio on the size effect of mesoscale flow stress. Geiger et al. [18] proposed a surface layer model to explain the size effect of the reduction of flow stress on the mesoscopic scale. Chan et al. [19] studied the effect of internal grain boundary ratio on plastic deformation behavior based on grain boundary strengthening effect. Peng et al. [20] established a uniform size-dependent constitutive model by introducing a scale factor and predicted the material deformation behavior from macroscale to mesoscale. The results based on the constitutive model showed that considering the size effect or not, there is a significant difference between the impact force and the Mises stress distribution. Up to now, mainly the size effect of pure metal or single-phase metal in compression has been studied on the mesoscopic scale. However, there are few reports on the size effect of multi-phase alloy. Especially, the size effect of nickel-based superalloys in compression on the mesoscopic scale has not yet reported. The trend toward miniaturization of aerospace products makes the study of mesoscopic formation of nickel-based superalloys significant.
In this study, the compression tests of a nickel-based superalloy on the mesoscopic scale were conducted to investigate the effect of D/d on flow stress and inhomogeneous deformation behavior. A size effect constitutive model is constructed considering the compressive strain partitioning, revealing the influence of D/d on the flow stress. The inhomogeneous deformation behavior was investigated by the surface morphology evolution of the deformed specimens. CPFE simulation of compression deformation of a nickel-based superalloy on the mesoscopic scale is used to real-time characterize the evolution of microstructure.
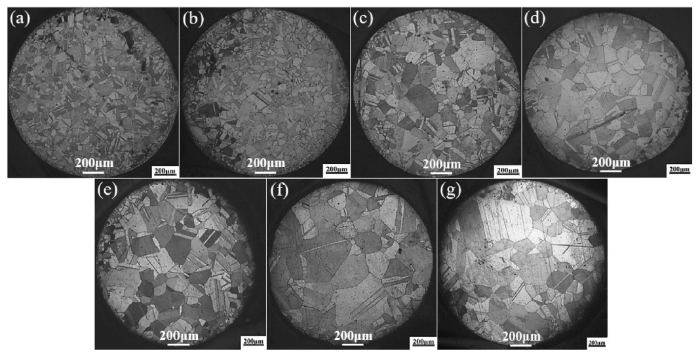
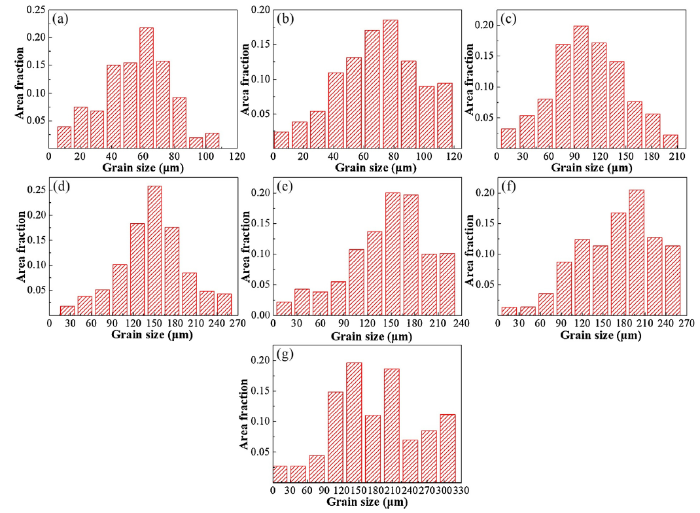
The nickel-based superalloy wire with diameter of 1.56 mm selected in this paper is obtained by cold drawing process. The chemical composition (mass fraction, %) of the nickel-based superalloy is as follows: Ni 52.80, Cr 18.73, Nb 5.24, Mo 3.02, Al 0.52, Ti 0.95, C 0.026, Co 0.03. The cylindrical specimens with a height-to-diameter ratio of 1.5 used for compression tests were obtained using wire cutting. The vacuum sealing heat treatments were taken to prevent specimen oxidation. In order to obtain various grain sizes, the annealing scheme is as follows: 1323 K/1 h, 1373 K/1 h, 1423 K/1 h, 1473 K/1 h, 1523 K/1 h, 1523 K/2 h, and 1523 K/4 h, followed by water quenching (WQ). The purpose of WQ treatment is to preserve the high temperature microstructure of the alloy. It is known to all that the δ phases which distributed on the grain boundaries or twins affects the growth of the grains. The δ phase is completely dissolved in the annealing temperatures from 1323 K-1523 K because the complete dissolution temperature of the δ phase is 1313 K [21]. The specimens were conventionally ground and mechanical polished followed by chemical etched with a mixed solution composited by 100 ml C2H5OH+100 ml HCl+5 g CuCl2. The microstructures of the alloy after various annealing treatments are shown in Fig. 1. As the annealing temperature increases, the grain size gradually becomes larger. Additionally, some annealing twins occur during the heat treatment. Three metallographic figures at each annealing temperature were selected for grain size statistics. In order to calculate the grain size, twins were not included in statistics and edge grains were included in statistics. Fig. 2 shows grain size distribution histograms of specimens under various annealing parameters. The statistical results of grain size and specimen diameter to grain size ratio (D/d) are shown in Table 1.
Fig. 1. Microstructures of specimens under various annealing parameters. (a) 1323 K, 1 h; (b) 1373 K, 1 h; (c) 1423 K, 1 h; (d) 1473 K, 1 h; (e) 1523 K, 1 h; (f) 1523 K, 2 h; (g) 1523 K, 4 h.
Fig. 2. Grain size distribution histograms of specimens under various annealing parameters. (a) 1323 K, 1 h; (b) 1373 K, 1 h; (c) 1423 K, 1 h; (d) 1473 K, 1 h; (e) 1523 K, 1 h; (f) 1523 K, 2 h; (g) 1523 K, 4 h.
Table 1 Statistical results of grain size and specimen diameter to grain size ratio.
| Solution temperature (K) | Solution time (h) | Average grain size, d (μm) | Standard deviation (μm) | Specimen diameter, D (mm) | D/d |
|---|---|---|---|---|---|
| 1323 | 1 | 55.8 | 15.6 | 1.56 | 27.9 |
| 1373 | 1 | 76.2 | 13.8 | 20.5 | |
| 1423 | 1 | 98.7 | 25.6 | 15.8 | |
| 1473 | 1 | 143.3 | 37.0 | 10.9 | |
| 1523 | 1 | 161.4 | 44.8 | 9.7 | |
| 1523 | 2 | 181.5 | 52.2 | 8.6 | |
| 1523 | 4 | 208.4 | 56.8 | 7.4 |
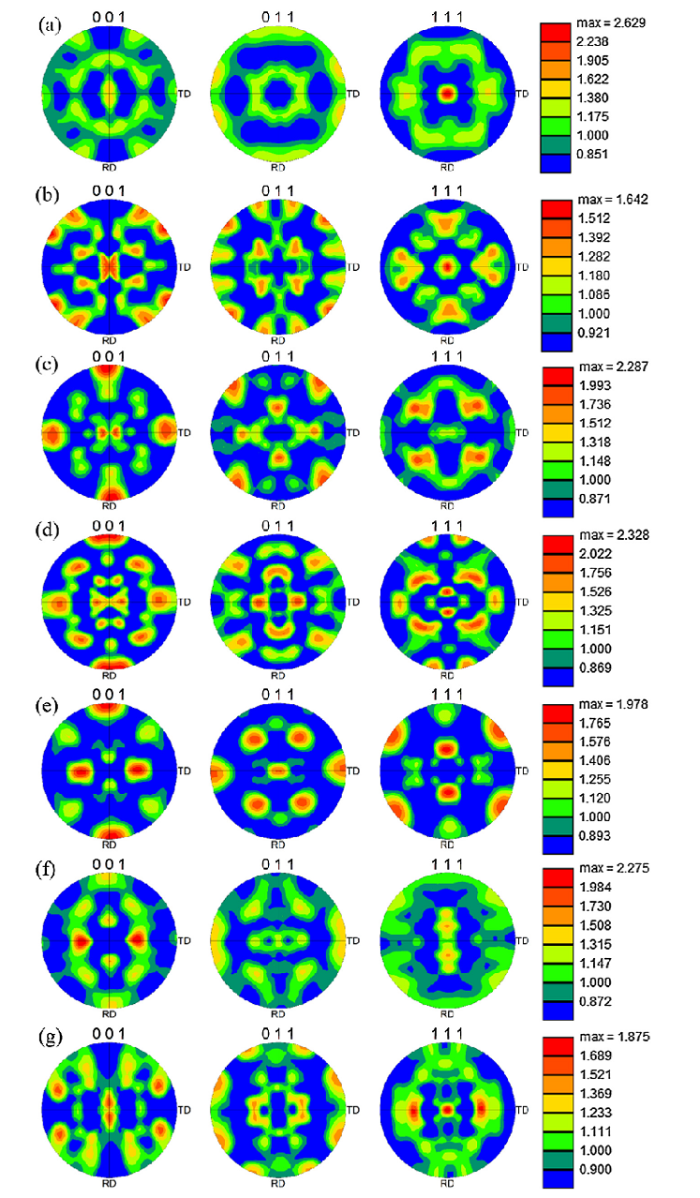
The heat treated specimens were firstly mechanical ground and polished. Then the vibration polishing (VibroMet 2 VIBRATORY POLISHER) was used to remove the stress of the surface layer caused by mechanical grinding and polishing. MasterMet 2 non-crystalline silica gel polishing solution and 60% of the vibration polishing amplitude were adopted. The textures of the heat treated specimens were characterized by EBSD (Zeiss, Merlin Compact). Normalized main pole figures were reconstructed by the orientation distribution function (ODF) and expressed in multiples of a random distribution (m.r.d. unit) [10]. The {001}, {011} and {111} pole figures (PFs) of the specimens with seven different grain sizes are given in Fig. 3. It can be observed that the crystallographic textures look similar and the values of multiples of a random distribution are small for all specimens.
Fig. 3. Pole figures for specimens under various annealing parameters. (a) 1323 K, 1 h; (b) 1373 K, 1 h; (c) 1423 K, 1 h; (d) 1473 K, 1 h; (e) 1523 K, 1 h; (f) 1523 K, 2 h; (g) 1523 K, 4 h.
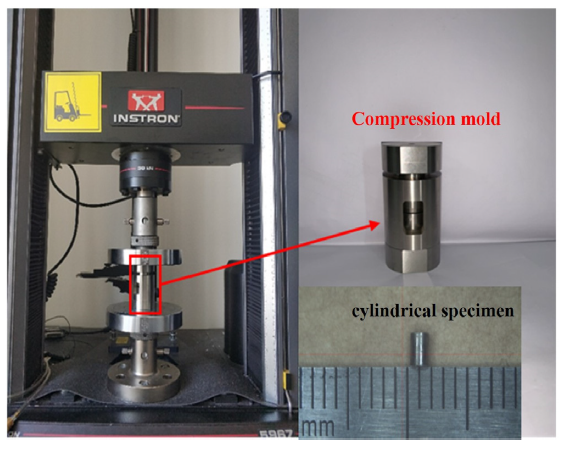
The room temperature uniaxial compression tests on the mesoscopic scale were performed on an Instron-5967 universal testing machine with a load-sensor of 30 kN, as shown in Fig. 4. To reduce the effect of friction on the plastic deformation behavior, the surface of the tool in contact with the specimen was polished to a mirror surface, and the contact surfaces were sufficiently lubricated with castor oil in all compression tests [22]. The strain rate of 1 × 10⁻³ s-1 was adopted. The specimens were compressed to an initial height of 50% and each set of tests was repeated 5 times to reduce experimental error.
Fig. 4. Schematic diagram of uniaxial compression tests on the mesoscopic scale.
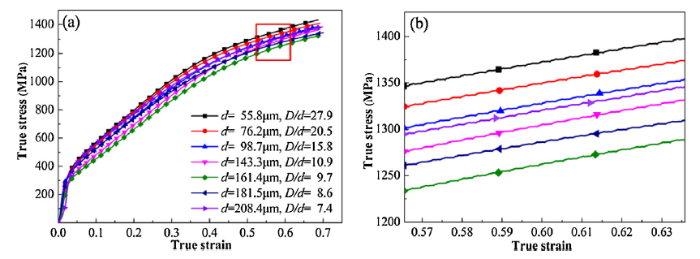
Fig. 5 shows the true stress-true strain curves for various grain sizes. It can be seen that the flow stress gradually increases with the strain due to strain hardening. A partial enlarged view of the red frame selection in Fig. 5(a) is shown in Fig. 5(b). It can be seen from Fig. 5(b) that when the grain size is less than 161.4 μm, the flow stress gradually decreases with the grain size, which is in accordance with the classical Hell-Petch equation [23,24]. However, the flow stress increases with the grain size when the grain size is larger than 161.4 μm. This phenomenon does not conform to the classical Hall-Petch equation and cannot be explained by the macroscopic plastic deformation theory, that is, a grain size effect occurs. During the uniaxial compression, the number of grains in the deformed region decreases with the grain size, where the effect of individual grains on plastic deformation is amplified [25]. Moreover, the deformation of the grains on the mesoscopic scale cannot be performed easily in a plurality of slipping systems like that on the macroscopic scale. Thus, the deformation coordination between the grains becomes poor [26]. Furthermore, the friction of the grains in the area contacting the mold is much larger than that of grains in the inside specimen and the free surface of the specimen. The proportion of the grain in the area contacting the mold increases with the grain size, which increases the plastic deformation resistance of the specimen. Therefore, the specimen diameter to grain size ratio (D/d) will be introduced in this study, and the factors affecting the increase of flow stress will continue to be discussed in the following.
Fig. 5. (a) True stress-true strain curves of specimens with various grain sizes; (b) partial enlarged view of the frame selection in Fig. (a).
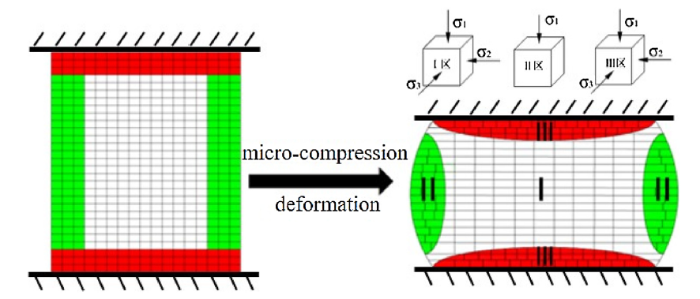
According to the deformation degree after compression, the specimen can be divided into three zones: the large deformation zone (Zone I), the small deformation zone (Zone II), and the difficult deformation zone (Zone III) [27]. The schematic diagram is shown in Fig. 6.
Fig. 6. Schematic diagram of strain partitioning after compression deformation.
Zone I: the compressive stress in the radial direction is low due to low influence of the contact friction. The axial force causes the grains to undergo a large compression deformation, and the grains flow in the radial direction. Furthermore, the flow resistance of surrounding grains increases due to the wedge action of the Zone III.
Zone II: the outer side of specimen is a free surface. The grains in Zone II deform more freely due to much less friction. At the same time, the deformation of the region is small due to the inflow of grains in the large deformation zone.
Zone III: the surface layer in contact with the mold is subjected to a large frictional resistance, leading to the grains in this region being in a three-dimensional compressive stress state. When the distributions of grains are close to the surface of the specimen, the three-direction compressive strength increases. Thus, the deformation of grains is small in this zone.
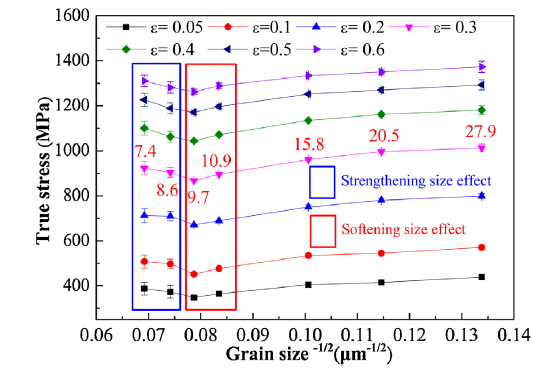
Fig. 7 shows the relationship of flow stress with the reciprocal of the square root of the grain size under different true strains. The standard deviation for each data point is also included in Fig. 7. It can be observed that the scatter of the flow stress increased with the increase of grain size and for the strain larger than 20%. Chan et al. [28] proposed that the scatter of flow stress increased with the grain size in compression tests of pure copper cylinders on the mesoscopic scale. Wang et al. [29] proposed a model considering orientation distributions of the surface grains to reveal the flow stress scatter in compression on the mesoscopic scale. When D/d is less than 9.7, the flow stress appears to deviate significantly from the classical Hall-Petch relationship, that is, the flow stress increases with the increase of grain size. The result is similar to that in compression tests of pure nickel cylinders [30]. In this study, the alloy undergoes two deformation mechanisms for specimens with various grain sizes. When D/d is greater than 9.7, the grains in the small deformation zone of the free surface play a dominant role, and the Hall-Petch relationship is satisfied between the flow stress and the grain size. At this time, the variation of the constant in Hall-Petch with strain can be obtained and only the effect of grain size on the flow stress exists. When D/d is less than 9.7, the grains in the difficult deformation zone in contact with the mold play a leading role, and the flow stress appears to deviate from the Hall-Petch relationship. At this time, the effects of grain size and specimen size simultaneously exist.
Fig. 7. Relationship of flow stress with the reciprocal of the square root of the grain size under various true strains.
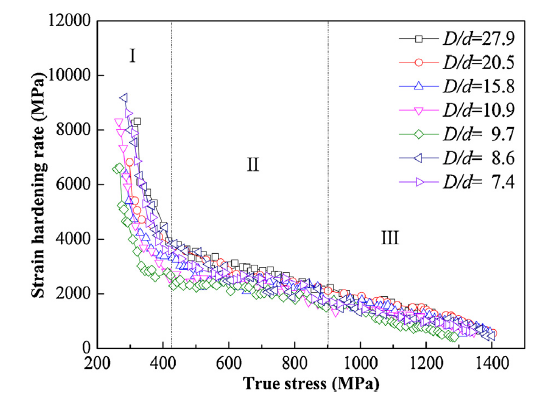
Fig. 8 displays the strain hardening curve of specimens with various D/d values. The strain hardening rate in the compression process is divided into three stages. The first hardening stage (uniform deformation mechanism) occurs in the lower plastic strain, and the work hardening rate decreases rapidly under the small flow stress increment. In the second hardening stage (local deformation mechanism), a large number of dislocations are generated due to multiple slipping systems with the deformation. The accumulation and entanglement of the dislocations lead to an increase in the plastic deformation resistance, resulting in a decrease in the strain hardening rate. In the third hardening stage (steady-state deformation mechanism), the dislocation density is gradually saturated, the distribution of the strain field tends to be stable, and the work hardening rate is gradually reduced.
Fig. 8. Strain hardening curve of specimens with various D/d values during compression.
When the value of D/d is less than 9.7, the strain hardening rate tends to increase rather than decrease. The size and orientation of grains are the main factors affecting the strain hardening rate of polycrystals. In Taylor polycrystalline materials, Taylor factor is the main influencing factor, and Taylor factor depends on the deformation resistance of grains. During the compression deformation, the grains in Zone III cannot be freely deformed due to large friction, resulting in the difficult deformation. The grain deformation in Zone II is relatively easy due to less restraint.
In mesoscopic scale plastic deformation, the specific surface area of the specimen increases with the decreasing specimen size or the increasing grain size, resulting in the increasing specific gravity of the material in Zone III caused by the constraint of the mold. Furthermore, as the specimen size decreases or the grain size increases, the specific gravity of grain with softening effect in Zone II increases. The combination of these two effects leads to the occurrence of flow stress size effect in the uniaxial compression deformation on the mesoscopic scale. The D/d plays a key role in compression deformation on the mesoscopic scale. At the same time, the mold constraint plays a decisive role in the plastic deformation behavior. The stress state of the material during uniaxial compression plastic deformation is different from that of uniaxial tensile plastic deformation on the mesoscopic scale, which is also affected by the mold constraint.
For traditional polycrystalline materials, the relationship between flow stress and grain size can be expressed by Hall-Petch relationship [23,24], which can be expressed as follows:
$σ(ε,d)= σ_{0}(ε) + \frac{K_{hp(ε)}}{\sqrt{d}}$ (1)
where σ(ε,d)is flow stress of materials; σ0(ε) is friction stress of a single crystal; Khp(ε) is the locally intensified stress used to propagate general yield across the polycrystal boundaries; d is the average grain size. σ0(ε) and Khp(ε) are material constants at a given strain ε.
For a given strain ε, the traditional Hall-Petch relationship depends only on the grain size of the material, and does not take into account the specimen size in macroscale deformation. However, as the grain size increases or the specimen size decreases, the number of grains in the deformed region decreases. Moreover, the grain size gradually approaches the specimen size, and the plastic deformation behavior is different from the macroscopic deformation. Therefore, the Hall-Petch relationship cannot effectively describe the change of flow stress on the mesoscopic scale.
Armstrong [31] showed that the relationship between σ0(ε) and the critical shear stress τc(ε), which can be expressed as follows:
σ0(ε)=Mτc(ε) (2)
where M represents Taylor factor.
Taylor factor is related to grain orientation and its neighboring environment. Grain boundary strengthening is one of the main material strengthening mechanisms, and the change of grain boundary density leads to the change of mechanical properties of the specimen on the mesoscopic scale. Therefore, it is necessary to consider the effect of grain boundary density on the overall mechanical properties of microscopic specimens. Therefore, the grain boundary factor θ was introduced into the Hall-Petch relationship:
$σ(ε)= Mτ_c(ε)+ θ\frac{K_{hp}(ε)}{\sqrt{d}}$(3)
The first term on the right side of Eq. (3) is related to the mechanical property and the deformation coordination of the single crystal. The second term on the right side of Eq. (3) is mainly related to the inhibition effect of the grain boundary on the deformation. Since the restrictions of grains in Zone I, Zone II, and Zone III are much different, the deformation resistance caused by them is also different. Considering the influence of grain distribution and grain boundary, the flow stress in Zone I, Zone II, and Zone III can be expressed as follows:
$σ_1(ε)=M_1τ_c(ε) +θ_{1}\frac{ K_{hp}(ε)}{\sqrt{d}}$ (4)
$σ_2(ε)=M_2τ_c(ε) +θ_{2}\frac{ K_{hp}(ε)}{\sqrt{d}}$ (5)
$σ_3(ε)=M_3τ_c(ε) +θ_{3}\frac{ K_{hp}(ε)}{\sqrt{d}}$ (6)
where σ1(ε), σ2(ε) and σ3(ε) are the flow stress of Zone I, Zone II and Zone III, respectively. M1, M2 and M3 are the Taylor factor of Zone I, Zone II and Zone III, respectively. θ1, θ2 and θ3 are the grain boundary factors of Zone I, Zone II and Zone III, respectively.
Combined with the constitutive composite model of the material, the relationship between the flow stress of polycrystalline materials and the flow stress of a single crystal in the plastic deformation process can be expressed by Eq. (7) [11]:
$σ(ε)=\sum^{n}_{m=1}σ_m(ε)$ (7)
Therefore, the flow stress size effect model considering the compressive strain partitioning is shown as follows:
σ(ε)=(f1M1+f2M2+f3M3)τc(ε)+θ$\frac{K_{hp}(ε)}{\sqrt{d}}$ (8)
where θ=f1θ1+f2θ2+f3θ3, f1, f2, and f3 are the ratios of the area of Zone I, Zone II and Zone III, respectively.
The specific method of partitioning is determined by distinguishing the grain deformation conditions of different regions, as shown in Fig. 9. The shapes of grains in Zone I appear flat due to low compressive stress in the radial direction and the wedge action of the grains in Zone III. The deformation degree of the grains in zone II is less than that of in Zone I. The change of the grains in Zone III is small due to the occurrence of three direction compressive stress, which is basically the same as the original grain shape.
Fig. 9. Schematic diagram of the compression deformation partitioning.
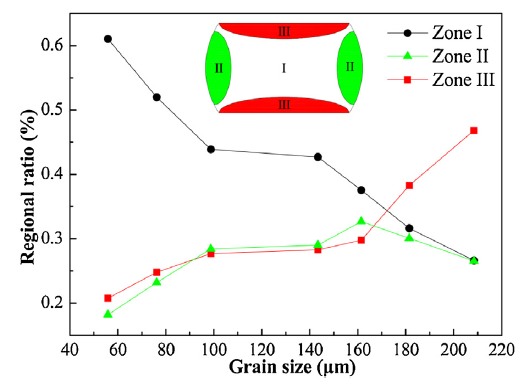
The parameters in the model require to be determined. The fractions of grains in Zone I, Zone II and Zone III are determined based on the ratio of their area to the total area in the longitudinal section. The ratio of each zone area is shown in Fig. 10 by observing the microstructure of the specimen after compression. It can be found that the fraction of Zone II does not rise but fall when the grain size reaches 161.4 μm. This is because the grain size is relatively large relative to the specimen size, and the number of grains contained in the interior of specimen is relatively small. Therefore, the effect of each grain is enhanced during the plastic deformation on the mesoscopic scale, leading to the deteriorated coordination between the grains, that is, nonuniform deformation is intensified.
Fig. 10. Variation of the regional ratio of each compression deformation zone.
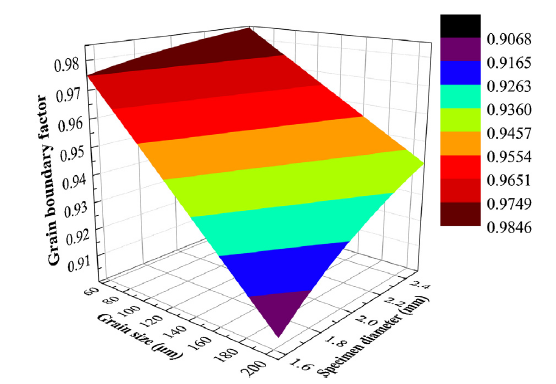
The grain boundary factor refers to the relative length of the grain boundaries in a unit area. For the plastic deformation on the macroscopic scale, the grain boundary factor of the polycrystalline material is equal to1. Therefore, the relationship between grain boundary factor, grain size and specimen diameter is as follows:
$θ=1-\frac{d}{2D}η_{1}-\frac{d}{2H}η_2$ (9)
where D is the original specimen diameter size; H is the original specimen height; η1 and η2 represent the radial and axial change rates of grain boundary after compression deformation, respectively.
The variations of the grain boundary factor with average grain size and specimen diameter are shown in Fig. 11. It can be observed that the grain boundary factor decreases with the increasing grain size or decreasing specimen dimension.
Fig. 11. Variations of grain boundary size factors with average grain size and specimen diameter.
The Taylor factor represents the deformation coordination ability of grains during plastic deformation. The deformation of the grain with a small Taylor factor is easy. For face centered cubic (FCC) alloys, the average Taylor factor is 3.06. For single crystals, the Taylor factor is greater than 2 [32]. The deformation behavior of grains in Zone I is similar to that of macroscopic polycrystals. Therefore, the Taylor factor of the grains in Zone I can be considered to be equal to 3.06. The Taylor factor of grain in Zone II with free surface is smaller than that of the grains in Zone I because there are fewer constraints imposed on them from their adjacent grains. Therefore, the average value of the Taylor factor with 2.50 of the single crystal is used to represent the Taylor factor of the grains in Zone II. The Taylor factor of the grains in Zone III is designated as 3.925 [33].
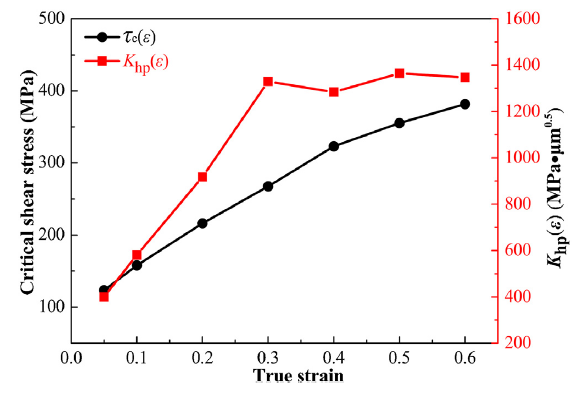
The τc(ε) and Khp(ε) in Eq. (8) are related to experimental materials, which can be determined by data fitting combining Eq. (8) with the determined parameters and the experimental data, as shown in Fig. 12.
Fig. 12. Values of critical shear stress τc (ε) and Khp (ε) versus true strain.
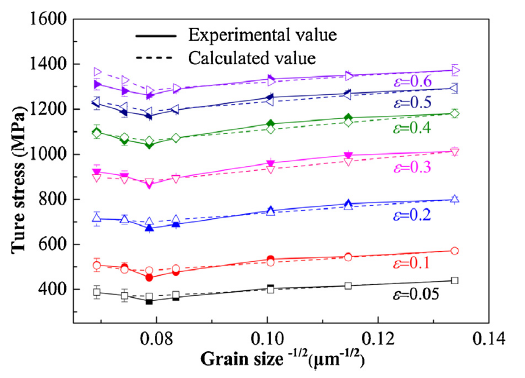
Through the above analysis, it can be known that there are many parameters which affect the plastic deformation. Table 2 shows all the parameters and their effects on plastic deformation. Fig. 13 shows the comparison between the calculated values and the experimental values of the flow stress for the specimens with different grain sizes. It can be found that the calculated values of the flow stress agree well with the experimental values, indicating that the constructed mesoscale material constitutive of the flow stress size effect is feasible.
Table 2 Effects of parameters on plastic deformation.
| Parameter | Effect on plastic deformation |
|---|---|
| σ0(ε) | Lattice frictional resistance generated when moving a single dislocation |
| Khp(ε) | Propagating general yield across the polycrystal boundaries |
| d | Grain boundary strengthening |
| M | Average effect of grain orientation |
| M1 | Average effect of grain orientation for the grains in Zone I |
| M2 | Average effect of grain orientation for the grains in Zone II |
| M3 | Average effect of grain orientation for the grains in Zone III |
| τc(ε) | Ability to resist plastic deformation |
| θ | Effect of grain boundary density on the overall mechanical property |
| θ1 | Effect of grain boundary density in Zone I on the mechanical property |
| θ2 | Effect of grain boundary density in Zone II on the mechanical property |
| θ3 | Effect of grain boundary density in Zone III on the mechanical property |
| η1 | Effect of radial change rate of grain boundary on grain boundary factor |
| η2 | Effect of axial change rate of grain boundary on grain boundary factor |
Fig. 13. Comparison between the calculated values and the experimental values of the flow stress for the specimens with various grain sizes.
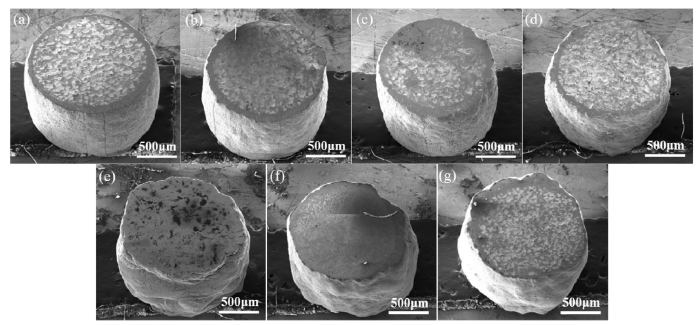
Fig. 14 shows the end surface morphologies of specimens with different grain sizes after uniaxial compression on the mesoscopic scale. It can be clearly observed that the end surface profiles evolve from a regular circular shape to an irregular shape with the grain size. This indicates that the degree of inhomogeneous deformation increases with the grain size. The plastic deformation behavior is related to the distribution, size, orientation, stress state and adjacent grains of each grain [34]. The number of grains in the diameter direction decreases with the grain size. Therefore, the deformation behavior of each grain plays a more important role in the overall deformation behavior.
Fig. 14. End surface topographies of specimens with various grain sizes after uniaxial compression. (a) d = 55.87 μm; (b) d = 76.2 μm; (c) d = 98.78 μm; (d) d = 143.38 μm; (e) d = 161.44 μm; (f) d = 181.51 μm; (g) d = 208.4 μm.
Fig. 15 shows the side surface morphologies of specimens with different grain sizes after uniaxial compression on the mesoscopic scale. The side surface morphology of the specimen with small grain size is homogeneous, while the "valley" and "peak" on the side surface of the specimen with large grain size are extremely obvious and inhomogeneously distributed.
Fig. 15. Side surface topographies of specimens with various grain sizes after uniaxial compression. (a) d = 55.87 μm; (b) d = 76.2 μm; (c) d = 98.78 μm; (d) d = 143.38 μm; (e) d = 161.44 μm; (f) d = 181.51 μm; (g) d = 208.4 μm.
The evolution of surface morphology is related to plastic deformation. The plastic deformation is guided by the dislocations in the slip band, and the slip band inside each grain depends on its crystallographic orientation [35]. The plastic deformation behavior of each grain is anisotropic and the difference of anisotropy between the adjacent grains results in the free surface roughening phenomenon [25]. When the specimen size to grain size ratio is small, the distribution of grains becomes inhomogeneous. Each grain plays an important role in the plastic deformation behavior. The grain boundary sliding can be easily carried out during plastic deformation due to small constraints of the surface grains. Therefore, the strain incompatibility between the grains further results in inhomogeneous plastic deformation [26]. The anisotropy of surface grains and internal grains leads to the difference in surface displacement on the mesoscopic scale. The difference in these surface displacements appears as surface roughening in the specimen morphology [36]. "Valley" and "peak" were found on the surface of the specimen, which was caused by the inhomogeneous orientation distribution and the anisotropy of the grains. As D/d decreases, inhomogeneous deformation becomes more severe [37]. An increase in the grain size results in a decrease in the number of grains in the diameter direction. Additionally, the contribution of individual grains with anisotropy to overall plastic deformation increases [38]. The plastic flow of the grains with weak deformation resistance is large and appears as a peak. The plastic flow of the grains with strong deformation resistance is small and appears as a valley. The small number of grains in the diameter direction causes the large inhomogeneity of the material structure, and the inhomogeneous deformation during the deformation causes a more irregular side surface profile.
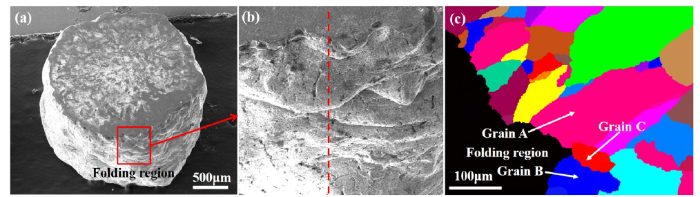
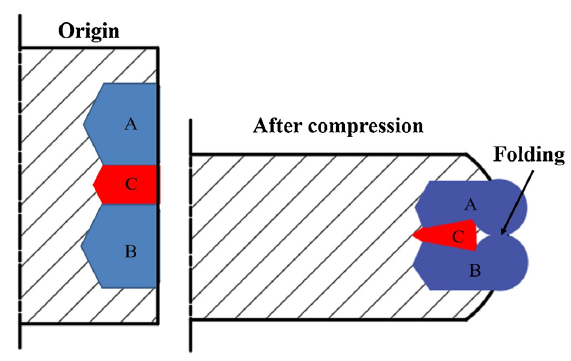
Furthermore, the surface folding phenomenon occurs in partial compressed specimens with a few grains across the diameter. Fig. 16(a) and (b) show the surface folding phenomenon after compression deformation for the specimens with the grain size of 161.44 μm. When D/d decreases, the microstructure inhomogeneity in the deformation zone increases. The occurrence of folding phenomenon may be related to the inhomogeneous distribution of grains [39]. Margolin and Thompson [40] showed that the slip could occur more freely away from the grain boundary, which leads to a height difference between the grain boundary zone and the position far away from the grain boundary. To reveal the formation mechanism of the surface folding phenomenon, the compressed specimen with the grain size of 161.44 μm was cut longitudinally along the surface folding. The longitudinal section with the surface folding was firstly mechanical ground and polished. Then the vibration polishing method was used to remove the stress of the surface layer of the longitudinal section. The microstructure of the longitudinal section with the surface folding was characterized by EBSD, as shown in Fig. 16(c). It can be observed that two larger grains and several smaller grains exist in the surface folding region. Two larger grains marked as grain A and grain B are at the peak position and a smaller grain marked as grain C is at the valley position. To reveal the mechanism of surface folding in compression on the mesoscopic scale, a model is established (Fig. 17). The folding phenomenon is caused due to the various flow velocity of the grains with different grain sizes. The deformation resistance of grains is related with their orientations. The deformation resistance of the grain A and grain B with soft orientations is small. Therefore, grain A and grain B flow towards the free surface easily during the plastic deformation. However, the deformation resistance of the grain C with hard orientations is large. Therefore, grain C flows towards the free surface difficultly during the plastic deformation. Grain A and grain B are close to each other with the increase of strain. When the strain reaches a certain level, the two larger grains meet in front of the smaller grain C to form a surface folding phenomenon.
Fig. 16. Folding phenomenon of the specimen with the grain size of 161.44 μm after compression deformation.
Fig. 17. Model of surface folding in uniaxial compression on the mesoscopic scale.
CPFE simulation can be used to solve crystal mechanical problems under complicated internal and/or external boundary conditions [41]. The boundary conditions that are imposed by inter- and intra-grain micromechanical interactions can be tackled by CPFE [42]. CPFE simulation can be used not only on the mesoscopic scale but also on the macroscopic scale [43]. The applications on the mesoscopic scale are simulations of micromechanical experiments (eg, indentation, compression), or the prediction of mechanical size effects.
Nickel-based superalloys with face-centered cubic (FCC) structure involve the participation of multiple grains during microscopic deformation analysis. Generally, four slip planes and three slip directions occur when the alloy is deformed at room temperature. In this paper, based on the rate-dependent hardening model, the tangent coefficient method was introduced to improve the stability of the calculation. The constitutive model was numerically solved, and the user material subroutine was written in Fortran language. The material properties were given in the finite element software ABAQUS.
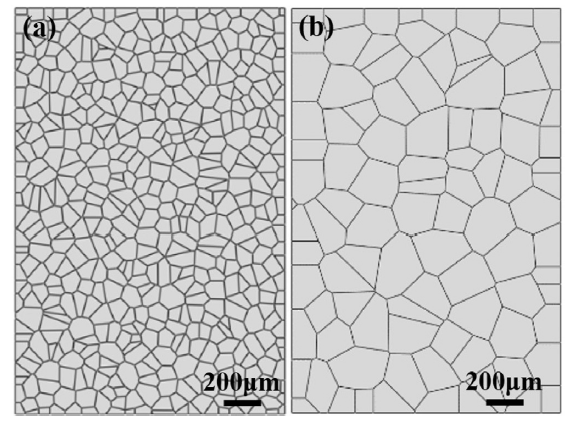
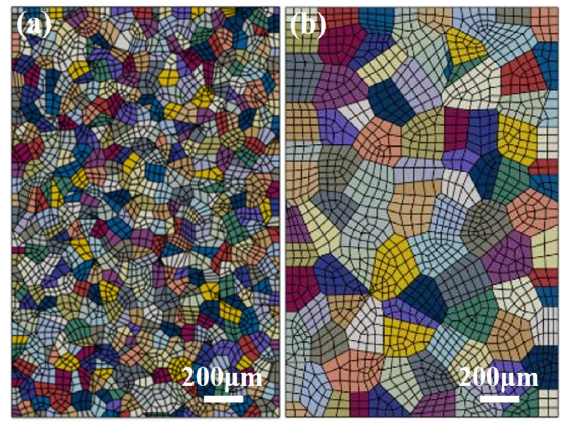
The crystallization process of grains in metal materials is the same as that of Voronoi diagrams. Therefore, Voronoi diagrams were used instead of real microstructures in this paper, as shown in Fig. 18. The two-dimensional model had a size of 1.56 mm × 2.34 mm, which corresponded to the actual specimen size.
Fig. 18. Compression finite element model of specimens with various grain sizes. (a) d = 55.8 μm; (b) d = 208.4 μm.
The material parameters required for the crystal plasticity model mainly include the anisotropy, elastic modulus and slipping system hardening parameters. The determined parameters were sequentially input into the corresponding positions through the INP file. After the model was established, the grain size was determined, and the size of the model was determined by a Boolean summation operation.
Grain orientation is closely related to the slipping system in the crystal plasticity finite element. The generation and assignment of grain orientation is a very important step in the establishment of polycrystalline finite element models. In this paper, grain orientation was generated by MATLAB software and assigned to polycrystalline materials in ABAQUS using the Python language. The grain orientation was randomly generated using MATLAB software. The orientation was imparted to the specimen in ABAQUS using the Python language, and properties were assigned to each of the grains. After the properties of grains were assigned, the mesh is divided, as shown in Fig. 19. In the crystal plastic finite element, the custom constitutive relation of the material can be realized by the subroutine UMAT. The compression displacement sets the reduction by an initial height of 50%.
Fig. 19. Finite element model of specimens with various grain sizes after assigning attributes. (a) d = 55.8 μm; (b) d = 208.4 μm.
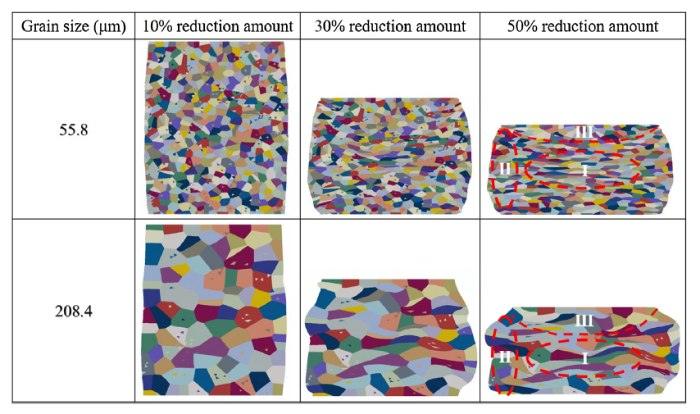
Real-time visualization of microstructure evolution can be achieved by compression finite element simulation based on crystal plasticity. Fig. 20 shows the longitudinal section microstructure of a specimen with different grain sizes, which better matches the experimental results in Fig. 9. Due to the complex and inhomogeneous deformation of the alloy during compression, the deformed grains are divided into three regions according to the strain distribution. With the increase of the reduction amount, the degree of grain deformation in different regions increases, and the inhomogeneity of strain distribution increases. Therefore, the grain division of the three regions becomes obvious. Additionally, the inhomogeneity of specimen deformation increases with the grain size. When the grain size is small, the inhomogeneous deformation of the specimen is small, and the inhomogeneity of the specimen profile is small. The large number of grains in the specimen leads to better coordination of each grain during plastic deformation. Therefore, the difficulty of each slipping system is small to start. However, when the grain size is large, the inhomogeneous deformation of the specimen is large, and the inhomogeneity of the specimen profile is large. The anisotropy of the grain is manifested by the small number of grains in the deformation zone, which makes the slipping system difficult to start. Therefore, the plastic deformation of the specimen shows obvious inhomogeneity.
Fig. 20. Longitudinal section microstructure of specimens with various grain sizes based on crystal plasticity.
During the compression on the mesoscopic scale, the grains exhibit significant inhomogeneous deformation. The anisotropy and stress state of the grains play a key role. The actuation of the slip deformation depends on the orientation of the individual grains. For FCC metals, the general slip surface is {111}, and the slip direction is <110 > . When the grain orientation is favorable for the slip motion, the deformation resistance of the grains is reduced and the flow stress is relatively reduced. When the grain orientation hinders the slip motion, the deformation resistance of the grain increases and the flow stress is relatively high. The various grain orientation makes the compression deformation on the mesoscopic scale become more inhomogeneous.
The compression experiments of a nickel-based superalloy with different grain sizes on the mesoscopic scale were carried out. The surface morphology evolution behavior of compressed specimens was observed and analyzed by SEM and EBSD. The main conclusions are as follows:
(1)The specimen diameter to grain size ratio of the specimen has a significant effect on the flow stress in the uniaxial compression test of the nickel-base superalloy. For larger D/d values, only the grain size effect determines the deformation behavior. For smaller D/d values, specimen size and grain size effects affect the deformation behavior.
(2)Considering the compressive strain partitioning, the mesoscale flow stress size effect model was established to reveal the change of the flow stress during the compression. The experimental flow stress values and the calculated flow stress values agree well.
(3)As the grain size increases, the end surface profile changes from a regular circular shape to an irregular shape. For some specimens with a small number of grains across the diameter direction, surface folding occurs. The surface folding is caused by the flow velocity difference of the grains with various orientations.
(4)Compression finite element simulation based on crystal plasticity can realize the real-time visualization of microstructure evolution. The degrees of grain deformation in Zone I, Zone II, and Zone III increase, and the inhomogeneity of strain distribution increases with the increase of the reduction amount.
The authors gratefully acknowledge the financial support of the project from the National Natural Science Foundation of China (Grant No. 51575129), Key Research and Development Program of Shandong Province (Grant No. 2016GGX102026), and the Training Program of the Major Research Plan of the National Natural Science Foundation of China (Grant No. 91860129).

 WeChat
/
| 〈 |
|
〉 |

