Search for articles:
Yueming Fan , Shimin Li
Corresponding authors:
Received: 2019-04-29
Revised: 2019-07-17
Accepted: 2019-07-22
Online: 2020-02-15
Copyright: 2020 Editorial board of Journal of Materials Science & Technology Copyright reserved, Editorial board of Journal of Materials Science & Technology
More
Abstract
The evolution of the rust layers on carbon steel and weathering steel in high humidity and heat marine atmospheric environment was investigated by wet/dry cyclic acceleration corrosion tests in this study. The corrosion process of carbon steel and weathering steel was divided into two stages and the reasons for the changes in the corrosion rates of two steels were different. The composition phase of the inner rust layer of weathering steel was mainly goethite, whereas that of carbon steel was mainly akaganeite. Rust resistance (Rr) performed better than charge transfer resistance (Rt) in evaluating the protection performance of rust layer. As the corrosion proceeded, the evolution of the cathodic process of weathering steel was not obvious, whereas that of carbon steel was irregular.
Keywords:
In recent years, weathering steel has been widely used in marine engineering structures, such as railway vehicles, bridges and berths [[1], [2], [3]]. It has good corrosion resistance in atmospheric environment because of the addition of a small amount of alloying elements (such as Mn, Ni, Cr, P and Cu) [[4], [5], [6]]. These alloying elements can be concentrated in the inner rust layer, thus making the inner rust layer compact compared with carbon steel [[7], [8], [9]]. Previous studies showed that the atmospheric corrosion progress of weathering steel was generally an electrochemical behavior between the matrix and the corrosive media, in which the dense and protective rust layer was mainly formed [10,11]. Therefore, the formation process, corrosion kinetics and electrochemical characteristics of weathering steel rust layer in marine atmospheric environment were extensively explored [[12], [13], [14]]. For instance, Zhou et al. [15] investigated the corrosion behaviors of Cr-Ni-Cu weathering steel in chlorine-containing environment through dry-wet cycling experiments and found that Cr was mainly concentrated on the inner rust layer, whereas Ni was distributed on the both inner and outer rust layers. In addition, the compact rust layer formed could be promoted by Cr enrichment and the electrochemical reaction could be slowed down, thus protecting the steel matrix. Thee et al. [16] found that when the protection performance of the rust layers and the corrosion strength were in balance, the corrosion rate could reach a maximum value in accelerated indoor corrosion experiments simulating marine atmospheric environment. The corrosion rate of weathering steel was low after the stable rust layer formed on the substrate surface. Hao et al. [17] studied the evolution of the rust layer of MnCuP weathering steel in simulated marine atmospheric environment, and pointed out that the changes in the corrosion rate at different stages were significantly correlated with the composition and electrochemical characteristics of the rust layer. The changes were ascribed to the compact rust layer formed containing a high content of α-FeOOH.
Therefore, the previous studies on the evolution process of the rust layer of weathering steel in marine atmospheric corrosion indicated that the main corrosion mechanisms in the initial stage included the anode dissolution of Fe and the cathode reduction of H+ and dissolved O2. Due to the accumulation of the rust layers, both the mass transfer behavior of the corrosion electrode system and the charge transfer behavior of the steel surface were changed, thus changing the compactness, continuity and protection performance of the rust layers on the steel surface [[18], [19], [20]]. Marine atmospheric conditions in most of recent studies were relatively mild, but the evolution, corrosion kinetics and electrochemical properties of the rust layers under high humidity, high heat and high chlorine environment were seldom reported. In fact, the alternating wetting and drying conditions had different effects on the structure, composition and protection performance of the rust layers at different corrosion stages [[21], [22], [23]]. In addition, a high concentration of Cl- significantly affected electrochemical characteristics, structure and composition of rust layers of steel [[24], [25], [26]]. It is generally believed that corrosion more easily occurs in the environment with high concentration of Cl-. For carbon steel, anion selective permeability was enhanced in high chlorine environment, thus accelerating the corrosion [[27], [28], [29]]. When the dense and continuous rust layer was formed on the surface of weathering steel, it could be hindered the penetration of Cl-. However, the changes of the structure and composition of the rust layer and its protective properties for the steel matrix under the erosion of high concentration of Cl- are still unclear. Thus, it is necessary to explore the corrosion characteristics and mechanism of weathering steel in the evolution process in the high heat, high humidity and high Cl- marine atmospheric environment for the purpose of developing new weathering steel and predicting corrosion life.
In this study, the wet/dry cyclic corrosion test (CCT) was adopted to simulate the high humidity and heat marine atmospheric environment. The corrosion evolution process and mechanism of rust layer of carbon steel and weathering steel were explored by analyzing the corrosion kinetics, electrochemical characteristics, structure and composition of the rust layer.
Table 1 shows the chemical compositions of carbon steel (CS) and weathering steel (WS). All the steel samples of CS and WS were parallelly machined into two different dimensions. The big samples (50 mm × 25 mm × 2.5 mm) were used for weight gain measurement, and the small samples (10 mm × 10 mm × 5 mm) were used for rust layers analysis and electrochemical measurements. The samples were ground by SiC emery paper up to 600 grit level. The polished samples were cleaned by ethanol, dried by a blower and stored in a desiccator prior to use. Wet/dry cyclic (CCT) was carried for the prepared samples. Each CCT was conducted as follow [30]: (a) weighing the initial weight of the samples; (b) wetting the surface of the samples with 1 wt%NaCl solution (40 μL/cm2); (c) drying the samples by a constant temperature and humidity chamber of 40 ℃ and 70% RH (simulating high humidity and heat marine atmosphere environment) for 12 h; (d) re-weighing the samples after drying; (e) rinsing the surface salt of the samples with deionized water and drying them; (f) recycling and repeating the steps from (b) to (e) in the subsequent CCT successively.
Table 1 chemical compositions of CS and WS (wt%).
| Steel | C | Si | Mn | P | S | Cu | Ni | Mo | Cr | Ti | Nb | V | Al |
|---|---|---|---|---|---|---|---|---|---|---|---|---|---|
| CS | 0.153 | 0.33 | 1.11 | 0.016 | 0.0048 | 0.004 | 0.007 | — | 0.017 | — | — | — | — |
| WS | 0.035 | 0.25 | 1.50 | <0.02 | <0.005 | 0.350 | 0.380 | 0.12 | 0.50 | <0.02 | 0.030 | <0.02 | 0.025 |
The surface and cross-section morphology of the rust layers of CS and WS were investigated by environmental scanning electron microscopy (SEM), and the element content in the rust layer was obtained by energy dispersive spectrometer (EDS). And the rusty samples were scraped off with a blade to study the rust composition using X-ray diffraction (XRD). XRD (Ultima IV X, Cu target, working voltage 40 kV, working current 40 mA, wavelength 1.5406 Å) was used to quantitatively analyze the rust layer powders corroded for different time. The scanning speed was 20°/min, and the scanning range of the diffraction angle was 10°-100°. In addition, Micro-Raman spectrometer was used to analyze the components of rust layers by an Invia Reflex equipped with a YAG laser (532 nm). The Raman shift range was 0⁓1800 cm-1 and the spectrum acquisition time was 30 s. For reference, the peak positions of the rust layers are shown in Table 2 for the identification of the phases [2,[4], [5], [6]].
Table 2 Peak positions of Raman spectra corresponding to the phases in the rust layers.
| Phase | Peak position (cm-1) |
|---|---|
| Lepidocrocite (γ-FeOOH) | 217, 251, 655,713, 1300 |
| Goethite (α-FeOOH) | 203, 244, 300, 387, 399, 415, 480, 552, 684, 1002, 1113, 1304 |
| Akaganeite (β-FeOOH) | 308, 389, 499, 539, 609, 1410 |
| Magnetite (Fe3O4) | 306, 538 |
| Hematite (Fe2O3) | 228, 250, 294, 502, 1330 |
| Maghemite (γ-Fe2O3) | Broad band between 339 and 386, 461 and 512, 671 and 717, 1430 |
| Ferrihydrite (Fe5HO8·4H2O) | Broad band between 700 and 710 |
All electrochemical measurements of the samples of CS and WS were performed by a Gamry (Interface 1010E) workstation. Polarization curves and electrochemical impedance spectroscopy (EIS) were measured adopting a three-electrode system, i.e., saturated calomel electrode (SCE) as the reference electrode, platinum as the counter electrode, bare or rusted samples of CS and WS which the exposure area of 1 cm2 as the working electrode. Simultaneously, the working electrode and the reference electrode were connected by the saturated KCl agar salt bridge. The scanning rate of the polarization curves was 0.165 mV/s from -1.0 VSCE to 0.3 VSCE and the frequency range of EIS was 105-10-2 Hz, and the electrolyte was 1 wt% NaCl solution. All the tests were carried out in a water bath at 40 ℃.
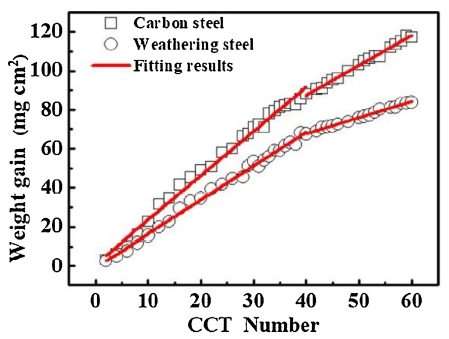
As shown in Fig. 1, the changes of corrosion weight gain of CS and WS are divided into two corrosion stages at 40 CCT, and the curves almost linearly increase at each stage. It can be seen from Table 3, the slopes in the initial stage are higher than that in the second one. At the same time, the slopes of the weight gain curves of two steels are relatively close in the first corrosion stage. During the whole corrosion stage, the slope of WS is lower than that of CS, especially is less than 1 in the second corrosion stage. That is indicated the WS matrix is protected gradually by the rust layer with the process proceeds and the corrosion tendency is significantly reduced.
Fig. 1. Corrosion gain results of CS and WS.
Table 3 Fitting results of the corrosion weight gain of CS and WS.
| Steel | The first stage | The second stage |
|---|---|---|
| CS | y = 2.27x+0.89, (0≤x≤40), R2 = 0.99 | y = 1.54x+25.85, (40≤x≤60), R2 = 0.99 |
| WS | y = 1.74x+0.88, (0≤x≤40), R2 = 0.99 | y = 0.83x+34.50, (40≤x≤60), R2 = 0.99 |
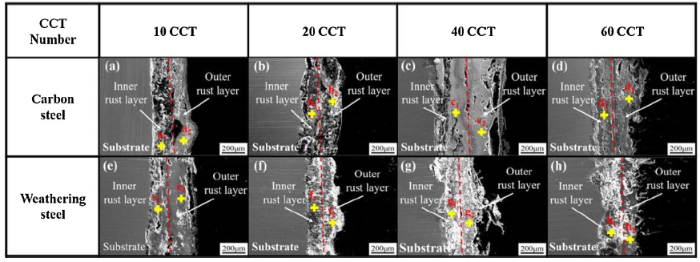
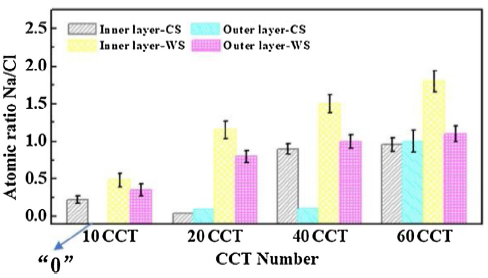
The cross-sectional morphologies of CS and WS under different CCT are shown in Fig. 2. The variation of Na/Cl value in the inner and outer rust layers of CS and WS with the increase of CCT number as can be seen in Fig. 3. It is easy to see that the distributions of Cl- in the rust layers of CS and WS. In the initial stage, the rust layer of CS is loose and porous from 10 to 20 CCT. And a large amount of Cl- can be permeated into the rust layer and reached to the steel matrix, thus the corrosion rate is very high at this stage. After 40 CCT, the rust layer of the sample becomes thicker and denser. However, there are still large cracks on the substrate surface of the whole rust layers. Many small cracks are also found in the inner rust layer, and Cl- can be mainly concentrated in the vicinity of the outer rust layer. In the second stage, the inner rust layer becomes thicker and denser for the 60 CCT. Although the outer rust layer still has a low density of cracks and pores, it is also continuous. At this time, Cl- is distributed throughout the rust and mainly concentrated near the steel matrix. It is indicated that the anion selective permeability characteristics of the rust layer of CS become more and more obviously in the second stage. From the evolution law of the cross-section morphology of the rust layer, it can be inferred that the change of the rust thickness at 40 CCT is the cause of the corrosion rate change of CS.
Fig. 2. Cross-sectional morphologies of the rust layers on CS and WS.
Fig. 3. Variation of atomic ratio of Na/Cl value in the inner and outer rust layers of CS and WS with the increase of CCT number.
For WS, there are many cracks and holes in the whole rust layers at 10CCT, especially at the interface between the matrix and the rust layer. Therefore, the corrosion rate of WS is also very high in the first 10 CCT. At 20 CCT, the whole rust layer is dense and a small amount of Cl- accumulates around the steel matrix through the rust layer, thus the phenomenon of stratified enrichment occurs. The initial rust layer formed of WS at this stage has certain protective property, and the corrosion rate is lower than that of CS. At 40 CCT, the rust layer becomes thicker and denser, but the debonding appeared at the interface between the matrix and the rust layer. Simultaneously, some holes can be also observed. However, the compactness of the inner rust layer can make the product layer still has a certain protective effect on the penetration of Cl-. Therefore, Cl- is mainly concentrated near the edge of the outer rust layer. Subsequently, the inner and outer rust layers become thicker, denser and more continuous at 60 CCT. The debonding disappeared at the interface between the matrix and the rust layer, thus indicating that the new formations of the granular corrosion products are filling the cracks and holes in the rust layers as the corrosion progress proceeded and restoring the rust layers to protection. From the evolution law of the cross-section morphology of the rust layer, it can be inferred that a dense rust layer formed at 40 CCT is the cause of the corrosion rate change of WS.
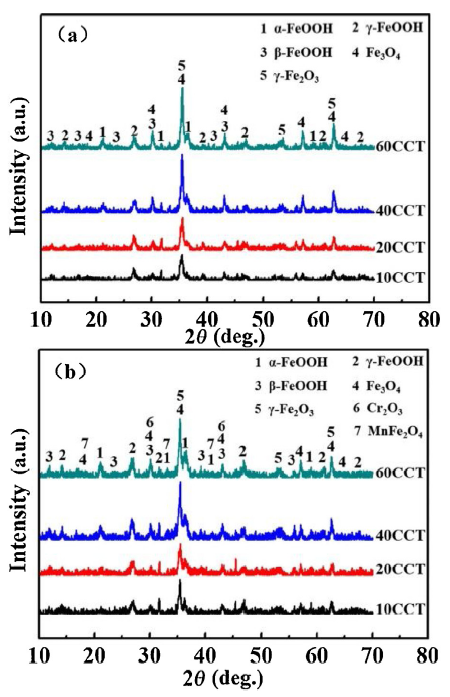
As shown in Fig. 4, the variations of the phase composition of the rust layers of CS and WS, respectively. Significantly, α-FeOOH, γ-FeOOH, β-FeOOH, Fe3O4 and γ-Fe2O3 (obtained by oxidation of Fe3O4) are all detected in the rust layers of two steels. In addition, a small amount of Cr2O3 and MnFe2O4 are also detected in the rust layer of WS. With the corrosion progress proceeds, the peak intensities of α-FeOOH, Fe3O4 and γ- Fe2O3 of two steels increased gradually, whereas the peak intensity of γ-FeOOH decreased gradually. Obviously, the change of β-FeOOH peak intensity of carbon steel is not obvious, while that of WS presented a decrease tendency. It shows that in the high concentration of Cl- marine atmosphere, Cl- has strong permeability in the whole evolution process of rust layer for both CS and WS. Even though a dense rust layer has been formed on the surface of WS, the destructive effect of Cl- on the rust layer still existed after the conversion from anion selective permeability to cationic selective permeability [31,32]. However, the corrosion rate in the second stage is lower than that in the initial stage due to the rust layer hinders the Cl-, so the protection effect is larger than the damage effect.
Fig. 4. Evolution of the phase composition of the rust of CS and WS by XRD test: (a) CS; (b) WS.
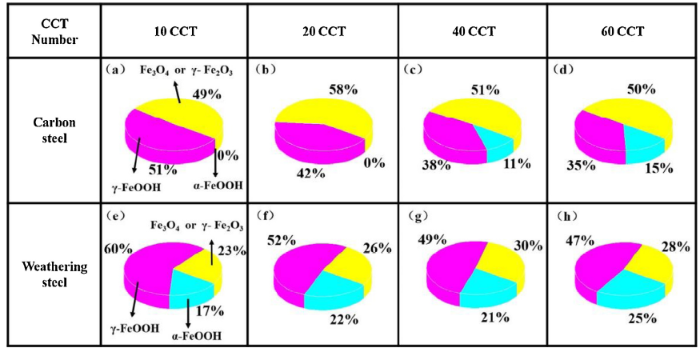
In order to determine the proportion of different crystal phases in the rust layers of both CS and WS, a semi-quantitative analysis (relative error is about 10%) was performed by X'pert Highscore Plus based on the Relative Intensity Ratio method (RIR) [33,34], and the results are shown in Fig. 5. In fact, as an important index, the relative content of α-FeOOH are adopted to evaluate the protection of the corrosion products of WS and α-FeOOH is generally increased in the rust layers of WS in the atmospheric environment [35]. For CS, the relative contents of γ-FeOOH in the rust layers decreased generally with the increase of the CCT number, and a small amount of α-FeOOH is detected from 40 to 60 CCT. However, for WS, the relative contents of γ-FeOOH increased firstly and then stabilized, and that of α-FeOOH increased generally.
Fig. 5. Semi-quantitative analysis of the rust layers formed on CS and WS with the increase of CCT number.
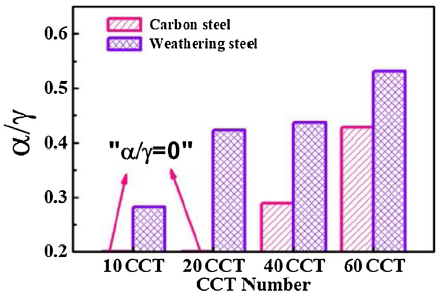
Cheng et al. [36] reported that the mass ratio of α-FeOOH to γ-FeOOH (α/γ) in the corrosion products was obviously related to the relative corrosion resistance of WS in the coastal atmosphere. Meanwhile, Morcillo et al. [37] reported that α/γ could be used as an indicator for evaluating the protective ability of the corrosion products of WS. Thus, as the ratio of α/γ shown in Fig. 6, the ratios of α/γ of two steels generally increase with CCT number. Furthermore, WS always has the higher α/γ ratio than carbon steel and the results agree with an earlier report [38], indicating that γ-FeOOH is able to convert into α-FeOOH more easily in the WS compared with CS.
Fig. 6. Mass ratio of α/γ in the rust layers of CS and WS.
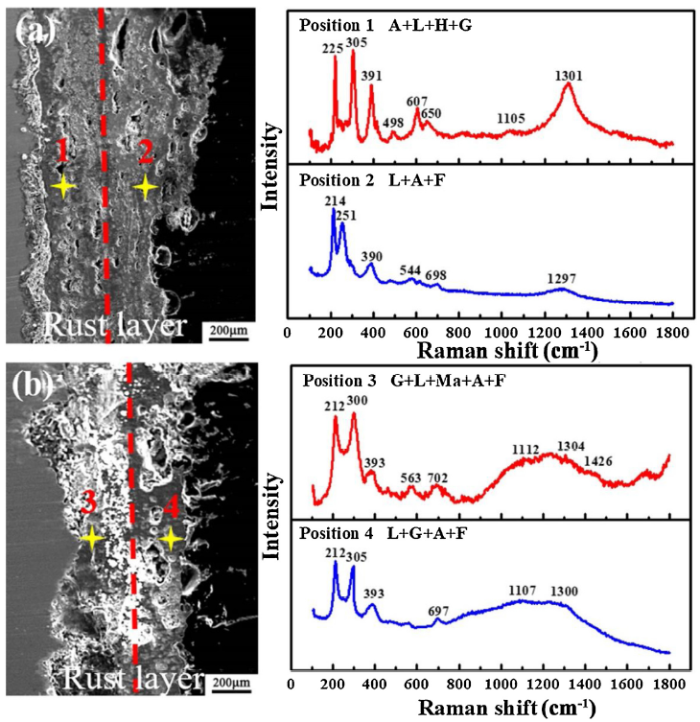
Usually, amorphous phases could not be accurately identified using XRD when they were blended with the crystal phases [[2], [3], [4]]. In addition, the phase distribution in the rust layers could not be obtained only by XRD. Thus, it is necessary to further analyze and determine the phase composition and distribution in the rust layer by micro-Raman spectroscopy. Fig. 7 shows that the results of Micro-Raman spectroscopy measured on the cross-sections of CS and WS. And it can be seen from Fig. 7(a), the composition phases of the inner rust layer of CS are mainly akaganeite and lepidocrocite. Moreover, hematite and a small amount of goethite are also detected, i.e. position 1. The main components of the outer rust layer of CS are lepidocrocite and akaganeite, accompanied by a small amount of ferrihydrite (XRD cannot be correctly identified), i.e. position 2. The composition phases of the inner rust layer of WS are significantly different from that of CS, as shown by position 3 in Fig. 7(b), consisting of a large amount of goethite. And lepidocrocite and a small amount of maghemite, akageneite and ferrihydrite were also detected. Similar to carbon steel, the composition phases of the outer rust layer of WS are also composed of lepidocrocite, akageneite, a small amount of ferrihydrite and some goethite is also detected, as shown in position 4.
Fig. 7. Raman spectra measured on CS (a) and WS (b) (A: akaganeite, L: lepidocrocite, G: goethite, F: ferrihydrite, Ma: maghemite, H: hematite).
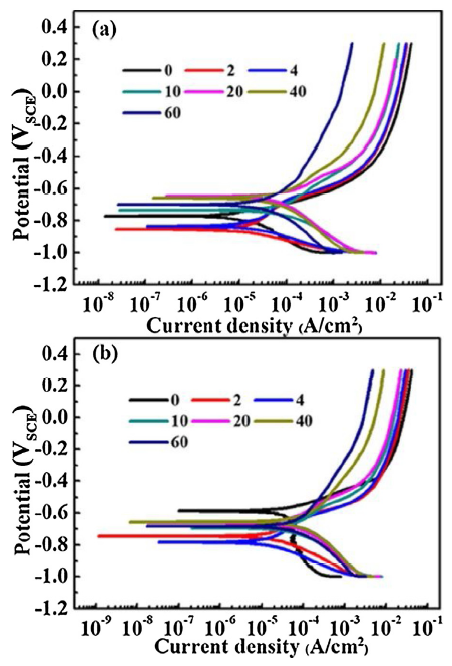
As shown in Fig. 8, the variations of the polarization curves of naked and rusted CS and WS under different CCT number, respectively. For naked steel (0 CCT), the H+ reduction is only dominated in the cathodic process of CS, whereas the diffusion of H+ and dissolved oxygen are dominated in that of WS. And the dissolution of the steel matrix is dominated in the anodic process. However, for 2 CCT, the reduction of the rust layer becomes the main controlling factor of the cathode process of WS, followed by the reduction of dissolved oxygen. During the initial stage, the cathode process is strengthened, but for the second stage it is tended to be stable. The anode process is gradually suppressed in the whole corrosion progress. As the corrosion progress proceeds at 40 and 60 CCT, the evolution of the cathodic process of WS shows no significant difference, indicating that it is tended to be stable for the relative content of γ-FeOOH in the corrosion product [18], while that of CS presents some irregular evolution.
Fig. 8. Polarization curves of naked and rusted CS (a) and WS (b) at different CCT numbers.
In the whole corrosion process, the corrosion potentials of both CS and WS gradually decreased negatively in the initial stage, and the negative shift degree of the corrosion potential of WS is much larger than that of CS. Subsequently, the corrosion potentials of two steels are gradually shifted positively. As the increase of the CCT number, the anode current density of both CS and WS gradually decreased. The difference of the current density of WS between 40 CCT and 60 CCT is small, while that of CS is large. It shows that during the change from 40 to 60 CCT, the self-repairing speed of the rust layer of WS has little effect on the protection performance of the whole rust layer, thus the anode current density shows no significant change in this self-repairing process.
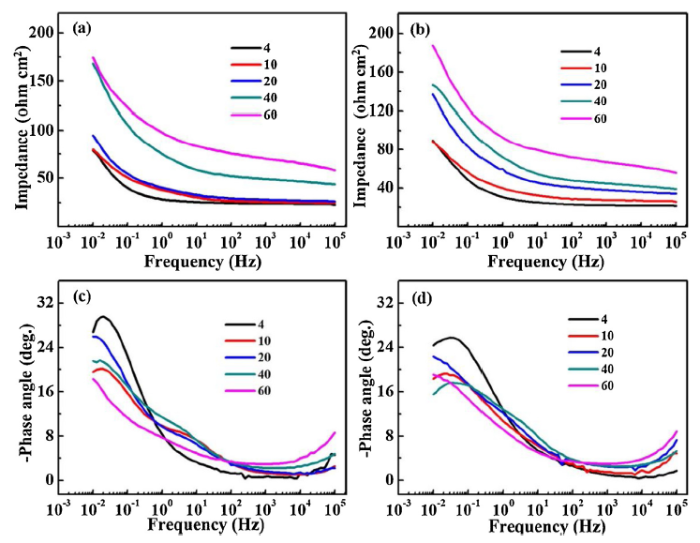
Fig. 9 shows that bode plots based on the EIS results of the naked and rusted CS and WS at different CCT numbers. It is easy to notice that the impedance values of WS and CS at low frequencies are gradually increased, indicating that the protection of both two steels increased with the CCT number. Moreover, the impedance of weathering steel in each CCT process is higher than that of CS. During the initial stage (4-20 CCT), the impedance of CS at high frequency and low frequency are relatively close, the difference between low frequency and high frequency of 40 CCT and 60 CCT is increased gradually. However, the difference of WS from 4 to 60 CCT is always large. It can be seen from angle diagram (Fig. 9(c) and (d)) that the peaks of phase angle of two steels are decreasing, indicating that the resistance of electrolyte permeating to rust layer is increasing gradually [39].
Fig. 9. Bode plots of the EIS results for the rusted CS and WS at different CCT numbers: (a) impedance for CS; (b) impedance for WS; (c) phase angle for CS; (d) phase angle for WS.
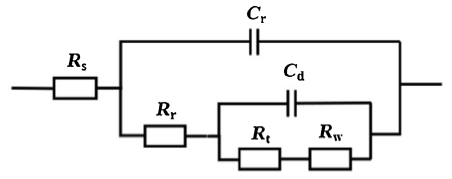
Fig. 10 shows that the equivalent electrical circuit of the rusted samples of two steels [40]. As can be seen from this figure, Rs is the resistance of the solution, Cr and Rr represent the capacitance and resistance of the rust layer, respectively. Cd represents the capacitance of the double electrode layers, Rt represents the charge transfer resistance and Rw represents the Warburg impedance.
Fig. 10. Equivalent electrical circuit of rusted CS and WS.
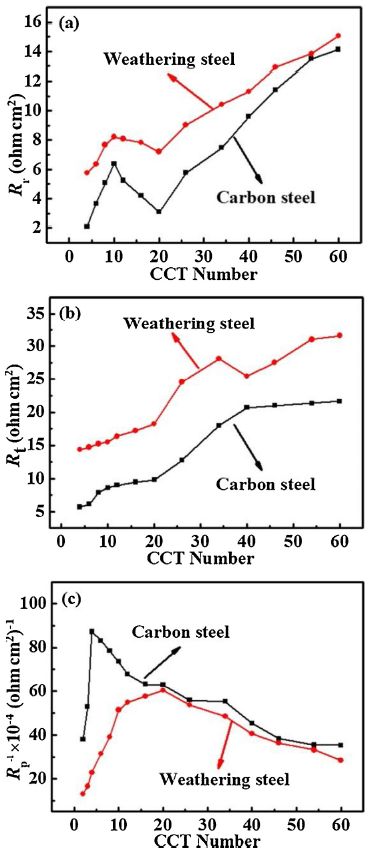
Fig. 11 shows that the variation of the fitting results of Rr, Rt and Rp-1 (reciprocal of Rp) for CS and WS at different CCT number. As shown in Fig. 11(a) and (b), the Rr and Rt of WS are always larger than that of CS throughout the whole experimental process. Rt of CS is increased gradually in the initial stage and then tends to be stable. Moreover, the fluctuation of Rt is small in the second stage. However, Rt of WS has an increasing trend and decreases suddenly at 40 CCT, it is related to the defect deteriorated the protective property of the steel substrate. The Rr of two steels are both increased firstly and then decreased at the first 20 CCT, and reached the maximum at 10 CCT, it is different from the conclusion that Rr has been increasing all the time in the literature. After 20 CCT, the Rr of both steels gradually increased, and the two curves became closer and closer. Although the rust layers of two steels fluctuated in varying degrees due to the lack of compactness, and the effect of the crack cavity at the beginning of corrosion, the fluctuation was not sufficient to cause the change of corrosion rate [11]. Thus, the conclusions of electrochemical measurement can be consisted with the change of corrosion rate.
Fig. 11. Variation of Rr (a), Rt (b) and Rp-1 (reciprocal of Rp) (c) with the increase of CCT numbers in CS and WS.
In general, the polarization resistance Rp is calculated by Rp=Rr+Rt. In this work, Rp is obtained by analyzing the slopes of the linear polarization curve [41,42]. Rp is related to anodic reaction and can be reacted well with the corrosion process. Therefore, Rp is used to characterize the corrosion rate [43]. Rp-1 (reciprocal of Rp) can more intuitively characterize the corrosion reaction of the steels [16]. Fig. 11(c) shows the variation of Rp-1 of CS and WS with the increase of CCT number. As shown in the figure, Rp-1 of CS and WS are both increased firstly and then decreased, and Rp-1 of CS is significantly larger than that of WS at first 20 CCTs. For carbon steel, Rp-1 increased rapidly during the first 10 CCTs, and then decreased gradually from 10 to 40 CCT. After 40 CCT, Rp-1 remained almost unchanged. As for weathering steel, Rp-1 still increases rapidly during the first 10 CCT processes and that is the same as carbon steel. However, it increases slowly from 10 to 20 CCT and then decreases gradually from 20 to 60 CCT. It shows that at the beginning of corrosion, the new formations of the rust layers on the surface of CS and WS are very thin, loose, porous and discontinuous. Thus, Cl- can easily penetrate the steel matrix through the rust layer, resulting in a high corrosion rate. At this time, it is because of the reduction of dissolved oxygen in the cathode reaction, a large amount of material like FeOOH is contained in the initial rust layer formed of CS and WS. And the FeOOH can be reduced to Fe3O4 [35], thus the corrosion rate rapidly increased at this stage. However, the corrosion rate of WS is still increasing slowly from 10 to 20 CCT, indicating that Cl- has a great effect on the corrosion process of WS when there is no protective rust layer formed. After 20 CCT, some dense rust layers formed gradually on the surface of CS and WS and began to have a certain hindrance to Cl-, thus the corrosion rate gradually decreased.
This study focuses on the formation mechanism and evolution of surface rust layer of CS and WS in the simulated high-humidity and heat marine atmosphere. The weight gain of CS and WS were divided into two corrosion stages. In each stage, the average weight gain of two steels increased (Fig. 1). With 40 CCT as the critical point, the corrosion rate in the initial stage was higher than that in the second stage (Table 2). Obviously, the corrosion rate of WS was lower than that of CS during the whole experimental stage.
The study results showed that there was obvious boundary between the inner and outer rust layers of CS and WS (Fig. 2). Generally, the inner rust layer could be converted into an outer rust layer in the corrosion process [44]. Some researchers believed that the inner rust layer was attached to the steel matrix. Therefore, Rt was prone to affect the protection effect of the inner rust layer, whereas Rt was prone to affect the protection effect of the outer layer, indicating that Rt performed better than Rr in evaluating the protective performance of the rust layer [17].However, in this study, Rr was selected to represent the whole rust layers and evaluate the protection performance of the rust layers. A high content of Cl- has strong erosion ability to rust layer of CS and WS. As the CCT number increased, the barrier effects of the whole rust layers on Cl- were also changed (Fig. 3). In particular, the inner rust layer of WS, gradually showed defects and the ability to protect steel substrate decreased. However, since the outer rust layer was a protective layer, it still had a hindrance effect on Cl- as a whole. The hindrance effect was gradually enhanced as the corrosion process proceeded. Rt was gradually increased and suddenly dropped at 40 CCT (Fig. 11(b)). The changes could simulate the evolution of the inner rust layer. Rr slightly fluctuated within a short period and then tended to increase gradually, so it could well simulate the corrosion evolution of the whole rust layer.
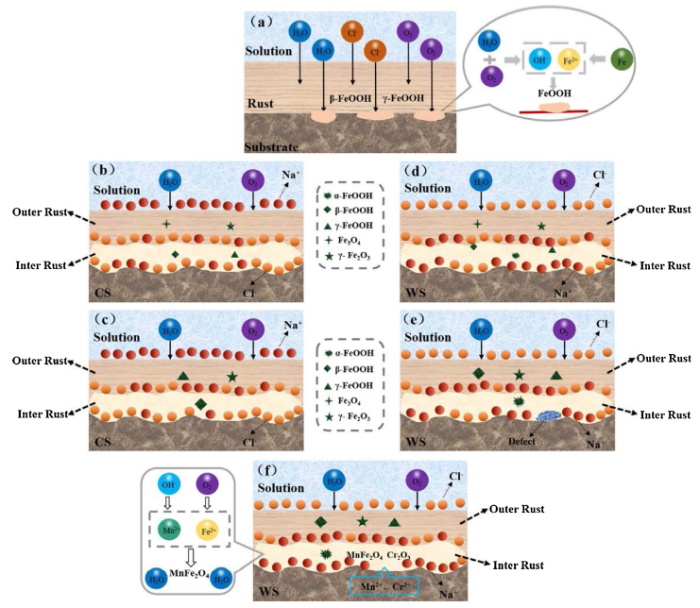
Tamura [45] reported that the rust layer surface was occasionally dyed yellow and that the “rust liquid” seemed to leak from the inner rust layer, thus forming a new rust with yellow color that it could be named “flowing rust”, which might be β-FeOOH. The results of atmospheric corrosion test by Zhang et al. showed that γ-FeOOH was firstly formed on the substrate surface of both CS and WS, indicating that“flowing rust” was γ-FeOOH [29]. However, the study results showed that“flowing rust” was composed of β-FeOOH and γ-FeOOH. The corrosion processes of CS and WS at the beginning (0-10 CCT) were similar (Fig. 12(a)). The main processes in the initial stage were the anode dissolution of Fe and the cathode reduction of H+ and dissolved O2 (Fig. 8). At this time, the substrate surface was covered with an oxide layer of Fe3O4 or γ-Fe2O3, and then Fe2+ was hydrolyzed to form a precipitate of FeOOH. The types of the FeOOH are mainly β-FeOOH and γ-FeOOH (Fig. 4).
Fig. 12. Schematic diagram of corrosion mechanism of CS (a-c) and WS (d-f).
Fig. 12(b) and (c) shows the evolution mechanism of the rust layer of CS. Actually, β-FeOOH and γ-FeOOH are unstable products and have strong reducibility, thus increasing the active region of the cathodic reaction [46]. Therefore, the cathodic process of carbon steel exhibited an irregular evolution (Fig. 8(a)). In addition, during the growth of the rust layer, the electrochemical mechanism became the dominant mechanism [47]. A small amount of α-FeOOH was formed and the penetration resistance of the electrolyte into the rust layer was gradually increased (Fig. 9(a) and (c)). Yet, the composition phase of the inner rust layer of CS was mainly akageneite and that of the outer rust layer was lepidocrocite (Fig. 7(a)). With the Cl- in the rust layer accumulated, the anion selective permeability of the rust layer of CS was enhanced, but the corrosion rate of CS was gradually reduced during the whole corrosion stage.
Unlike CS, the protection mechanism of the rust layer on WS is illustrated in Fig. 12(e) and (f).The results showed that the relative content of γ-FeOOH in the rust layer was stable, indicating that the evolution of the cathode process was not significant (Fig. 8(b)).During the oxidation of γ-FeOOH to α-FeOOH, cracks and pores occurred in the rust layer on WS due to the destruction effect of Cl- (Fig. 12(e)). It was reported that the rust called Fe(OH)3(s) gel was formed immediately after quickly air oxidation in the corrosion area, and filled the voids in the rust layer, thereby generating a compact, adhering and continuous rust layer having self-retaining properties [37,48]. The rust membrane acted to block the water and oxygen penetrating and transferring from the corrosive media. Since the self-repairing speed of the rust layer of WS had little effect on the protection performance of the entire rust layer, the anode current density showed no significant change in this self-repairing process (Fig. 8(b)) and Rt increased slowly in the second stage (Fig. 9(b)).In addition, part of the Fe(OH)3(s) gel rust had been converted into α-FeOOH and the composition phase of the inner rust layer was consisted of a large amount of goethite. lepidocrocite and akaganeite were mainly detected in the outer rust layer (Fig. 7(b)). Therefore, α-FeOOH formed in the inner rust layer could block the migration of Cl- (Fig. 3) and showed the protection effect to a certain degree. WS in this study contains a transition metal M (such as Mn). Transition metal Mn is also oxidized to hydroxide into Mn (OH)2(s) through the iron-like corrosion process and becomes one part of the rust layer. After the transition metal ion Mn2+ was mixed into the Fe(OH)2(s) gel, Mn2+ was aged in a weakly alkaline and weakly oxidized solution to form a transition metal ferrite, MnFe2O4 [49,50]. In addition, the alloy element Cr existed in the rust layer in the form of Cr2O3 (Fig. 4). Due to the low contents of alloying elements, the contents of MnFe2O4 and Cr2O3 in the rust layer might be small, but it still had a strong protective effect on the steel matrix (Fig. 12(f)). Therefore, the resistance of the WS in the second stage was stronger than that of CS (Fig. 9(b) and (d)). Rp-1 gradually decreased (Fig. 11(c)) and the corrosion rate was low. Moreover, the cation selective permeability characteristics of the rust layer of WS were more and more obvious in the whole corrosion process.
The corrosion process of CS and WS was divided into two stages and the slope of the initial stage was higher than that of the second stage. During the whole corrosion stage, the slope of WS was lower than that of CS. The composition phase of the inner rust layer of CS was mainly akageneite and that of the outer rust layer was lepidocrocite. For WS, the composition phase of the inner rust layer was consisted of a large amount of goethite. Lepidocrocite and akaganeite were mainly located in the outer rust layer. With the increase in the CCT number, the evolution of the cathodic process of WS was not obvious, whereas CS showed irregular evolution. Rr performed better than Rt in evaluating the performance of the rust layer. Since the self-repairing speed of the inner rust layer in the WS has little effect on the protection performance of the entire rust layer, the anode current density showed no significant change during the self-repairing process, and Rt increased slowly in the second corrosion stage.
This work was supported financially by the National Key R&D Program of China (No. 2016YFE0203600), the National Natural Science Foundation of China (No. 51571027) and the National Environmental Corrosion Platform (NECP).

 WeChat
/
| 〈 |
|
〉 |