Search for articles:
Yuanhao Dong, Sansan Shuai , Tianxiang Zheng, Jiawei Cao, Chaoyue Chen, Jiang Wang, Zhongming Ren
Corresponding authors:
Received: 2019-03-30
Revised: 2019-05-18
Accepted: 2019-06-15
Online: 2020-02-15
Copyright: 2020 Editorial board of Journal of Materials Science & Technology Copyright reserved, Editorial board of Journal of Materials Science & Technology
More
Abstract
The morphological instability of solid/liquid (S/L) interface during solidification will result in different patterns of microstructure. In this study, two dimension (2D) and three dimension (3D) in-situ observation of solid/liquid interfacial morphology transition in Al-Zn alloy during directional solidification were performed via X-ray imaging. Under a condition of increasing temperature gradient (G), the interface transition from dendritic pattern to cellular pattern, and then to planar growth with perturbation was captured. The effect of solidification parameter (the ratio of temperature gradient and growth velocity (v), G/v) on morphological instabilities was investigated and the experimental results were compared to classical “constitutional supercooling” theory. The results indicate that 2D and 3D evolution process of S/L interface morphology under the same thermal condition are different. It seems that the S/L interface in 2D observation is easier to achieve planar growth than that in 3D, implying higher S/L interface stability in 2D thin plate samples. This can be explained as the restricted liquid flow under 2D solidification which is beneficial to S/L interface stability. The in-situ observation in present study can provide coherent dataset for microstructural formation investigation and related model validation during solidification.
Keywords:
As a primary processing method of metals or alloys, solidification process has a profound effect on the formation of microstructure, and thus affects the in-service mechanical properties of the final products. During solidification, the morphological instability at the solid-liquid interface significantly influences the microstructure formation. For instance, grains with dendritic, cellular or planar structure were observed under different solidification conditions. In general, the growth pattern in front of solid/liquid interface for a given alloy can be predicted by the classical “constitutional supercooling” theory first proposed by Tiller [1] in which the temperature gradient (G), growth velocity (v) and cooling rate (R) act as important roles. Mullins and Sekerka [2] further developed this theory by considering temperature field, solute field and interfacial energy comprehensively, using dynamical method to predict the interface morphology. Directional solidification technique is usually used to examine the growth pattern formation mechanisms of grains during solidification because of the controllability of solid-liquid interface [3,4]. Davis et al. [5] and Sato et al. [6] verified the validity of Mullins-Sekerka interfacial instability theory (M-S theory) via Sn-In and Al-Cu alloy, respectively by directional solidification. At low growth velocity regime, M-S theory can be seen as an extension of “constitutional supercooling” theory; however, it also predicted the absolute stability phenomenon under ultrahigh velocity regime. And this prediction has been verified by rapid solidification experiment via laser and electron beam [7,8]. Recent years, lots of amendatory investigations on M-S theory have also been reported: Huang et al. [9] aimed at equilibrium distribution coefficient and analysed the effects of the deviation of actual solute distribution from the equilibrium one at interface on the constitutional supercooling theory firstly; He et al. [10] focused on interfacial kinetics and indicated that interface energy and interfacial kinetics are beneficial to the stabilization of planar interface. Coriell et al. [11] assessed the effect of free convection of liquid on temperature and solute field and predicted convective-like long wavelength instability occurs at a critical concentration.
However, most of previous investigations on solid/liquid interface stability were carried out based on quenched samples using optical microscope (OM) or scanning electron microscopy (SEM) to get 2D microstructures of the samples. As a post-mortem method, quenching by quickly withdrawing the specimen into Ga-In-Sn liquid metal coolant to “freeze” the interface morphology was frequently applied to investigate the issues of solid/liquid interface stability [12]. However, these techniques are destructive (the material need to be sectioned) and provide only 2D images on which some of the real 3D microstructures cannot be revealed. In addition, the post-mortem studies are unable to provide the evolution or transition process of solid/liquid interface during solidification. These limitations have led to the development of new methods to allow obtaining 3D or even 4D (3D plus time) images for a better representation of the microstructure. At the earliest, 2D in-situ investigation on microstructure formation during solidification were carried out in transparent metal analogue such as Succinonitrile (SCN) and its alloys using high speed camera [[13], [14], [15], [16]]. These studies also provided some important evidence on supporting numerical simulations aiming at accurate description of microstructure formation during solidification. However, due to the differences of physical properties between metallic and organic materials, the research on achieving the in-situ observation of metallic solidification is still necessary in order to accurately investigate their solidification structures. Recent years, thanks to the advance in X-ray radiography and tomography, in-situ studies of microstructure evolution during the processing of metallic materials have been reported. Real-time observation experiments at ultrafast frame rates have been largely carried out on binary Al-based (Al-Cu [17,18], Al-Ni [19,20], and Al-Si [21,22]) and Sn-based (Sn-Bi [23], Sn-Pb [24] and Sn-Cu [25,26]) alloys due to the good contrast in gray level image under X-ray radiation [27]. 2D radiography with thin (≤200 μm) sheet-like samples [17,[28], [29], [30]] and 3D tomography with cylinder or bulk samples [[31], [32], [33]] are two main research methods. Wang et al. [34,35] investigated the directional solidification under magnetic field by 2D radiography and directly observed the fluid flow caused by thermoelectric magnetic effect. In-situ 3D tomography experiments, known as 4D imaging, have also been widely performed. By rotating the sample during solidification, projections of at least 180° could be reconstructed to the real 3D model of material structures. Shuai et al. [36,37] quantified the 3D dendritic morphology evolution in Mg-based alloy, accurately characterized the orientation selection of α-Mg in 3D space. Cai et al. [38] studied the cellular-to-dendrite transition during directional solidification of Al-Cu alloy via 4D synchrotron X-ray tomography. However, the investigation aiming at the issues of solid/liquid interfacial instability during directional solidification by in-situ observation is still limited.
In this study, a temperature gradient stage integrated with laboratory X-ray source was applied to study solid/liquid interface transition of Al-30 wt.%Zn alloy during directional solidification. Real-time 2D radiography and 3D tomography were performed, enabling the quantitation of solid/liquid interface transition from dendritic to cellular and then to planar with increasing thermal gradient. The results were compared with post-mortem experiments and existing classical theoretic model, informing that the in-situ experimental result can provide a unique dataset for model verification and amendment.
Al-30 wt.%Zn alloy was prepared by melting pure aluminum (99.99%) and zinc (99.99%) in an induction furnace under the protection of high purity argon. The melted metal was casted into a cylindrical corundum crucible. Then the Al-30 wt.%Zn ingot were cut by electric discharge machining (EDM) to sheet-like samples with a size of 50 mm (length)×10 mm (width)×0.3 mm (thickness) and cylinder samples with Φ3 mm in diameter and 100 mm in length. The sheet-like samples were mechanically polished to about 200 μm in thickness and then sandwiched between two boron nitride (BN) plates with thickness of ~500 μm. And cylinder samples were placed into BN tubes with inner diameter of ~3 mm and thickness of ~1 mm. Then samples were mounted on a furnace for in-situ observation of directional solidification, as shown in Fig. 1. The furnace mainly consists of three parts: two independently controlled heating zones located in the bottom and top of the furnace and a window with a size of 10 mm in height and 20 mm in width made of BN, allowing the penetration of X-ray. Two heating zones were set with different temperatures (usually hotter in top and colder in bottom) to obtain longitudinal temperature gradient (G) along the sample. Four thermocouples were used to control and measure the temperature during experiments: two controlling thermocouples located in the center location of two heaters and two measuring thermocouples located in the top and bottom of the X-ray window (not samples) to measure the actual temperature gradient of the sample in the field of view (FOV). Temperature difference between two heaters was set to produce a vertical temperature gradient. Bottom heater was set to a lower temperature so that the sample solidified vertically upwards.
Fig. 1. Schematic of the temperature gradient furnace and experimental setup in micro-CT.
Currently, most in-situ experiments were performed in Synchrotron Radiation Facility, using high-energy, high-frame-rate, parallel and monochromatic X-ray beam [39]. Recently, related experiments were also performed successfully by laboratory X-ray source [[40], [41], [42]]. Zimmermann et al. [40] studied the formation of the grain structure in Al-10 wt.%Cu alloy during directional solidification in a lab microfocus CT machine. Nguyen-Thi et al. [42] performed the in-situ observation in space to investigate the solidification behavior under microgravity environment. Although the spatial resolution and gathering efficiency of laboratory X-ray beam is not as good as synchrotron X-ray beam, some 2D radiography and slow 3D tomography experiment are still available using laboratory X-ray source.
Fig. 1(c) shows the schematic of industrial Computed Tomography (CT) device for present experiments. The apparatus mainly contains the X-ray source, rotation table and the X-ray detector as well as the furnace used for in-situ solidification. The microfocus X-ray source is a directional type X-ray tube. It provides a sufficient photon flux to ensure good image contrast to study Al-Zn based alloys. A white cone X-ray beam was emitted to penetrate the sample and the transmitted X-ray with different intensity was recorded by detector during directional solidification of samples. The acceleration voltage and emission current of experimental X-ray in this study were 140 kV and 60 μA. The detector with CCD-sensor converts X-ray radiation to the visible light radiographs, offering a FOV of 2048 × 2048 pixels with a pixel size of ~8.8 μm. For 3D in-situ observation of cylinder samples, 360 projections were collected over 360° with an exposure time of 500 ms per projection, hence the total time for each scan was about 3 min. Then the projections were reconstructed to slices for 3D rendering and further analysis. Due to the slow cooling-down process, temperature difference between each full scan is estimated to be ~1 ℃.
General 2D radiography and 3D tomography observations of microstructural evolution during cooling are presented first, followed by detailed quantification of the different solidification stages, including dendritic to cellular, cellular to planar transition and planar growth analysis.
3.1.1. Overall process of solidification and temperature control
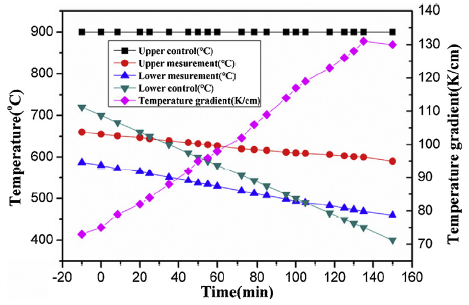
To investigate the transformation behavior of solid/liquid interface during different solidification stages, including dendritic to cellular, cellular to planar transition and planar growth, a linearly time dependent temperature gradient was imposed on the melted samples. Before solidification process, a preset temperature gradient correlated with two furnaces was designed (the upper 900 ± 1 ℃ and the lower 750 ± 1 ℃ in the center of the heaters) to ensure the complete melting of whole sample. The temperatures at the top and bottom of the window were measured to be 665 ℃ and 597 ℃, respectively. The temperature gradient was calculated to be ~68 K/cm at this moment. Following this, the upper heater was held at 900 ± 1 ℃ and the lower one was set to cool down at a constant cooling rate of 2 K/min. Therefore, the temperature gradient during experiment increases as the lower furnace cools down gradually. The variation of four measured temperatures at designated points and temperature gradient on the sample with time were plotted in Fig. 2. A considerable increase of thermal gradient from 68 K/cm to 130 K/cm was obtained during the whole solidification process.
Fig. 2. Temperature-time curves at different positions of furnace/sample and variation of temperature gradient for 2D radiographic experiment.
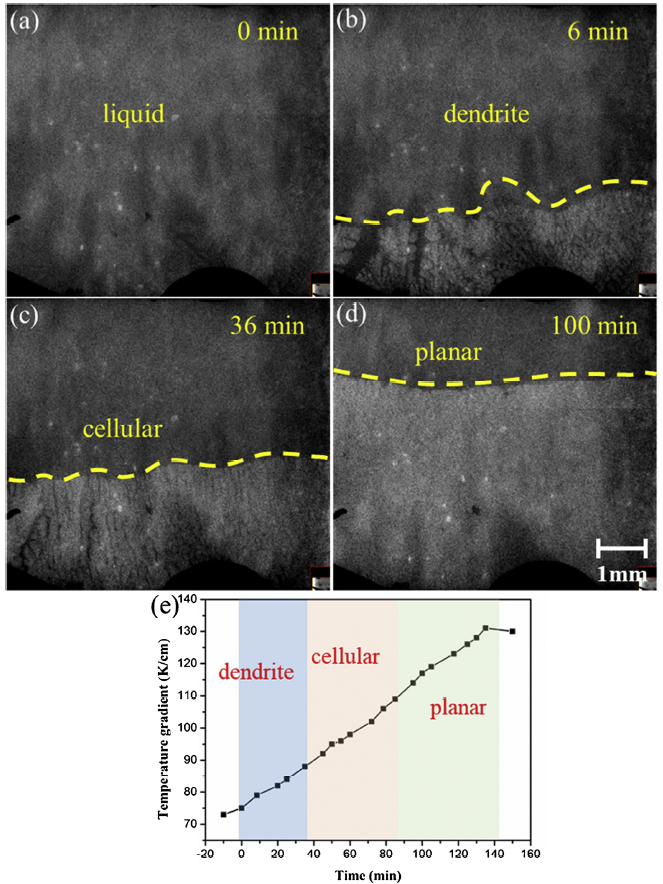
Fig. 3 shows the X-ray radiographic datasets at progressive solidification time of Al-30 wt.%Zn sheet-like sample within a field of view (FOV) of 7 mm × 7 mm (The whole 2D microstructure evolution during solidification can be found in Suppl.1). Prior to solidification in Fig. 3(a), no obvious dendritic structure was observed in the FOV, indicating the sample was completely melted. The time point when light grey structures (growing grains) appeared in the FOV was defined as the beginning timing (0 min) in Fig. 2, Fig. 3(a). Then the initial α-Al dendrites microstructure (light grey area) appeared in the bottom of image as indicated in Fig. 3(b) at about ~6 min. Typical dendritic growth with obvious trunk and secondary arms could be observed at the initial stage of solidification. These dendrites tended to grow along the direction of temperature gradient. During cooling process of the lower heater, the individual α-Al dendrites gradually grew and coarsened, until a slightly uneven cellular solid/liquid interface was achieved from ~36 min onwards, as shown in Fig. 3(c). As the thermal gradient performed on the sample increases, solid/liquid interface was found to transform continuously from cellular to planar, as depicted in Fig. 3(d). The inter-cellular area in the cellular solidification stage tended to disappear due to continuous coarsening during solidification. Fig. 3(e) shows the three distinct patterns of solid/liquid interface under different solidification stage with increasing thermal gradient.
Fig. 3. Overall observation of directional solidification of sheet-like sample: (a) whole liquid phase at 0 min; (b) dendritic growth stage at ~6 min; (c) cellular growth stage at ~36 min; (d) planar growth stage at ~100 min; (e) range of temperature gradient correspond to three growth stages.
The videos related to this article showing the evolution of microstructures during experiments can be found in Suppl. 1.
3.1.2. Dendritic to cellular transition
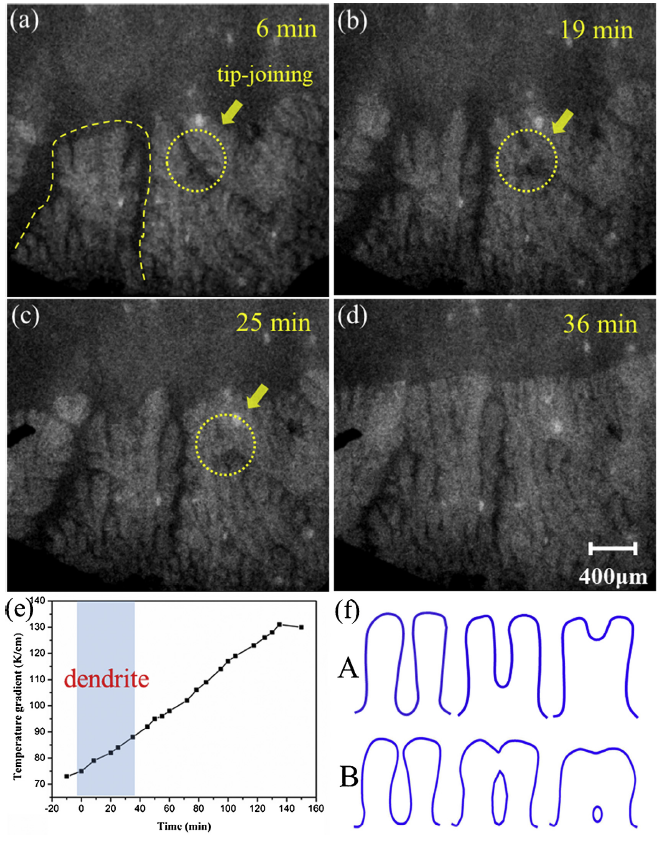
Fig. 4 shows a series of evolving dendritic structures at the initial period of experiment within a zoomed FOV of about 3 mm × 3 mm. The growth of dendrites and gradual transition to cellular interface could be observed. As shown in the yellow dashed profile on the left side of Fig. 4(a), in the earliest solidification stage, well-developed individual dendrites appeared in the FOV firstly. This phenomenon indicates that the parts of sample below the FOV performed a dendritic growth because of the smaller temperature gradient (0 min, 75 K/cm in Fig. 3(a)). At this stage, the morphology of solid/liquid interface presented an irregular form as can be seen from Figs. 3(b) and 4 (a)-(c). It is similar to seaweed-like pattern, which has also been observed in thin crystals imaged via 2D methods [43,44].
Fig. 4. Dendritic to cellular growth transition during directional solidification at: (a) 6 min; (b) 19 min; (c) 25 min; (d) 36 min; (e) range of temperature gradient at dendritic growth stage; (f) two dendritic coarsening mechanisms: (A) proposed by Kattamis [
Coarsening could be clearly observed in Fig. 4. Tiny microstructures coarsened and became thick and smooth with the growth of dendrites, as shown in Fig. 4(c) and (d). The filling of the roots and the joining of the tips could be observed in the images indicated by arrows. Those phenomena were resulted from coalescence mechanism proposed by Kattamis et al. [45] and Mortensen [46] during isothermal coarsening, as illustrated in Fig. 4(f). From ~36 min on ward, only continuous and thick cellular structures can be observed and all individual dendrites disappeared (Fig. 4(d)). Namely, it appears that dendritic growth and coarsening always occurred concurrently during solidification, leading to the coalescence of inter-dendrite areas and finally the transition from dendritic to cellular. The coarsening process might result in lower solute concentration gradient in front the S/L interface. This will reduce the constitutional supercooling and finally promote the stability of S/L interface.
3.1.3. Cellular to planar transition
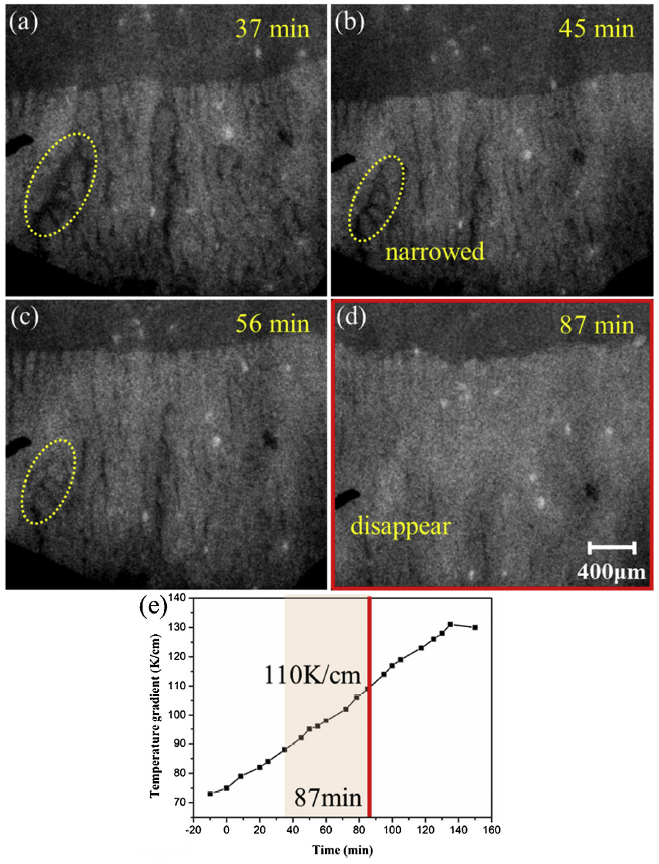
When the growth pattern came to stage ii: cellular growth, the macro morphology of S/L interface became more even as shown in Fig. 3(c). Secondary arms were no longer observed. The growth front became stable across the whole FOV as it might reaches a Mullins-Sekerka morphological stability state [2]. Fig. 5 are zoomed FOV of 3 mm × 3 mm describing the evolution of the interface from cellular to nearly planar. As shown in Fig. 5(a) and (b), at the period from ~37 min to ~56 min, a typical cellular structure grew along the direction paralleled to temperature gradient. With the increase of temperature gradient, the boundaries of cellular structures disappeared gradually, the columnar cellular crystals became thicker as shown in Fig. 5(c). At ~87 min when the temperature gradient was ~110 K/cm, no obvious cellular structures could be observed in the FOV and a nearly planar solid/liquid interface achieved and kept until the end of solidification (Fig. 5(d)). Roughly, the thermal gradient at this point (~110 K/cm) can be considered as the critical value for cellular to planar transition.
Fig. 5. Cellular to planar growth transition during directional solidification at: (a) 37 min; (b) 19 min; (c) 25 min; (d) 36 min; (e) range of temperature gradient corresponding to cellular to planar growth stage.
Regardless of the perturbation, morphological instability of S/L interface is resulted from constitutional supercooling for binary alloy due to redistribution of solute during solidification. The critical condition of interface instability could be represented by equation [1]:
$\frac{G}{v}=\frac{mC_{0}}{D_{L}}\frac{1-k_{0}}{k_{0}}$ (1)
where G is temperature gradient, v is growth velocity, m is the slope of the liquidus line, k0 is the equilibrium distribution coefficient, C0 is the initial solute concentration and DL is the diffusion coefficient of the solute in the melt. The S/L interface instability occurs only if the $G/v<\frac{mC_{0}}{D_{L}}\frac{1-k_{0}}{k_{0}}$, namely cellular and dendritic growth occur. When $G/v>\frac{mC_{0}}{D_{L}}\frac{1-k_{0}}{k_{0}}$, the temperature of liquid phase is always higher than melting point of interface front, thus the crystal grows as a planar structure. So the critical G corresponding to the transition from cellular to planar during growth process can be supposed to be 110 K/cm at ~87 min.
During the transition from cellular to planar structure, coarsening process was also observed in the solidified solid phase as indicated by yellow dashed circle of Fig. 5(a)-(c). Inter-cellular areas were observed to become narrow and finally vanished. As a result, a complete planar structure without any boundaries and inter-cellular areas below the interface was formed as shown in Fig. 5(d). This result indicates that the achievement of directional microstructures involves not only the transition of interface growth, but also the coarsening process below the solid/liquid interface.
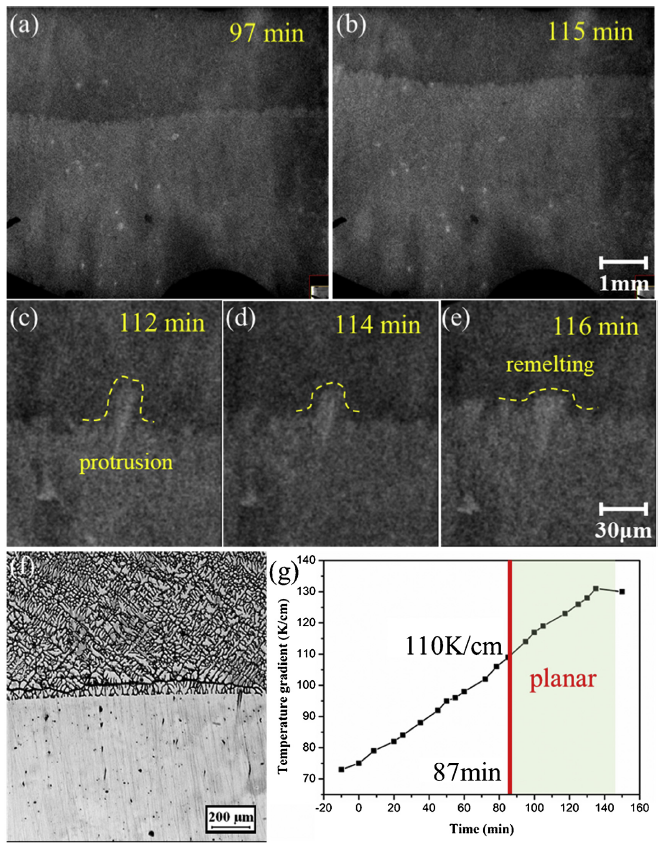
3.1.4. Planar growth with perturbation
After 87 min, as shown in Fig. 6(a) and (b), planar growth sustained until the end of experiment. However, the evolving S/L planar interface does not show a strictly smooth or straight shape. As shown in Fig. 6(c)-(e), small protrusion was also observed to arise and then degrade at the front of S/L interface. This protrusion should have become a seed of cellular crystal, but it wasn’t able to grow up due to relatively low constitutional supercooling. Therefore, planar growth should be a dynamic process instead of completely equilibrium state. This process cannot be illuminated by traditional metallography of planar crystal (shown in Fig. 6(f)) and can only be captured through in-situ observation.
Fig. 6. (a) and (b) planar growth in the latter part of directional solidification at 97 and 115 min respectively; (c-e) the remelting process of a protrusion in front of S/L interface; (f) a quenched planar interface of Al-Cu alloy; (g) range of temperature gradient corresponding to planar growth stage.
In general, constitutional supercooling equation does not consider the perturbation occurs at the growing interface during crystal growth. But the perturbation always exists in practice. Solidification is a thermodynamic non-equilibrium process because of heat and mass transfer. Heat transfer results in supercooling and mass transfer results in enrichment (k0 < 1) or lacking (k0 > 1) of solute in front of interface. These factors might generate perturbation in front of the solid/liquid interface. In Mullins-Sekerka theoretical model, the morphology of S/L interface can be described as a sine waveform. When perturbation enhances with time, the amplitude of sine waveform increases accordingly. The morphology is supposed to be unstable and grains grow as dendritic structure. Otherwise, the morphology keeps stable and grains grow as a planar [2,[47], [48], [49]]. The mechanism of perturbation in front of the S/L interface can be predicted by Mullins-Sekerka stability dynamic equation [2,50]:
$S(\omega)=-T_{m}\Gamma\omega^{2}-\frac{1}{2}(g'+g)+$$mG_{C}\frac{\omega^{*}-(\frac{v}{D})}{\omega^{*}-(\frac{v}{D})(1-k_{0})}$ (2)
where S(ω) is the amplitude of perturbation, and the plus or minus of which determines the enhancement or degeneration of perturbation, ω is the frequency of perturbation, Tm is melting point, Γ is surface tension constant, g′ and g are temperature gradient of solid and liquid phase respectively, m is the slope of the liquidus line, k0 is the equilibrium distribution coefficient, GC is the concentration gradient of solute, v is the growth velocity, D is the diffusion coefficient of the solute in the melt. Three items in the right-hand side of equation represent the count of interfacial energy, temperature field and solute field, respectively. They are the main factors that affect the solidification process. This mechanism has verified to be existed in the transparent model material SCN-1.61 wt.%Salol by Wang [51].
3.1.5. D in-situ observation of solid/liquid interface morphology transition
Besides the 2D real time experiment with thin plate sample (~200 μm), 3D in-situ observation using cylindrical samples was also performed to investigate the similar interfacial transition process. The controlling of heaters and variation of temperature gradient are similar to that in 2D experiment.
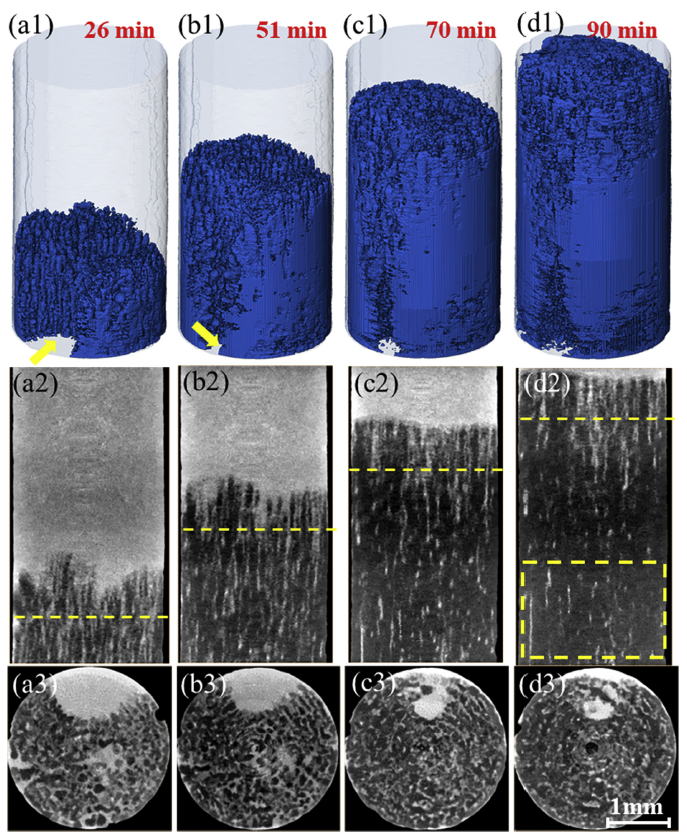
3D image reconstruction techniques, implemented in Avizo (ThermoFisher Scientific, USA) (application of an Non-local means filter, and global thresholding of the pore, solid, and liquid phases using the Otsu method [52]), were used to transform projections to 3D models and further improvement of quality. Suppl. 2 shows the overall process of 3D in-situ observation of morphological evolution at the designated thermal condition. Solid is shown in blue and the outline of original sample is shown as transparent bulk. As can be seen in Fig. 7, the solid phase grew directionally and filled in the observed area gradually. The microstructure and S/L interface morphology were found to change with increasing temperature gradient. Both 3D (Fig. 7(a1-d1)) and 2D (Fig. 7(a2-d2)) morphology of S/L interface as well as the transverse section (Fig. 7(a3-d3), ~1 mm below the S/L interface) of directional microstructure at four time points were selected to illustrate the process of transition. At the initial stage of directional solidification, S/L interface consists of thin dendritic structure. Individual dendrites can be easily distinguished from the 3D interfacial rendering (Fig. 7(a1)) and S/L interface macroscopical morphology looks irregular, as indicated by yellow arrow of Fig. 7(a1). An empty area without dendrite can be observed clearly. It is probably resulted from solute segregation during solidification. With the increasing of thermal gradient, thin dendrites became thick and merged gradually. Meanwhile, the dendrites array ranged more neatly in Fig. 7(b1) and the empty area shrunk as the arrow pointed, a more flat macroscopical interface was achieved. At the moment of ~70 min, we could hardly find any individual dendrites at the interface (Fig. 7(c1)), instead, consecutive and thick cellular crystal could be observed. The interfacial morphology also became smooth and flat. This trend is similar to what observed in 2D solidification process via thin plate samples. However, planar interface did not achieve during this process. The S/L interface kept to be cellular pattern, until the end of solidification, as shown in Fig. 7(d1). This is probably due to that the critical solidification condition for transition from cellular to planar growth was not achieved. This result suggests that the interfacial stability of 2D sheet-like samples and 3D cylindrical samples are different, since the thermal control during 2D and 3D experiments were similar. The difference of interfacial stability condition under these two cases might be related to the effect of spatial size or natural convection in liquid on interface stability.
Fig. 7. 3D in-situ observation of S/L interface morphology transition from dendritic to cellular during directional solidification: (a1-d1) 3D morphology of interface; (a2-d2) longitudinal section; (a3-d3) transverse section located at ~1 mm below the S/L interface (indicated with yellow dashed line in a2-d2) at 26, 51, 70, 90 min, respectively.
Coarsening process could also be observed in the solidified phase below S/L interface, leading to disappearance of inter-dendrites area, as shown in longitudinal sections. At the beginning of observation (Fig. 7(a2)), whole microstructures were dendritic pattern. However, at ~90 min, the inter-cellular areas could be observed clearly near the interface while the solid phase underneath was found to be more compact with less inter-cellular areas as shown in Fig. 7(d2), indicating that the previous dendrites in the yellow dashed area underwent a coarsening process and the solid fraction increased. Similar phenomenon was also observed in 2D radiographic experiment.
3.2.1. Growth velocity variation
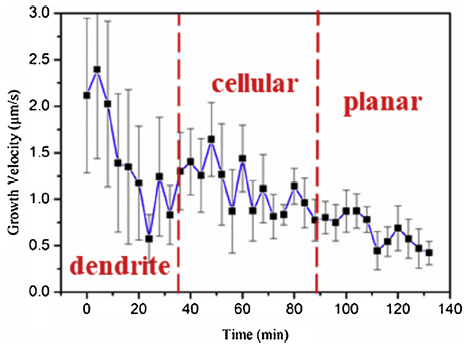
In order to quantitatively study the growth dynamic of grains during S/L interface morphology transition, the growth velocity of solid/liquid interface at different growth stages during 2D real time observation was measured based on the image series. The variation of S/L interface position with solidification time was recorded and then the growth velocity can be figured out. The variation of S/L interface growth velocity with solidification time was plotted in Fig. 8. As can be seen, the growth velocity decreases continuously as the S/L interface morphology transforms from dendritic to cellular and finally to planar. In addition, the growth velocity also shows different trends at three growth stages during directional solidification: (1) decelerating stage with gradual decrease and obvious oscillation during dendritic growth (0~36 min); (2) relatively stable growth stage with slighter oscillation during cellular growth (36~87 min); (3) more stable and slower growth stage with slightest oscillation during planar growth (from 87 min to the end).
Fig. 8. Evolution of the interface growth velocity with solidification time.
For dendritic growth, the S/L interface is irregular, consisting both dendrite tips and interdendrite areas. At this stage, the tip growth velocity is easy to fluctuate due to the competitive growth between neighboring dendrites. However, during the transformation from dendritic to cellular crystal, the growth of foremost tips was slowed down due to the increasing temperature gradient while the dendrites fall behind grew freely until a macroscopical smooth interface achieved (Fig. 3(c)). During the cellular to planar transition, oscillation was slighter due to the absence of dendritic structure on the interface. Therefore, in the corresponding diagram of velocity evolution, the solidification front advances wavily at the beginning, and decelerates while the solidification front is evolving from dendritic to cellular and then to planar. Chen et al. [44] found a similar velocity trend via in-situ radiographic observation of thin Al-4 wt.%Cu alloy.
3.2.2. Critical instability conditions
Eq. (1) is a basic model to predict S/L interface morphology under low growth velocity, thus it is suitable to apply this model to current experimental condition. To find a theoretical value based on this equation, several parameters of physical properties: m, k0 and DL are required. Slope of the liquidus line: m and the equilibrium distribution coefficient: k0 could be obtained directly from measurement or calculation based on Al-Zn binary phase diagram. The diffusion coefficient of the Zn in the liquid Al: DL is referred to the assessment of Du et al. [53] by means of the least-squares method and semi-empirical correlations. DL is usually described by the Arrhenius equation:
$D_{L}=D_{0}\exp(\frac{-Q}{RT})$ (3)
where D0 is diffusion constant, as the pre-exponential factor, Q is the activation energy, T denotes the absolute temperature and R is gas constant. DL is a temperature dependent variant which depends on temperature. D0 and Q can be found from reference [53]. So we substituted the liquidus temperature (T) of Al-30 wt.%Zn into Eq. (3) and the DL near the S/L interface was obtained. In conclusion, all needed parameters of physical properties of Al-30 wt.%Zn are listed in Table1.
Table 1 Values of physical properties of Al-30%Zn used in the numerical calculations.
| Parameter | Value |
|---|---|
| Liquidus slope, m/K | 353.16 |
| Equilibrium distribution coefficient, k0 | 0.41 |
| Diffusion coefficient, DL/(m2/s) | 2.49 × 10⁻⁹ |
Using Eq. (1) and values in Table 1, we could get a theoretical critical value of G/v, and the number is calculated to be ~306. This value can be interpreted as the coefficient of difficulty of maintaining S/L interface stability. Namely, larger value of G/v means it’s more difficult to keep planar interface. Theoretically, planar growth should occur only if the practical G/v is larger than 306 for Al-30 wt.%Zn alloy in this study. The experimental critical value of 2D observation was calculated to be ~157, namely, dendritic/cellular growth are supposed to form under current temperature gradient and growth velocity based on the constitutional supercooling theory prediction. However, planar interface was achieved based on in-situ observation on 2D thin plate sample when the temperature gradient is ~110 K/cm and growth velocity is ~0.7 μm/s. Note that 2D sheet-like sample is usually used as physical model to investigate the interface transition, however, the realistic crystals or dendrites possess complex stereo structure in 3D. Therefore, cellular or dendritic growth is probably to be blocked in one direction during 2D solidification. Using phase-field crystal (PFC) model simulation in 2D and 3D, Tóth et al. [54] suggested that the nucleation shape, nucleation barrier and critical size are different in 2D and 3D, indicating that the situation solid/liquid interface suffered in 2D and 3D might be different. Complex dendritic structure is more likely to form in 3D space than that in 2D due to the free growth. Therefore, the deviation between 2D experimental results and theoretic prediction might result from these factors.
In contrast, transition from cellular to planar has not been observed in 3D in-situ experiment under the same thermal condition (Fig. 7). The distinction between 2D sheet-like samples and 3D cylinder samples indicates that the S/L interfacial morphology stability under these two circumstances is different. This discrepancy may be resulted from the difference of liquid flow condition in 2D and 3D melt systems. It has been proved that liquid flow (convection) could significantly influence the solute distribution in front of S/L interface [55,56]. Several numerical studies have indicated the difference of liquid flow condition between two kinds of melt system [[57], [58], [59], [60]]. Yuan et al. [57] indicated the 2D flow is blocked by the primary dendrite arms, while the 3D flow can wrap around the primaries. This change in fluid flow strongly alters solute distribution and consequently the developing dendritic microstructure. The simulation results of Chen et al. [58] also suggested that side branches are easily induced in 3D dendrites when comparing with 2D morphologies, and this difference can be explained through the simulated flow condition and temperature fields. As suggested by Gong et al. [59] via 3D simulation, since the rejected solute can be quickly transported away from the S/L interface by liquid flow, the solute concentration at the liquid side of the S/L interface is lower, but its gradient is higher, and the thickness of the solute boundary layer is smaller, thus leading to a higher tip velocity and smaller tip radius. In these studies, dendrites are easier to develop in 3D space, implying lower S/L interfacial morphology stability. Our experimental results also indicate that 2D growth is easier to achieve planar interface than 3D growth.
Coarsening also affects microstructures during directional solidification. Since a relatively slow cooling rate was imposed during the directional solidification, the semi-solid phase near the S/L interface was supposed to have enough time to undergo a coarsening process at elevated temperature. It could be observed from both 2D and 3D in-situ experimental that the solid fraction under S/L interface was increasing. As shown in the yellow dashed area of Fig. 7(d2), there was few inter-cellular areas at about 5~6 mm below the S/L interface while the S/L interface was cellular growth. This indicates coarsening process can influence the final directional microstructure in some extent under low growth rate. S/L interfacial morphology cannot completely represent the directional microstructure. Similar phenomenon was also found by Chen et al. [61] in dendritic directional solidification of Al-Cu-Mn alloy where secondary arm spacing of dendrite tips and solid phase below the interface was different due to coarsening.
This study reports the radiographic and tomographic study of solid/liquid interface transition qualitatively and quantitatively during directional solidification within a time-depended temperature gradient. The following conclusions could be drawn from the present study:
(1) With the help of laboratory X-ray source and power down mode directional solidification, the transition process of dendritic to cellular and cellular to planar growth were captured. With the increase of temperature gradient, dendrites showed up first and then developed to smooth thick cellular crystal, inter-dendritic areas vanished completely and planar interface achieved finally, corresponding to the regularity predicted by Mullins-Sekerka morphological stability.
(2) Under the same thermal condition, planar growth S/L interface was achieved only in 2D in-situ experiment, instead of 3D in-situ observation. This result indicates that the S/L interfacial morphology stability in 2D space is higher than that in 3D space. The difference of liquid flow condition between these two melt systems was supposed to be responsible for it. The free flow in 3D melt is beneficial for dendrites growth.
(3) In-situ observation shows that planar growth does not indicate an absolute smooth S/L interface, comparing with the metallograph obtained by quenching. Protrusions might form and then be remelted in somewhere of the interface with the advancing of solidification.
This work is financially supported by National Natural Science Foundation of China (Grants 51690162, 51604171 and 51701112), Shanghai Municipal Science and Technology Commission (No.17JC1400602) and Shanghai Sailing Program (19YF1415900). We acknowledge Shanghai Synchrotron Radiation Facility (SSRF) for providing the beamtime and software and Dr. Guanyun Peng, Dr. Yanan Fu at BL13W beamline for their technical assistance.

 WeChat
/
| 〈 |
|
〉 |
