Search for articles:
Lei Liu , Xiaobo Chen
Corresponding authors:
Received: 2019-05-11
Revised: 2019-06-28
Accepted: 2019-07-1
Online: 2020-01-15
Copyright: 2020 Editorial board of Journal of Materials Science & Technology Copyright reserved, Editorial board of Journal of Materials Science & Technology
More
Abstract
Anodic oxidation is a prevalent technique to introduce superior corrosion and wear resistance upon the surface of titanium (Ti) alloys, in which the selection of appropriate electrolytes and defect-sealing strategies is a key. This study aims to address such issues through anodizing Ti-10V-2Fe-3Al alloy in malic acid, followed by a post-sealing treatment with Mg-Al layered double hydroxides (LDHs). The characteristics of the samples were investigated using scanning electron microscopy (SEM), atomic force microscopy (AFM), glow discharge optical emission spectroscopy (GDOES), X-ray diffraction (XRD) and energy-dispersive X-ray spectroscopy (EDS). SEM micrographs reveals that the anodic coating had a surface full of bulges and cracks, and was almost sealed by the following LDHs treatment. XRD pattern indicate that the anodic coating was mainly consisted of amorphous TiO2 with a small fraction of anatase, but its crystallization degree was increased through the post-sealing. Moreover, electrochemical and tribological measurements demonstrate that corrosion current density was 2.8 × 10⁻⁶, 2.0 × 10⁻⁷, 5.9 × 10⁻⁹ A cm-2, and wear rate was 1.45 × 10⁻³, 1.30 × 10⁻⁴ and 6.90 × 10⁻⁵ mm3 N-1 m-1 for respective bare Ti-10V-2Fe-3Al alloy substrate, anodized specimens without and with the LDHs post treatment. Finally, a plausible wear mechanism was proposed.
Keywords:
Titanium (Ti) alloys have become the workhorse of aerospace applications owing to their excellent mechanical properties and satisfactory corrosion resistance [[1],[2]]. Ti-10V-2Fe-3Al alloy is a metastable β alloy and exhibits a good combination of high strength and fracture toughness [3]. It has been used to fabricate the landing gear structure in aircrafts of Boeing 777 and Airbus 350 [4]. However, some technical issues remain unsolved. The high passivity of Ti alloys in many critical conditions should be attributed to the native oxide coating on their surface [5]. The extreme thin nature of such an oxide coating (ca. 1.5-10 nm), however, could be readily destroyed by various chemical, physical or mechanical reasons, and thus leads to crevice and galvanic corrosion [[6],[7]]. On the other hand, Ti alloys have a trademark of poor wear resistance [[8],[9]]. Existing research has been cast on the exploration of feasible techniques to significantly improve both their corrosion and wear resistance, which is anticipated to further increase the global market share of Ti alloys [[10], [11], [12]].
As a valve-metal, surface of Ti alloys has been often anodized in an aqueous electrolyte to enhance the resistance to corrosion and wear through formation of a ceramic-like oxide coating [[13],[14]]. In addition, anodization is a low cost and simple operation that is beneficial to upscale production [[15], [16], [17], [18]]. The chemistry of anodizing electrolyte, chemical composition of Ti substrate and power supply parameters (such as frequency, duty cycle, and electric current density) are key attributes to the formation of anodic coatings upon Ti alloys [[19], [20], [21], [22], [23], [24], [25]]. Of these parameters, the chemistry of anodizing electrolyte plays a crucial role in regulating the morphology, crystalline structure, chemical composition and the properties of the resulting anodic coating. For example, Song et al. [20] produced anodic coating on commercially pure Ti using three acid electrolytes, 1 M H2SO4, 1 M H3PO4 and 1 M CH3COOH, and found that a TiP2O7 coating was mainly observed on the sample anodized in the phosphoric acid electrolyte. However, TiO2 coatings were observed on the samples anodized in the acetic acid and sulfuric acid electrolytes. A comparison was also made by Wu et al. [21] between the anodic coatings fabricated in acid and neutral electrolytes on Ti alloy. The differences of this two anodic coating were displayed in the morphology, structure and electrochemical impedance.
In order to further optimize anodic coatings, a great volume of efforts have been devoted to the exploration of new anodizing electrolyte. Sul et al. [19] investigated the electrochemical oxide growth behavior on Ti in acid and alkaline electrolytes. They concluded that alkaline electrolytes such as calcium hydroxide and sodium hydroxide are not favorable to the formation of anodic coating. In contrast, acid and neutral electrolytes are more beneficial to accelerate the formation of anodic coating. However, strong acids and fluoride ions that were widely used in traditional anodizing electrolytes are notorious hazards to the environment and health of operators [[19],[20],[26],[27]]. As such, it is a great obligation and urgent need to seek an environmentally-benign approach to yield high quality anodic coatings on the surface of Ti alloys.
In addition, physical defects are indispensable in anodic coatings formed on Ti alloys. Such defect structures, such as deep cracks and interconnected pores, exhibit a high specific surface area, which provides a ready channel to aggressive substances to permeate the anodic coating and approach the underlying Ti substrate. As a result, it is essential to get rid of the inherent defects from anodic coatings through simple and efficient post-sealing treatments for sustainable protection. Acetate sealing was developed to provide an excellent sealing quality for anodic coating on aluminum alloys [[28], [29], [30]]. For anodized Mg alloys, a number of sealing methods were proposed, including cerium- and phosphate-based sealing [[31],[32]], sol-gel sealing [[33],[34]] and so on. Our previous papers have studied the effect of sealing anodic coating on Ti alloys in boiling deionized water and calcium acetate solution [[35],[36]]. Recently, applications of LDHs as post-sealing treatment to protect Al and Mg alloys draw increasing attention. For example, Kuznetsov et al. [37] reported LDHs-based sealing post-treatment for active protection of anodized Al alloys. The influence of pH and reaction temperature on the growth behavior of LDHs was studied by our group, and a LDHs-based sealing method also was developed for anodized Mg alloys [[38], [39], [40]]. But the use of LDHs to seal anodized Ti alloys remains unexplored.
This article stands out of existing research body in two aspects. Firstly, malic acid was explored as near neutral and green electrolyte for the first time to grow anodic coatings on Ti-10V-2Fe-3Al alloy. According to the available literature, the number of publications on this topic is negligibly small. Secondly, the as-received anodic coating was effectively sealed through co-precipitating LDHs in a Teflon-lined autoclave at 125 °C for 24 h. Most of the LDHs studies paid much attention to its properties of self-healing [41], biocompatible [42], self-cleaning and anti-corrosion [[43], [44], [45]], whereas relatively neglected the friction and wear performance. The effects of malic acid anodizing and LDHs post-sealing treatments on coating evolution, corrosion and wear resistance of Ti-10V-2Fe-3Al alloy were investigated. The sound wear mechanisms were postulated.
Ti-10V-2Fe-3Al alloy was used as the substrate, with following nominal composition (wt%): V 9.0-11.0, Al 2.6-3.4, Fe 1.6-2.2, O ≤ 0.13, C ≤ 0.05, N ≤ 0.05, H ≤ 0.0125 and balance Ti. Samples with dimensions of 10 mm × 10 mm × 3 mm and 20 mm × 20 mm × 3 mm were ground successively with silicon carbide papers up to a 2000 grit surface finish, followed by cleaning in ethanol ultrasonically, degreasing in alkaline solution (40 g/L NaOH, 25 g/L Na2SiO3, 25 g/L Na2CO3 and 40 g/L Na3PO4), rinsing in deionized water, and drying in air. All reagents were analytically pure and were used without further purification. Deionized water was used as solvent.
Anodizing process was performed in 15 g/L malic acid electrolyte. Details of the experimental parameters are given in Table 1. The anodic oxidation used a pulse galvanostatic power supply (PGPS, WMY-IV, 708th research institute of Astronautics, China). The temperature of electrolyte was maintained around 25 °C by using a thermostatic water bath and magnetic stirring during the entire process. A stainless steel plate and a sample were used as cathode and anode, respectively. After anodizing, Ti samples were rinsed with deionized water, dried under air conditions and used for following LDHs post-sealing treatments.
Table 1 Parameters of anodizing process.
| Parameter | Value |
|---|---|
| Frequency (Hz) | 1.3 |
| Duty cycle (%) | 20 |
| Current density (A dm-2) | 8 |
| Anodizing time length (h) | 1 |
| Temperature (°C) | 25 ± 3 |
| Surface area ratio of cathode to anode | 4:1 |
LDHs post-sealing: Mg(NO3)2·6H2O (0.06 mol) and Al(NO3)3·9H2O (0.02 mol) were dissolved in deionized water (100 ml). Then, under vigorous stirring, the pH of the solution was adjusted up to 10.7 by dropwise addition of NaOH solution. The mixed solution was transferred into a Teflon-lined autoclave along with an anodized sample. The Teflon-lined autoclaves were then hermetically heated at 125 °C for 24 h. The sealed samples were removed from the autoclaves after naturally cooling to room temperature, and ultrasonically cleaned in ethanol and dried under an air flow. Hereafter, bare Ti-10V-2Fe-3Al alloy substrate, anodized specimens before and after sealing were denoted as T, TA and TAS, respectively. Fig. 1 shows a schematic illustration of the key steps for anodizing and sealing processes.
Fig. 1. Schematic illustration of the technical procedures for fabricating anodic coating and post-sealing treatment.
The surface and cross-sectional morphology, composition and roughness of the samples were examined by using field-emission scanning electron microscopy (FE-SEM, JSM-7800 F, JEOL, Japan) equipped with energy dispersive spectroscopy (EDS, INCA Energy 350, Oxford, UK), and atomic force microscopy (AFM, MFP-3D-BIO, Oxford, USA). Crystallographic structure was characterized by X-ray diffraction (XRD, D/Max 2500X, Rigaku, Japan), using a CuKα source at 40 kV/150 mA. Each sample was scanned at 2θ from 10° to 80° at a glancing angle of 1.5°. Glow discharge optical emission spectroscopy (GDOES, GD Profile 2, Horiba Scientific, Japan) depth profiles were recorded at a pressure of 700 Pa and 40 W with a Cu anode disc with 4 mm in diameter.
The electrochemical characteristics of the samples were assessed by performing potentiodynamic polarization curves and electrochemical impedance spectra (EIS) in 3.5 wt% NaCl solution at room temperature with a typical three-electrode system. These can be obtained using electrochemical workstation (Parstat 4000A, Princeton Applied Research, USA). The samples of interest served as working electrode (1 cm2) with a platinum foil as counter electrode and a saturated calomel electrode as reference electrode. Samples were exposed to NaCl solution at free corrosion potential for 30 min before the electrochemical tests. Polarization curves were obtained by automatically changing the electrode potential from -0.7 V in the cathodic direction to 1.2 V in the anodic direction with reference to the open circuit potential at a sweep rate of 5 mV s-1. EIS measurements were acquired from 10 mHz down to 100 kHz using a 10 mV rms sinusoidal perturbation.
Tribological tests were conducted on a ball-on-disc rotating wear tester (HT-2001, POD-1, Zhejiang Huijin-teer Coatings, China) for 30 min using a normal load of 2 N, a rotation radius of 4 mm, a rotating velocity of 100 rpm at ambient conditions. A Si3N4 ceramic ball with a diameter of 5 mm and surface roughness of about 0.01 μm was used as a counterpart. Friction coefficient was continuously recorded as a function of sliding time during the tests. After the experiments, the worn surface morphology of each sample was examined using SEM, and the chemical composition of the worn tracks was investigated using EDS. The morphology and depth profiles of the wear tracks were measured using a surface profilometer (Dektak 150, Veeco, USA). The specific wear rate of the samples was calculated from:
$w=\frac{V}{FL}$ (1)
where ω is the wear rate, V is the wear volume, F is the load, and L the is sliding distance.
Representative SEM micrographs of T specimens indicate that the surface of as-ground Ti specimen was flat without obvious topographic features (Fig. 2(a) and (b)). The anodizing treatment, however, changed the surface morphology significantly. The anodic coating had a surface full of bulges and cracks (TA, Fig. 2(c) and (d)). It was only a few pores that can be found on the anodic coating. This is greatly different from that formed in a strong acid or alkaline electrolyte [[19],[20]], in which round pores were the characteristics of the anodic coatings obtained from strong acid and alkaline electrolytes. Asquith et al. [46] proposed that there was a tensile region at the interface of substrate and oxide coatings, and tensile residual stress field could facilitate the formation of cracks. The presence of cracks on the anodic coating upon Ti alloy specimens was probably caused by the tensile residual stress field. EDS analysis shows that Ti and oxygen were the two major elements at spot 2 on TA case, and their atomic ratio was close to 1:2, which indicates that the main component of this area was TiO2.
Fig. 2. SEM surface micrographs and EDS analysis of (a, b) T, (c, d) TA and (e, f) TAS.
The surface of TA was covered by a fine and compact lamellar structure after LDHs post-treatment (TAS, Fig. 2(e) and (f)). Such a similar morphology of LDHs coatings has been well recognized in literature [[47],[48]]. LDHs crystallites were obviously curl and blade-like features, which were attributed to the combination of metal hydroxide and inlayer ions [49]. In addition, Mg as the typical element of LDHs was detected by EDS. It is evident that a large number of cracks was sealed with LDHs nanosheets.
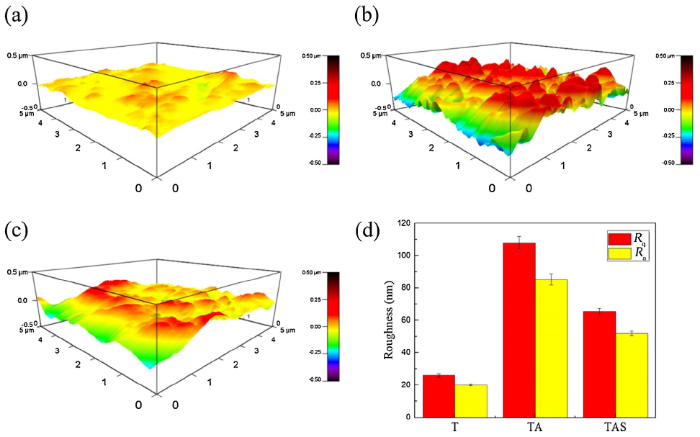
Three-dimensional AFM images of the samples (Fig. 3) depict that the surface of T was smooth with minimal roughness (Fig. 3(a)), and the appearance and roughness of the surface, such as the obvious structure of the bulges formed on anodic coating (TA, Fig. 3(b)). The root mean square roughness (Rq) and average roughness (Ra) derived from the AFM analysis are also given in Fig. 3(d). The values of Rq and Ra indicated that the TA was the roughest, given the presence of bulges and cracks. However, the post-sealing treatment of LDHs reduced the roughness of the anodic coating by sealing the microstructural defects. It effectively leveled the loose and cracked anodic coating by depositing a LDHs layer. It is evident that the LDHs coating played as a sealant with respect to the defects in the as-prepared anodic coating. These results were consistent with the SEM results (Fig. 2).
Fig. 3. AFM measurements of (a) T, (b) TA, (c) TAS and (d) surface roughness.
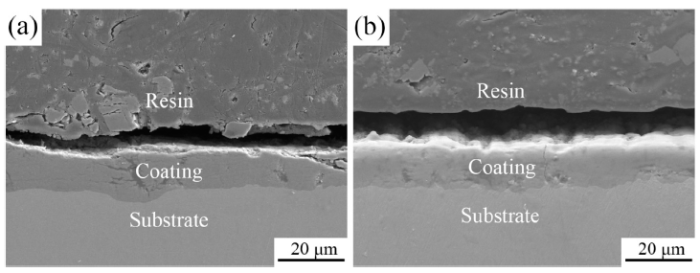
Fig. 4 presents the cross-sectional SEM images of the TA and TAS. As depicted in Fig. 4a, the average thickness of the anodic coating was about 12 μm. After deposition of LDHs on the TA (Fig. 4(b)), the thickness of coating increased to 14 μm.
Fig. 4. Cross-sectional SEM micrographs of (a) TA and (b) TAS.
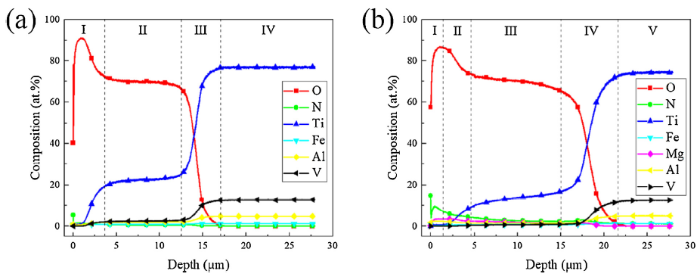
The GDOES depth profiles for the TA and TAS are shown in Fig. 5. The signal of nitrogen was high in the beginning. It can be attributed to the contamination in the surface of the coatings. There are typical four regions in the depth profiles in Fig. 5a. For the TA, they corresponded to (I) porous or cracked structure of anodic coating sputtering, (II) sputtering anodic coating, (III) sputtering transition from the anodic coating to the substrate, and (IV) the Ti alloy substrate sputtering. The signals between anodized layer and substrate was not sharp, which may be caused by the increasing roughness of the substrate after anodizing. In contrast, the curves of the TAS can be divided into five regions. As depicted in Fig. 5(b), magnesium profile displayed an obvious plateau in zone I, and then decreased gradually. The signal of magnesium mainly enriched in zones I and II, indicating the presence of LDHs in these two zones. Stated thus, zones I and II were assigned to LDHs coating sputtering and sputtering transition from the LDHs coating to the anodic coating, respectively. That was to say the thickness of the LDHs coating fabricated in this experiment was about 1.3 μm. This result also confirmed the seal effect of LDHs to the anodic coating. Changing of the signals for TAS in zones III, IV and V were similar to that of the zones II, III and IV in TA, so they respectively corresponded to sputtering anodic coating, transition from the anodic coating to the substrate and Ti alloy substrate. Except for the zone III in TA and the zone IV in TAS, the thicknesses of the TA and TAS coatings obtained by GDOES analysis were about 12.5 and 15 μm which was in general in agreement with the cross-section measurements.
Fig. 5. GDOES depth profiles of (a) TA and (b) TAS.
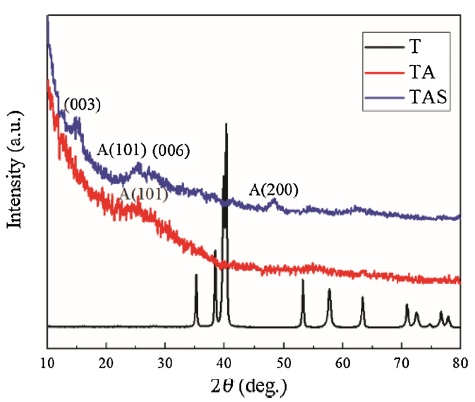
XRD patterns was recorded to further investigate the structural properties of the different samples. As shown in Fig. 6, the XRD pattern of the T displayed obvious characteristic diffraction peaks of Ti alloy. The substrate diffraction peaks for the TA and TAS were not found due to the formation of anodic and LDHs coatings [50]. Moreover, the anodic coating was so thick that the signal of the substrate cannot be detected. The TA only had a characteristic peak at 25° attributed to the anatase. This is a broad diffuse peak, suggesting a typical amorphous structure [[51],[52]]. So the anodic coating contained mainly amorphous TiO2 with little anatase. As for the TAS, the curve exhibited the typical peaks corresponding to the (003) and (006) reflections of the LDHs phase [53]. The XRD pattern also confirmed the formation of the LDHs. Besides, the TiO2 diffraction peaks were not weakened by the covered LDHs layer, instead, the TAS showed a new small peak at 48° attributed to anatase. The LDHs was synthesized by hydrothermal method on anodic coating in a Teflon-lined autoclave. The small container can reach a high temperature and pressure in the experiment. Thus, a little amorphous TiO2 was converted to anatase TiO2. The peak of rutile did not appear in the XRD pattern, so the high temperature and pressure was not enough to form rutile. The above factors indicate that the anodic coating before and after sealed by LDHs was mainly amorphous TiO2 with little anatase, but the degree of crystallization was increased after sealing.
Fig. 6. XRD patterns of T, TA and TAS.
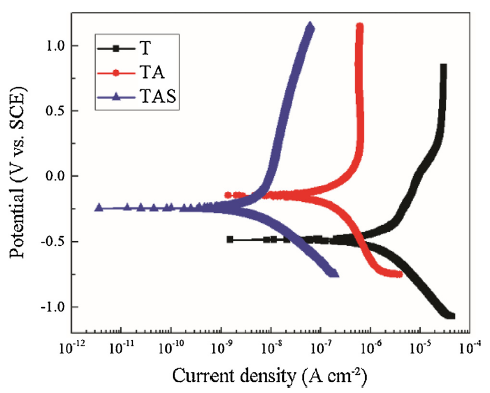
Potentiodynamic polarization curves were applied to investigate the corrosion resistance of the T, TA and TAS in 3.5 wt% NaCl solution at room temperature (Fig. 7). The corresponding electrochemical parameters, including corrosion potential (Ecorr), corrosion current density (icorr), anodic Tafel slope (βa) and cathodic Tafel slope (βc) are summarized in Table 2. it is apparent that the order of Ecorr of the samples was T < TAS < TA, but the order of icorr was ranked as TAS < TA < T. Ecorr mainly describes the thermodynamic property of the samples (i.e. tendency to corrosion), whilst kinetic corrosion resistance is evaluated through icorr value other than Ecorr [54]. It is well recognized that a small value of icorr correlates to high kinetic resistance to corrosion. As-ground Ti alloy sample, i.e. T, exhibited the highest icorr, while icorr of TA decreased by one order of magnitude from that of T. After sealing, icorr of TAS decreased significantly to 0.2% of T or 3% of TA. Thus, the anti-corrosion performance was remarkably improved by fabricating anodic coating and further enhanced by co-precipitating LDHs.
Fig. 7. Potentiodynamic polarization curves measured in 3.5 wt.% NaCl solution of T, TA and TAS.
Table 2 Corrosion potential (Ecorr) and corrosion current density (icorr) of all samples.
| Sample | Ecorr (V vs. SCE) | icorr (A cm-2) | Tafel slope (mV dec-1) | |
|---|---|---|---|---|
| βa | βc | |||
| T | -0.484 | 2.8 × 10⁻⁶ | 663 | -631 |
| TA | -0.147 | 2.0 × 10⁻⁷ | 491 | -558 |
| TAS | -0.243 | 5.9 × 10⁻⁹ | 909 | -304 |
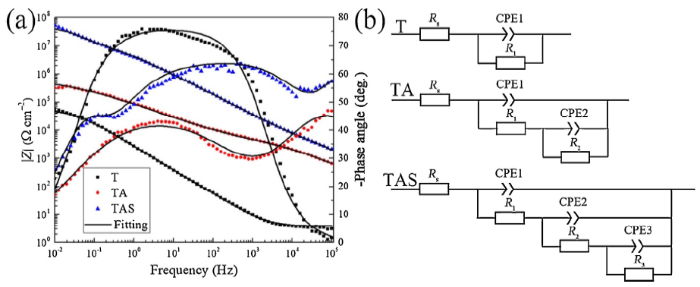
The Bode plots for the different samples are presented in Fig. 8(a). It can be observed from the frequency-phase angle diagram that the T, TA and TAS had one, two and three constants, respectively. It can be explained that the native oxide coating had formed on the surface of the titanium alloy substrate for the T. The anodic coating on the TA can be divided into the outer porous layer and the inner compact layer. As for the TAS, the whole coating was consisted of the anodic coating, the middle LDHs/TiO2 composite coating, and the LDHs coating. Generally speaking, a higher frequency corresponds to the outer layer, and the lower frequency corresponds to the inner layer. The |Z| value in the frequency-impedance diagram gradually increased with decreasing frequency. The material with a higher |Z| value at 10 mHz exhibit better corrosion resistance of the entire substrate and the coating [55]. Thus, the TAS possessed best corrosion resistance, which was consistent with the result in the Potentiodynamic polarization curves.
Fig. 8. (a) Bode diagrams and (b) equivalent circuit of T, TA and TAS.
Fig. 8(b) is the equivalent circuit of the T, TA and TAS, and the fitting results are shown in Table 3. Due to nonuniformity of surface and diffusion factors, a constant phase element (CPE) was introduced to replace the pure capacitance C for improving simulation of the impedance. The relationship between CPE and capacitance is CPE = 1/C((jω)n). In general, if n = 0, the CPE is equivalent of resistance and if n = 1, the CPE is equivalent of capacitor. As shown in Fig. 8(b), Rs presents the resistance of solution. CPE1 and R1 correspond to the capacitance and resistance of the native oxide coating of T, the outer porous anodic coating of TA, and the LDHs coating of TAS, respectively. CPE2 and R2 correspond to the capacitance and resistance of the inner compact anodic coating of TA, and the LDHs/TiO2 composite coating of TAS, respectively. CPE3 and R3 correspond to the capacitance and resistance of the anodic coating of TAS, respectively. According to the fitting results in Table 3, it can be seen that TAS has a low capacitance (CPE1, CPE2 and CPE3) and a high resistance (R2 and R3), compared with T and TA. Hence, these results indicated that the corrosion resistance of anodic sample was improved effectively by LDHs sealing.
Table 3 Corresponding main fitted parameters of all samples.
| Sample | Rs (Ω cm2) | CPE1 | R1 (Ω cm2) | CPE2 | R2 (Ω cm2) | CPE3 | R3 (Ω cm2) | χ2 | |||
|---|---|---|---|---|---|---|---|---|---|---|---|
| Q1 (S sn cm-2) | n1 | Q2 (S sn cm-2) | n2 | Q3 (S sn cm-2) | n3 | ||||||
| T | 4 | 7.60 × 10⁻⁵ | 0.84 | 5.54 × 10⁴ | - | - | - | - | - | - | 8.15 × 10⁻³ |
| TA | 118 | 2.28 × 10⁻⁷ | 0.66 | 4.20 × 10³ | 3.95 × 10⁻⁶ | 0.51 | 6.36 × 10⁵ | - | - | - | 5.85 × 10⁻³ |
| TAS | 405 | 7.04 × 10⁻¹⁰ | 1 | 3.75 × 10³ | 5.37 × 10⁻⁸ | 0.70 | 1.61 × 10⁷ | 9.43 × 10⁻⁸ | 0.89 | 3.20 × 10⁷ | 8.46 × 10⁻³ |
Yao et al. [56] proposed that the corrosion resistance was related to the thickness, compactness and phase/chemical composition of the coating. The TA was a thick anodic coating and contained stable TiO2, and thus can represent an excellent corrosion barrier. But anodic coating was consisted of inner compact layer and outer loose layer. The loose and cracked outer anodic coating cannot act as effective corrosion barrier without sealing. So as for the TAS, there was no doubt that the LDHs coating can increase the thickness of protective coating. And post-sealing treatment turned the outer loose anodic coating into a compact structure which is beneficial to corrosion resistance. Moreover, it is worth mentioning that LDHs, as a new composition, possesses characteristics of anion-exchange [[57],[58]]. Chloride anions from NaCl solution can be captured and stored in the interlayers of LDHs, as such, corrosion resistance can be further enhanced. In summary, LDHs-reinforced anodic coating upon the surface Ti alloy can enhance thickness of protective coating and sealing the cracks and pores in anodic coating, and store and release inhibitor on demand as a function of anion-exchange between inhibiting species and corrosion-relevant anions.
Except for corrosion performance, the poor friction and wear resistance still remain one of the greatest challenges in the industrial application of Ti alloy. The morphologies and EDS analysis of the wear tracks for the T, TA and TAS are shown in Fig. 9. The T had the widest wear track. A lot of damage debris had detached in Fig. 9a, implying that the wear of the T was mainly abrasive wear. Based on Fig. 9(b) and 9(c), both of the TA and TAS revealed extensive cracking and delamination. Because the coatings were fractured when they slid against the ceramic ball. However, there was a clear difference. The sheet layers of the TA were large but few, whereas the TAS revealed a lot of small flakes. According the EDS analysis results, the T was oxidized slightly after tribological test (Fig. 9(a)). For spot 2 in Fig. 9(b), the atomic ratio of Ti and O was close to 1:2, which indicated that this point was on the anodic coating. In the case of the TAS, Mg element was also detected after tribological test (Fig. 9(c)). Based on the GDOES analysis (Fig. 5(b)), this point in Fig. 9(c) corresponded to the transition region from the LDHs coating to the anodic coating, namely the LDHs/TiO2 composite coating. The Si in the wear track was attributed to the Si3N4 ceramic ball.
Fig. 9. SEM images and corresponding EDS analysis of the wear tracks of (a) T, (b) TA and (c) TAS.
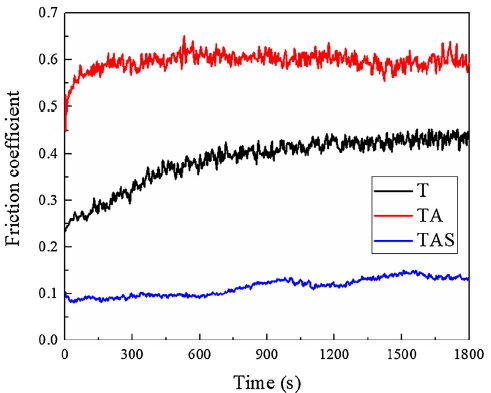
The relationship between testing time and friction coefficient is presented in Fig. 10. The friction coefficient of the T was initially increased to about 0.4 at the time of 400 s, and then remained unchanged. The slow increase stage of friction coefficient for the T should correspond to the gradual formation of damage debris. The coefficient of friction was 0.6 for the TA. The friction coefficient for the TAS was in the range 0.09 - 0.1 up to 750 s, and in the range 0.11 - 0.14 during the following friction process. The anodic coating had been sealed by LDHs. The value rose to the range 0.11 - 0.14 when the ball contacted the LDHs/TiO2 composite coating. As shown in Fig. 9(c), a relatively dense flat area was formed on the wear track compared with that of TA (Fig. 9(b)). It can be implied that a lubricating layer was formed on the worn surface of the TAS during the wear process. Generally, the friction coefficient of the same substance should stabilize at a steady level. Therefore, the anodic coating on TA was not worn through, and the friction coefficient was 0.4, 0.6 and 0.1 respectively for the Ti alloy substrate, the anodic coating and the LDHs coating. It was the different proportion of LDHs and TiO2 that caused the changed friction coefficient of the LDHs/TiO2 composite coating.
Fig. 10. Friction coefficient of T, TA and TAS.
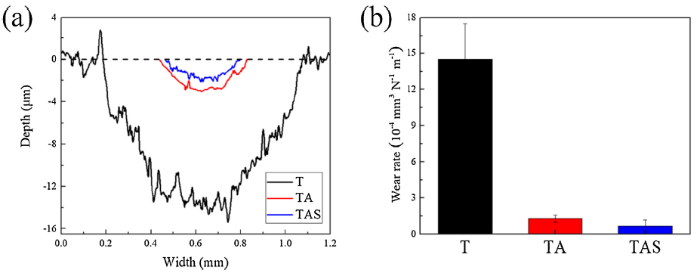
Typical line profiles of the cross sectional of the wear tracks of different samples are presented in Fig. 11(a). According to Fig. 4, Fig. 11(a), the depth of wear tracks for the TA (about 3 μm) was less than the thickness of anodic coating (about 12 μm). The results also showed that the anodic coating was not worn through during the test. Furthermore, the specific wear rate of the samples can be calculated according to these measurable (the cross sectional areas of the wear tracks) and known parameters. Consequently, the wear rates of the T, TA and TAS were 1.45 × 10⁻³, 1.30 × 10⁻⁴ and 6.90 × 10⁻⁵ mm3 N-1 m-1, respectively. The wear rates of the TA and TAS were decreased by an order of magnitude, compared with that of the T. So the wear resistance of the TA and TAS were better than that of the T. In addition, the results indicated a better wear resistance of the TAS than that of the TA. That is to say that the Ti alloy showed poor wear resistance without a protective surface coating, and both the anodic and LDHs coatings could enhance the wear resistance of the substrate.
Fig. 11. Cross sectional view of the (a) wear tracks and (b) wear rates of T, TA and TAS.
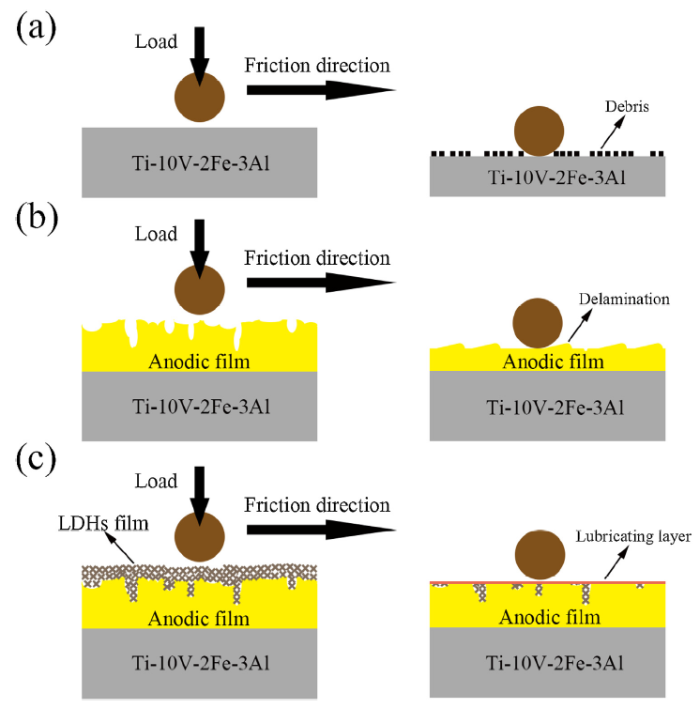
The surface characteristics of these samples can be obtained from the study of SEM (Fig. 2) and AFM (Fig. 3). The thickness of the coatings was determined from the cross-section SEM images (Fig. 4). Their wear resistance was exposed by the tribological tests. Thus, Fig. 12 displays the wear process of the T, TA and TAS. For T, it is obvious that abrasive wear is the main mode based on the morphology of wear track. The debris acting as abrasive particles caused the aggravated wear, which led to higher wear rate of T than the other samples. TA was covered with a thick anodic coating. The wear track of such anodic coating revealed a delamination structure. The anodic coating was not worn through during tribological tests and yielded a low wear rate, indicating high wear resistance.
Fig. 12. Diagrammatic illustration of the wear tests for (a) T, (b) TA and (c) TAS.
The wear process for the TAS were divided into two stages based on the variation friction coefficient. The first stage is wear of the LDHs coating, corresponding to the range 0.09 - 0.1 of the friction coefficient. The second stage is wear of the LDHs/TiO2 composite coating. LDHs nanosheets in the anodic coating played as lubricant and thus decreased friction coefficient significantly. According to SEM and EDS examination of the wear tracks, a lubricative layer was formed on the worn surface of the LDHs/TiO2 composite coating. The lubricating mechanism of LDHs nanosheets is postulated as follows: in wearing process (after worn through the LDHs coating), the counterpart was rubbing against the LDHs/TiO2 composite coating, and led to extrusion force and high temperature. Then deformed LDHs nanosheets subsequently were bonded with wear debris to make a lubricating layer between the contact areas. Nevertheless, the lubricative layer was fading away continuously because the LDHs nanosheets that were stored in the cracks and pores moved to the top surface to as supplement to rebuild a lubricating layer continuously during wear test. So LDHs nanosheets as a solid lubricant were smeared to form a lubricating layer on the surface due to plastic deformation. As such, wear resistance of TAS sample was promoted by the wear-resistant LDHs coating and the synergistic effect of LDHs nanosheets and anodic coating.
In the article, anodic coating was produced on Ti-10V-2Fe-3Al alloy in novel malic acid electrolyte, and subsequently sealed by LDHs through co-precipitation method. It can be concluded that LDHs-reinforced anodic coatings provide an intensive barrier effect to retard the corrosion kinetics and markedly improves the anti-wear performance of Ti-10V-2Fe-3Al alloy. The key conclusions are drawn as follows:
(1)The anodic coating on Ti alloy obtained in malic acid electrolyte had a surface of bulges, cracks and pores, which was different to the porous coatings formed by anodization in strong acid and alkaline electrolytes. The loose and cracked structure of the anodic coating was successfully sealed by LDHs.
(2)The anodic coating before and after sealed by LDHs was mainly amorphous TiO2 with little anatase, but the degree of crystallization was increased after sealing.
(3)The anti-corrosion performance of Ti alloy was remarkably improved by anodic coating and further enhanced by LDHs sealing, which can efficiently block the penetration of chloride ion to the surface of Ti alloy substrate.
(4)The anodic and LDHs coatings had good friction and wear properties, and the LDHs nanosheets and anodic coating had synergistic effect with lubrication, causing the notably improvement of wear resistance of Ti alloy.
This work was supported financially by the National Natural Science Foundation of China (Nos. 51971040, 51701029 and 51531002), the National Key Research and Development Program of China (No. 2016YFB0301100), the Chongqing Research Program of Basic Research and Frontier Technology (No. cstc2016jcyjA0388), the China Postdoctoral Science Foundation Funded Project (Nos. 2017M620410 and 2018T110942), the Chongqing Postdoctoral Scientific Research Foundation (No. Xm2017010) and the Fundamental Research Funds for the Central Universities (No. 2018CDGFCL005).

 WeChat
/
| 〈 |
|
〉 |


