Search for articles:
Heng Chen
Corresponding authors:
Received: 2019-01-23
Revised: 2019-05-27
Accepted: 2019-06-24
Online: 2020-01-01
Copyright: 2020 Editorial board of Journal of Materials Science & Technology Copyright reserved, Editorial board of Journal of Materials Science & Technology
More
Abstract
Temper rolling, as a final manufacturing procedure, brings the change of surface features and hence affects the corrosion behaviors of interstitial-free (IF) steel. This study investigates changes in residual stress, microstructure, and surface topography of IF steel using X-ray diffraction, electron backscatter diffraction, and optical interferometric microscopy. And the synthetic influence of surface features on the corrosion process of the steel was evaluated by damp heat tests and electrochemical measurements. Results showed that low tensile and compressive residual stresses are introduced to the surface of the IF steel. Some grains had a grain orientation spread (GOS) value greater than 0.5° after temper rolling. Moreover, temper rolling caused a slight change in the surface profile of the IF steel. The compressive residual stress had an overwhelming role at the macroscopic level, in retarding the corrosion evolution process of IF steel, as well as in decreasing the average corrosion rate. And corrosion was more likely to initiate and propagate in matrices with a high GOS value, which played the determinant role at the microscopic level. Moreover, the depth of valley in the surface profile could affect the diffusion process involved in the electrode reactions, which was more likely to exert an extra influence on the corrosion rate of IF steel.
Keywords:
Interstitial-free (IF) steel is a type of ultralow carbon ferritic steel in which the content of interstitial elements (C and N) is strictly controlled [1]. As the steel matrix is nearly completely free of solute interstitials, IF steel provides a combination of deep drawability and non-aging behavior, and hence is widely used in the automobile industry [2,3]. In addition, IF steel is also in a high demand of surface qualities, which have significant effects on the corrosion process as well as the optical characteristics of car body painting [4,5]. Temper rolling (or skin pass rolling), is therefore usually used as the last manufacturing procedure of cold rolled IF steel, to eliminate surface defects and improve surface flatness by applying plastic deformation on the surface [6].
It is noteworthy that homogeneous deformations in the rolled sheets are hardly accessible during the temper rolling process and surface features would be affected consequently, such as the inhomogeneous distribution of residual stress and surface roughness [[7], [8], [9]].
A number of researchers have focused on the relationship between temper rolling and the resulting surface properties of rolled sheets [[10], [11], [12]]. Lin et al. found that axial residual stress would become compressive when the temper rolling reduction was less than 0.4% [10]. Kuang et al. reported that the increasing of temper rolling reduction would result in a higher solute carbon content and mobile dislocation density in the alloy matrix [11]. In addition, Xia et al. found that the surface roughness of steel strips depended on the last stand of cold rolling, while the peak count was mainly increased by the temper rolling [12]. Most of the above studies emphasize changes in surface features caused by temper rolling. However, few studies on the relationship between surface properties and the service performance of steels have been conducted. The same issue also goes for IF steel, the surface properties of which are highly sensitive to the temper rolling process [13,14].
Reports in the literature indicate that the heterogeneity of surface features is favorable to forming precursor sites for corrosion [15]. Surface stress state has been found to be the determinant of affecting the corrosion of alloys [16,17]. Tensile residual stress has been reported to enhance corrosion susceptibility due to the promotion of oxygen diffusion in the material, while compressive residual stress has opposite effect on corrosion [18,19]. Alloys with a high grain orientation spread (GOS) value are known to have high susceptibility to corrosion [[20], [21], [22]]. Moreover, Li et al. found that a rough surface is prone to corrosion since roughness can increase fluctuations of the local electron work function and promote the formation of microelectrodes on the material surface [23]. The above studies had put the focus only on one surface feature and its action on the corrosion behaviors. However, these factors coexisting in steels could not play their role solely in a service environment, which must be considered as a synthetic effect in different dimensions. And as previously mentioned, inhomogeneous deformations generated during the temper rolling process may change multiple surface features at the same time [24]. Therefore, it is of great meaning to investigate the corrosion behaviors of IF steel under the comprehensive effect of surface factors from different scales. Regretfully, the integrated influence of these factors on corrosion behaviors has received much less attention and remains poorly understood to date.
This study aims to explore the relationship between surface features and the corrosion behaviors of automobile IF steel. Surface features, including surface topography, stress status, and microstructure were characterized using X-ray diffraction (XRD), electron backscatter diffraction (EBSD), and optical interferometric microscopy. Potentiodynamic polarization measurements and damp heat tests were used to evaluate the corrosion behaviors of IF steel. The effect of surface features on the corrosion rate and corrosion evolution process of the steel were discussed at different scales, and the predominant features were deduced as well.
The IF steel sheet used in this study was manufactured by Bao Steel Co. Ltd. (China). The as-received alloy was produced using a process including continuous casting, hot rolling, cold rolling, annealing, and temper rolling. The chemical composition of the steel was C 0.002, Si 0.003, Mn 0.13, P 0.021, S 0.007, Ti 0.027, Nb 0.003, Al 0.036, and Fe balance (wt%). Four IF steel samples (referred to as TR-1, TR-2, TR-3, and TR-4) were cut from four different positions of the sheet along the rolling direction. Table 1 lists the rolling forces imposed on these samples during temper rolling. The four samples were further cut into dimensions of 10 mm × 10 mm × 1 mm and then ultrasonically rinsed in acetone for EBSD analysis and polarization curve measurement. Residual stress measurements and damp heat testing were performed on specially sectioned samples with dimensions of 80 mm × 60 mm × 1 mm.
Table 1 Temper rolling forces imposed on the samples.
| Sample | TR-1 | TR-2 | TR-3 | TR-4 |
|---|---|---|---|---|
| Rolling force (kN) | 230 | 237 | 242 | 146 |
Different surface topographies may be induced by heterogeneous deformation during temper rolling. Surface topographies were determined using a noncontact white-light interferometer (Zygo Nexview, Zygo Corp., USA). A 2.5× magnification microscope was selected, and the corresponding measured area was approximately 2.5 mm × 3.5 mm. The roughness parameters of the samples were also obtained as these parameters include rich information on the surface texture of the samples.
Rolling residual stresses on the surface of the samples were measured by using XRD on the {211} ferrite lattice plane along the rolling direction. Measurements were conducted using an X-ray stress analyzer (X-350A, Este Stress Technology Co. Ltd., China) with the sin2Ψ method, a scan step of 0.1°, and CrKα radiation at 20 kV and 5.0 mA. The instrument used a collimator with a diameter of 1 mm. The tilt angle of the {211} ferrite lattice plane (Ψ) was set to four values (0°, 24.2°, 35.3°, and 45.0°) for scattering angles (2θ) ranging from 151° to 162°. The residual stress determined was calculated as the arithmetic mean of the surface of material defined by the irradiated area.
The presence of residual stress or deformation in materials can cause changes in their microstructure, which can be detected using the EBSD technique. This technique was utilized in this work to obtain grain and misorientation information from the IF steel samples. For microstructure studies, the surface of the samples was wet-ground sequentially up to 2000 grit using sandpaper. The samples were then subjected to surface mechanical polishing (polished with 1.5 μm diamond paste) and electropolishing (20% perchloric acid solution under an applied potential of 20 V). Finally, the samples were cleaned in an ultrasonic bath. Kikuchi patterns were obtained using a scanning electron microscope (Quanta 250, FEI, USA) with a step size of 2 μm and a 70° tilt angle.
Steady-state damp heat tests were performed to investigate the corrosion evolution process of IF steel. All of the samples were placed into a temperature and humidity chamber (SH-242, ESPEC Corp., Japan) for 96 h under a temperature and relative humidity of 40 °C and 95%, respectively. Then, the number corrosion spot of each sample was counted after 2, 4, 8, 24, 48, 72, and 96 h. The Clark’s solution made of 500 ml deionized water, 500 mL 37% HCl and 3.5 g hexamethylenetetramine (C6H12N4), was prepared for the removal of corrosion products. Then the corrosion topographies were observed using a laser confocal scanning microscope (VK-X250, Keyence, Japan).
The average corrosion rates of the samples were evaluated based on their potentiodynamic polarization in 3.5 wt% NaCl solution using an electrochemical workstation (PARSTAT2273, Princeton Applied Research Inc., USA) at ambient temperature. A conventional three-electrode system with a platinum plate as the counter electrode, a saturated calomel electrode as the reference electrode, and a surface-untreated IF steel sample as the working electrode was used. Prior to potentiodynamic polarization measurement, the open circuit potential (OCP) was monitored for approximately 30 min. Applied potential was swept from -0.2 V to 0.3 V (vs. the OCP) at a scan rate of 0.5 mV/s, and the polarization was terminated when the current density reached 10-2 A/cm2. Finally, the applied potential versus the logarithm of the corresponding current density was plotted to obtain a polarization curve.
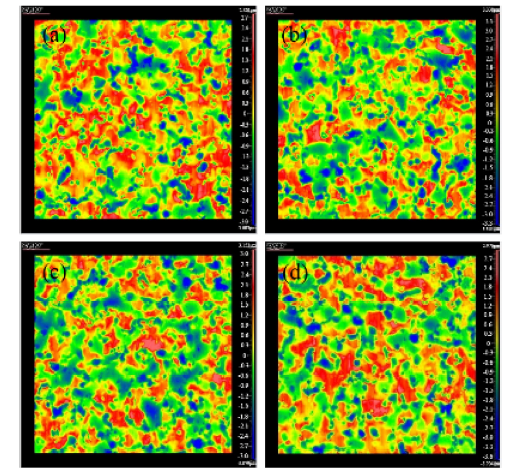
Surface topography can influence corrosion behaviors by affecting charge transfers or mass transport [23,25]. Thus, obtaining the surface information of IF steel is necessary. The surface topography of the four IF steel samples were detected, and Fig. 1 shows the resulting topographical maps. The images captured by the surface profiler show red peaks and the blue valleys uniformly distributed on the surfaces of the IF steel. Moreover, differences in surface topography among the four samples were minimal, although the irregular peak area on samples TR-1 and TR-4 seemed slightly larger than those of the two other samples. The minimal differences between topographies can be expected because IF steel must meet strict surface criteria after the temper rolling process [26].
Fig. 1. Topographical maps of IF steel samples: (a) TR-1; (b) TR-2; (c) TR-3; (d) TR-4.
Corresponding roughness parameters are presented in Table 2 to quantify the differences in surface topographies among the samples. Surface roughness average (Sa) and surface root mean square average roughness (Sq), which are calculated as the average and root mean square of surface roughness and usually related to the averages of the values measured over the surface [27]. Sp and Sv respectively represent the maximum peak height (Sp) and maximum valley depth (Sv) of the steel surface [28]. According to the roughness parameters Sa and Sq in Table 2, sample TR-1 had the smoothest surface while the surfaces of samples TR-2, TR-3 and TR-4 were rougher. In addition, the values of the maximum peaks (Sp) and valleys (Sv) of sample TR-1 were also less than that of the other three samples.
Table 2 Roughness parameters of the IF steel samples.
| Sample | TR-1 | TR-2 | TR-3 | TR-4 |
|---|---|---|---|---|
| Sa (μm) | 0.831 | 0.913 | 0.905 | 0.872 |
| Sq (μm) | 1.018 | 1.109 | 1.094 | 1.062 |
| Sp (μm) | 2.801 | 3.338 | 3.152 | 2.976 |
| Sv (μm) | -3.089 | -3.365 | -3.079 | -3.704 |
Although other roughness parameters can represent surface characteristics, Sa (or Ra) remains the most frequently used parameter in studies on corrosion resistance as a function of surface roughness [29]. However, in IF steel, Sa can only vary within a relatively narrow range due to the rigorous surface standards of automotive sheet steels. Therefore, differences in the surface topographies of the four samples were actually not very obvious. Besides, because Sa is an average value, generating the same roughness parameter is possible for distinctly different surface topographies [30]. Therefore, prediction of the corrosion rate based solely on the mean roughness parameter for auto sheet steels is likely to be misleading, as explained in detail in Section 4.
Table 3 shows the results of residual stress measurements of the IF steel samples. The results indicated that the surface residual stresses induced by temper rolling were compressive except for the sample TR-1. Besides, it was obvious that temper rolling resulted in not only different levels of residual stress but also different types of residual stress in IF sheet steel. Differences in surface residual stress demonstrate that plastic deformation is actually inhomogeneous and that the sheet undergoes tensile and compressive deformation simultaneously during the temper rolling process. Moreover, the residual stresses of the four samples were relatively small (less than 20 MPa), especially when compared with that induced by cold rolling or laser shock peening (typically over 100 MPa) [31], which could be due to the relatively low degree of deformation of IF steel in the temper rolling process.
Table 3 Residual stresses and errors on the surfaces of the IF steel samples.
| Sample | TR-1 | TR-2 | TR-3 | TR-4 |
|---|---|---|---|---|
| Residual stress (MPa) | +18.4 ± 10 | -13.3 ± 8 | -6.3 ± 14 | -15.9 ± 13 |
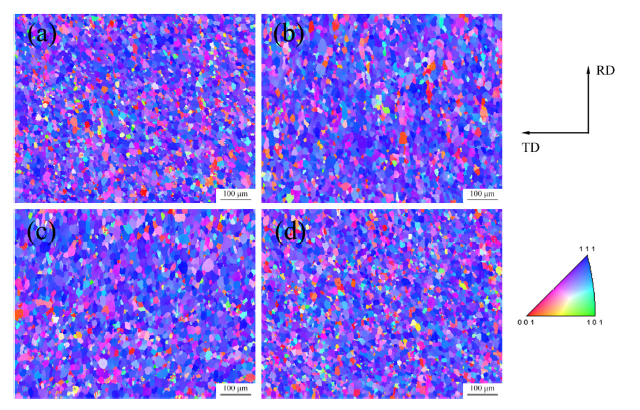
Fig. 2(a)-(d) show the inverse pole figure (IPF) maps obtained from EBSD measurements. And the colors of the grains corresponded to the crystal orientation as shown in the stereographic triangle. The microstructure of all four samples displayed a typical γ {111} fiber texture. No significant difference in crystal orientation could be observed in Fig. 2. Hence, inhomogeneous plastic deformation during temper rolling appears to have little effect on the crystal orientation of IF steel.
Fig. 2. Inverse pole figure (IPF) maps of (a) TR-1, (b) TR-2, (c) TR-3 and (d) TR-4.
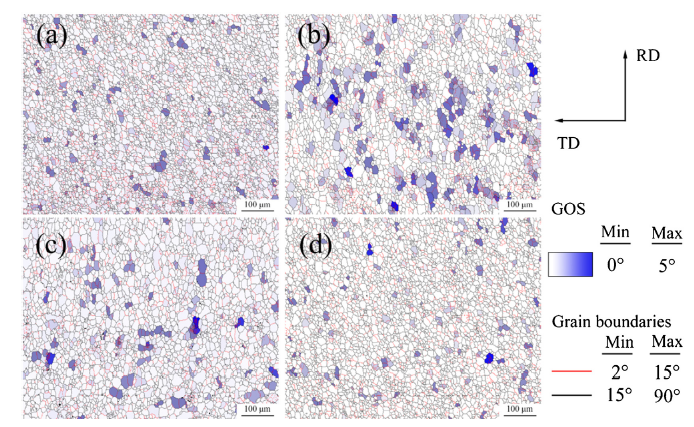
In order to further investigate the features of microstructure, both of the grain boundary and the GOS maps of the IF steel samples calculated from IPF maps (Fig. 2) are presented in Fig. 3. Characterization of the grain boundaries can be used to determine grain deformation, which leads to changes in grain boundaries [32]. In addition, the deformation can lead to the rotation of grains and further cause the orientation spread to change. Therefore, the GOS value can be used to identify dislocation density and indicate the presence of strain in individual grains [33]. Consequently, grain boundaries superimposed with the GOS maps shown in Fig. 3 can effectively reflect the degree of local deformation of grains and the level of strain in IF steel. Moreover, GOS is a crucial parameter predicting the initiation of corrosion in metallic alloys [[20], [21], [22],34,35]. Many studies have shown that grains with a high GOS value are susceptible to corrosion due to the presence of a high density of defects and high strain levels in these grains [20,34,35].
Fig. 3. Grain boundaries superimposed with the grain orientation spread maps of (a) TR-1, (b) TR-2, (c) TR-3 and (d) TR-4.
Fig. 3 shows that all four samples consisted of relatively fine and equiaxed grains, although a slight elongation of the original grains toward the rolling direction can be observed. As the steel sheet was annealed before temper rolling, the deformation of grains must result from the plastic deformation generated during the temper rolling process.
Fig. 3 reveals that the GOS value of a considerable number of grains (white grains) in the sample were smaller than 0.5°. Since the GOS value of recrystallized grains is typically less than 0.5°, the strain level in these grains is low [36]. The GOS value of blue grains were between 0.5° and 5° in the GOS maps (Fig. 3), which means these grains suffered a different degree of deformation during temper rolling. Overall, the darker the color of the grain, the higher its GOS value in the GOS maps. Deformed grains clustered together, especially in Fig. 3(b) and (c), indicating significant strain concentration in these sites. The results presented in this section show that all four samples had the similar average grain size and the same γ {111} texture while the GOS value varied dramatically. This has been highlighted in a previous work where the results demonstrated that GOS was highly sensitive to the achieved plastic deformation and was a good indicator for the deformation state of this materiel [37]. Besides, no obvious dependence between GOS and crystal orientation was observed.
Table 4 lists the fraction of grains with a GOS value between 0.5° and 5° of each sample to quantify the influence of heterogeneous deformation on the microstructures of the test steel. The fraction of deformed grains in TR-2 (approximately 75%) was much higher than that of the other samples (approximately 50%).
Table 4 Fraction of IF steel grains with a GOS between 0.5° and 5°.
| Sample | TR-1 | TR-2 | TR-3 | TR-4 |
|---|---|---|---|---|
| Fraction | 0.482 | 0.756 | 0.532 | 0.472 |
The results obtained seem to be contradictory because a large number of grains in TR-2 have a high GOS value (greater than 0.5°), but the residual stress of TR-2 is not especially high, particularly when compared with the other samples. But it should be noted that residual stresses can be classified into three types, and they may exist simultaneously in one component but at different scales [38]. Residual stresses that equilibrate over a scale much larger than the grain size are defined as Type I stresses. Type II stresses are micro stresses that vary at the grain-size level, whereas Type III stresses are present at the atomic level [39]. Thus, the residual stress measured in this study is Type I and generated by macro deformations. While GOS can only manifest the strain in the microscale, and this stress is classified as Type II. Therefore, these two factors may play various roles in the two scales. From a macroscopic perspective, stress in one grain may be balanced by deformation generated by other grains
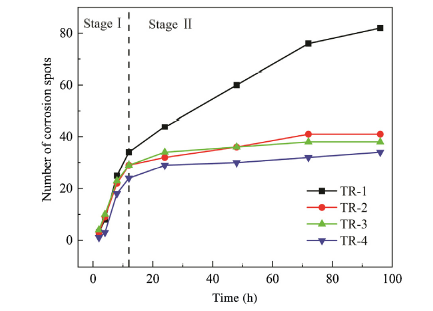
All four samples had developed some corrosion spots visually identified as corrosion products on the surface during the damp heat test. The growth of corrosion spot number of the samples was used to evaluate the corrosion process of IF steel, as shown in Fig. 4. Among the samples studied, TR-1 yielded the most number of corrosion spots, whereas TR-4 revealed the least, after the 96 h-long test. Therefore, according to the test results, TR-1 has the poorest corrosion resistance among the samples tested.
Fig. 4. Number of corrosion spots versus time during the damp heat test.
Based on the change law of corrosion spots, the corrosion process can be divided into two stages. In the first 24 h, stage I, a corrosion spot initiating stage, is established, and the corrosion spot number of each sample develops rapidly. Then, corrosion evolution enters the stage II. In this stage, the spot number of TR-1 continued to increase whereas those of the three other samples remained nearly constant. This result indicates that TR-2, TR-3, and TR-4 were already in a stable state of corrosion, whereas TR-1 was still in the initiation stage.
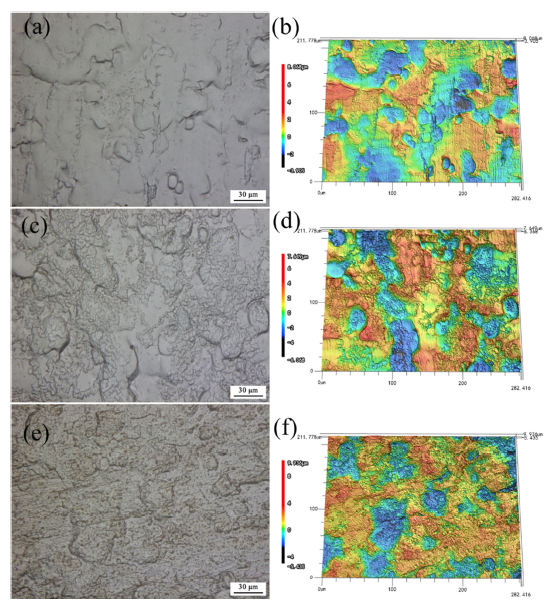
Little difference was observed in terms of the appearance of the four samples in the area of corrosion spot after removing the corrosion products. And Fig. 5(a)-(d) show the optical images and corresponding 3D images of sample TR-2 before and after the 96 -h damp heat test. It is apparent that the temper rolling processed pattern was partially corroded. In addition, the topography of corrosion spot after damp heat test was manifested as continuously distributed shallow cavities (or just dents), as shown in Fig. 5(c) and (d). The cavities were the locations of corrosion products attached on the surface. And no pitting characteristic was found on the surface.
Fig. 5. Optical and corresponding 3D images of surface topographies of sample TR-2: (a, b) topographies before damp heat test; (c, d) topographies of corrosion spot after 96 h damp heat test with removing the corrosion products; (e, f) topographies after potentiodynamic polarization.
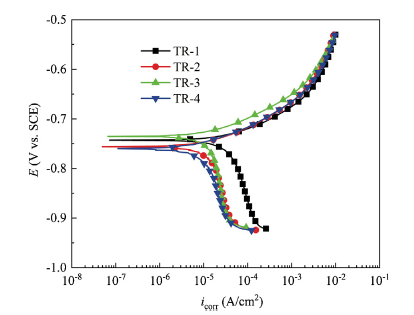
Fig. 6 presents the potentiodynamic polarization curves of the samples in 3.5 wt% NaCl solution. The predominant cathodic half-cell reaction in this solution is oxygen reduction. All four samples did not show pitting throughout the scanned potential range. The corresponding corrosion topography of sample TR-2 after removing corrosion products is shown in Fig. 5(e) and (f). And the corrosion topography appeared much similar to that after damp heat test (Fig. 5(c) and (d)). The curves in Fig. 6 are parallel to each other, thereby indicating that the mechanisms of the anodic and cathodic reactions of different samples were identical despite their different surface features.
Fig. 6. Potentiodynamic polarization curves of IF steel samples in 3.5 wt% NaCl solution.
Moreover, the shape of the anodic branch of the curves in Fig. 6 demonstrates that anodic dissolution of the samples in 3.5 wt% NaCl solution follows the Tafel law. However, the cathodic portion of the polarization curves indicated a limiting diffusion current (iL) due to oxygen reduction. But the corrosion rate (icorr) can be extracted by extrapolating the anodic and cathodic branches back to the corrosion potential (Ecorr) as the net rate of anodic dissolution is equal to the net rate of oxygen reduction (iL) at Ecorr [40].
Table 5 presents the electrochemical parameters, including Ecorr and icorr, obtained using Tafel extrapolation. No significant difference in Ecorr was observed among the four samples, thus demonstrating that these samples have similar thermodynamic stabilities. However, the icorr of TR-1 was much higher than those of the three other samples, thus the corrosion rate of TR-1 was much higher than those of the other three samples.
Table 5 Electrochemical parameters of the IF steel samples in 3.5 wt% NaCl solution.
| Sample | TR-1 | TR-2 | TR-3 | TR-4 |
|---|---|---|---|---|
| Ecorr (V vs. SCE) icorr (μA/cm2) | -0.747 45.52 | -0.756 16.28 | -0.735 14.31 | -0.760 12.49 |
In order to establish the relationship between surface features and the corrosion behaviors of IF steel, the processes involved in corrosion must be understood thoroughly. The initiation and propagation of corrosion spots at the early corrosion stage are crucial manifestations of corrosion kinetics. And corrosion usually initiate from micro-nano sites, which are difficult to distinguish using macro surface features [41,42]. Generally speaking, electrons in valleys of the surface profile cannot easily escaping due to the confines of the surrounding nuclei while electrons at peaks can move easily [23,43]. Thus, the peaks are more electrochemically active and susceptible to corrosion than valleys. Local stress concentration sites are also more susceptible to corrosion [44].
As shown in Table 6, no apparent differences in spot number exist among the samples in the first 8 h of the damp heat test. One can assume that there were still adequate precursors for the initiation of corrosion spots in this stage. And the spot number of TR-1 continued to increase with a high rate for 96 h, as shown in Fig. 4. It should be ascribed to tensile residual stress, which markedly accelerates the corrosion process. Corrosion can also rapidly initiate at peaks on the surface of the material. Aggregation of peaks on the surface of TR-1 provides corrosion spots with a good location in which to enlarge. By contrast, compressive residual stress can close defects, such as vacancies and dislocations on the steel surface, thereby inducing the corrosion process to enter a stable state [45]. Thus, samples TR-2, TR-3, and TR-4 maintained steady corrosion rates after 24 h.
Table 6 Numbers of corrosion spots at the 8th and 96th hour of the damp heat test.
| Sample | TR-1 | TR-2 | TR-3 | TR-4 |
|---|---|---|---|---|
| 8 h | 25 | 22 | 23 | 18 |
| 96 h | 82 | 41 | 38 | 34 |
The 96th-hour spot numbers of the three samples subjected to compressive stress are also listed in Table 6. The numbers of corrosion spot decreased in the order of TR-2 > TR-3 > TR-4, which is identical to the sequence of fraction of grains with a GOS value between 0.5° and 5°. As illustrated in literatures, a high GOS value can manifest precursor sites for corrosion. Therefore, the corrosion spot would propagate at a lower rate in grains with a low GOS value. That is to say, under the effect of compressive residual stress, GOS is crucial in evaluations of IF steel corrosion behavior.
Surface features exert significant effects not only on the corrosion evolution process but also on the average corrosion rate of IF steel. Correlating the corrosion dynamical parameters of IF steel with surface features, it can be found that different surface features played the leading role in different scales.
The relationship between residual stresses and icorr can be established in the macro scale level. Among the four samples, the corrosion rate of TR-1 was the largest (icorr =45.52 μA/cm2) since tensile residual stress exerts a corrosion-promoting effect that can stimulate defects (such as dislocations and microcracks) to form and eventually accelerate anodic dissolution. Zhang et al. reported that microcracks induced by tensile residual stress enabled environmental attack on the surface of alloys [46]. It seems contradictory since approximately 75% of the grains in sample TR-2 have a high GOS value. However, as described earlier, GOS is only a measure of electrochemical inhomogeneity in grain size and cannot be directly used to evaluate the average corrosion rate. Nevertheless, when the difference in macro features is inadequate to distinguish the corrosion behavior of steel, micro features could be the major determinants of IF steel corrosion rate. For example, the fraction of grains with a GOS value between 0.5° and 5° of TR-2, TR-3, and TR-4 are positively correlated with their corrosion rates because their residual stresses are all compressive in nature. In addition, it should be noted that finding a significant numerical relation between residual stresses and corrosion rates is difficult due to the accuracy of residual stress measurement.
The surface topography of IF steel exerts complex effects on the electrochemical process. According to the literature, rough surfaces have higher corrosion rates than smooth surfaces [[47], [48], [49]]. However, the corrosion rate of TR-1 (icorr =45.52 μA/cm2) was notably high despite its low Sa and Sq (Sa =0.831 μm, Sq =1.108 μm). This result is inconsistent with previous investigations. However, most of the surfaces studied in the literature were pretreated by grinding or polishing [25,46,48,49]. Consequently, the distribution of surface textures was actually consistent, and the heights of peaks and depths of valleys at each sampling cycle were basically the same. In contrast to those in previous work, however, the samples in the present investigation were directly cut from commercial steel sheets without any surface polishing to simulate the application state. Therefore, existing theories on the influence of surface roughness on corrosion processes are not completely applicable to this study.
As shown in Fig. 6, it was clear that the involved electrochemical process of IF steel samples were mainly controlled by the cathode reaction. Oxygen diffusion could be considered the rate-determining step of the entire corrosion process in the light of the marked inflexions presented on the cathodic branches. Thus, the relationship between surface topography and oxygen diffusion could be seen as the determinant factor of corrosion rate. Lee et al. reported that the diffusion process in alloy surfaces has to do with the depth of valleys [50]. Surfaces with deeper valleys corrode more slowly because of the difficulty in diffusing oxygen into these valleys. TR-1 revealed the smallest Sv (Sv =-3.089 μm) and a high oxygen diffusion rate. Accordingly, this sample showed the highest corrosion rate (icorr =45.52 μA/cm2) among the samples tested. As such, the depth of valleys on the material surface is the true factor influencing IF steel corrosion.
Based on the discussion above, residual stress may be supposed to exert a significant influence on the uniform corrosion of IF steel. The geometry of surface valleys also affect the corrosion behavior of the steel. By contrast, GOS is less important to the IF steel corrosion rate.
A temper rolling process could change surface features by inhomogeneous plastic deformation. And the relationship between surface features and the corrosion behaviors of IF steel was established in this paper. The residual stress state and GOS exerted different influences on the corrosion evolution process and the corrosion rate under various scales. Surface topography could affect the diffusion process of electrochemical reactions. The following are important conclusions drawn from this study:
(1)Surface features may be changed by inhomogeneous deformation during the temper rolling process. Residual stress and GOS were sensitive to heterogeneous deformation of IF steel, whereas surface topographies of different sites remained nearly the same. Crystal orientations and grain sizes seemed to be unaffected.
(2)Surface features had significant effects on the early corrosion propagation of IF steel. Initiation and propagation of corrosion spots can be accelerated by tensile residual stress and high GOS value (>0.5°), whereas surface peaks revealed no significant influence on the corrosion rate.
(3)The corrosion process of IF steel in 3.5 wt% NaCl solution was controlled by the process of cathodic oxygen diffusion. The limit of oxygen diffusion rate was determined from the depths of valleys on the material surface and found to affect the average corrosion rate of the IF steel.
(4)Residual stress had a significant effect on the average corrosion rate of the IF steel. The corrosion rates of samples with tensile residual stress were much higher than that of the sample with compressive residual stress. Moreover, GOS presented a positive correlation with the corrosion rate of IF steel when subjected to compressive residual stress.
This work was financially supported by the National Key Research and Development Program of China (No. 2018YFB0605502), National Natural Science Foundation of China (No. U1560104), the State Key Laboratory of Metal Material for Marine Equipment and Application and National Environmental Corrosion Platform (NECP).

 WeChat
/
| 〈 |
|
〉 |