Search for articles:
Zhi Dong, Nan Liu, Weiqiang Hu, Zongqing Ma , Chong Li, Chenxi Liu, Qianying Guo, Yongchang Liu
Corresponding authors:
Received: 2019-01-18
Revised: 2019-04-10
Accepted: 2019-05-6
Online: 2020-01-01
Copyright: 2020 Editorial board of Journal of Materials Science & Technology Copyright reserved, Editorial board of Journal of Materials Science & Technology
More
Abstract
As an emerging preparation technology, wet chemical method has been employed widely to produce lots of alloy materials such as W and Mo based alloys, owing to its unique technical advantages. Ascertaining the synthesis mechanism behind wet chemical method is indispensable for controlled synthesis of high-quality W-Y2O3 composite powder precursor. The co-deposition mechanism of yttrium and tungsten component behind the wet chemical method of preparing yttrium-doped tungsten composite nanopowder was investigated systematically in this work. A series of co-deposited composite powders fabricated under different acidity conditions were used as research targets for investigating the effect of surface composition and structure on co-deposition efficiency. It was found that white tungstic acid has more W—OH bonds and much higher co-deposition efficiency with Y3+ ions than yellow tungstic acid. It is illustrated that the coordination reaction between W—OH bonds on tungstic acid particles and Y3+ ions brings the co-deposition of yttrium and tungsten component into being. Through displacing H+ ions in W—OH bonds, Y3+ ions can be adsorbed on the surface of or incorporated into tungstic acid particles in form of ligand. Consequently, to control and regulate Y2O3 content in powder precursor accurately, H+ ion concentration in wet chemical reaction should be in range of 0.55-2.82 mol L-1 to obtain white tungstic acid. Besides, H+ ion concentration also has prominent effect on the grain size and morphology of reduced powder precursor. The optimal value should be around 1.58 mol L-1, which can lead to minimum W grain size (about 17 nm) without bimodal structure. The chemical mechanism proposed in this work could produce great sense to preparation of high-quality precursor for sintering high-performance Y2O3 dispersion strengthened W based alloys. Our work may also shed light on the approach to exploit analogous synthesis mechanism in other alloy systems.
Keywords:
Tungsten has attracted great attention due to its excellent physical and chemical properties, such as high melting point, low sputtering rate, high thermal conductivity and good high-temperature strength, which suggests its promising application in aerospace, military, especially as the plasma facing material in fusion powder reactors [1,2]. Unfortunately, the high ductile-to-brittle transition temperature (DBTT) that is generally well above room temperature usually causes the inherent low fracture toughness of tungsten-based materials at high temperature [3,4]. It is all known that the DBTT of tungsten-based materials is closely dependent on microstructural characteristics such as grain size, uniform distribution of dispersion phase and sintering density. To improve the comprehensive mechanical properties of tungsten-based materials, small amounts of rare earth oxides, such as Y2O3, CeO2 and La2O3, were doped into tungsten matrix by researchers. As expected, remarkable effects such as fine grain size and high sintering density were obtained by doping these thermally stable oxides [5,6].
For the time being, the main preparation methods for oxides doped tungsten composite nanopowder precursor is mechanical alloying [7]. Nevertheless, lots of obvious disadvantages of this method, such as introducing impurities easily, inhomogeneous particle size distribution and irregular particle morphology, cannot be overlooked [5]. Apart from that, the oxide particles in powder precursor distribute inhomogeneously and tend to agglomerate at grain boundaries to some extent [8], greatly weakening the improvement effect of rare earth oxides on the mechanical properties of tungsten-based alloys.
Recently, much attentions have been paid to synthesis of oxide-doped tungsten composite nanopowder precursor through the emerging wet chemical method [9]. In the premise of high purity and homogeneous mixing [10], this method has unparalleled superiority in precisely controlling grain size, morphology and oxide distribution at molecular level comparing with traditional mechanical alloying [[11], [12], [13], [14]]. However, one may observe batch-to-batch variations in component, size and shape in the reduced powder precursor under different reaction condition, which would have remarkable effect on subsequent sintering of high-performance Y2O3 dispersion strengthened W based alloys. Thus it is urgent to clarify the synthesis mechanism behind the wet chemical method in order to optimize the process and prepare high-quality powder precursor. Nevertheless, there are relatively few studies by now devoted to clarifying the chemical reaction mechanism of the oxide doping during co-deposition process. And very little information about the component and chemical structure of co-deposited powder is available. Meanwhile, to produce high-quality composite powder precursor, an optimal chemical reaction condition for this co-deposition reaction is also less documented and need to be investigated carefully.
In order to trace the dynamic development of co-deposition powder component in different acidity condition, batches of yttrium-doped co-deposited composite powder were produced by wet chemical method in this paper. It was found that the co-deposited composite powder change from amorphous white tungstic acid to crystalline yellow tungstic acid completely when H+ ion concentration is up to 3.21 mol L-1. On top of that, the W—OH bonds in white tungstic acid is much more than that in yellow tungstic acid, giving rise to the higher co-deposition efficiency of the former with Y3+ ions. By displacing H+ ions in W—OH bonds, Y3+ ions can be adsorbed on the surface of or incorporated into tungstic acid particles in form of ligand. It is exactly the coordination reaction between Y3+ ions and W—OH bond that makes the co-deposition of them possible. Besides yttrium, other elements such as La, Ce and Re can also be doped into W based alloys under the guidance of the similar theory proposed in our work. The co-deposition mechanism proposed in this work will also provide insight into the development of other alloy material systems. In addition, the grain size and morphology of powder precursor are also influenced by H+ ion concentration remarkably and the bimodal W grain is eliminated compeletely when using the optimal H+ ion concentration of 1.58 mol L-1. This kind of composite powder can serve as good precursor for sintering high-performance Y2O3 dispersion strengthened W based alloys.
The co-deposited composite powders with a nominal composition of W-5 wt%Y2O3 after hydrogen reduction were fabricated in aqueous solutions from (NH4)10[H2W12O42]·4H2O (APT) and yttrium nitrate hydrate Y(NO3)3·6H2O. 2.57 g of yttrium nitrate hydrate was firstly dissolved in 120 ml of distilled water. Then 20 g of APT was added in the transparent solution. Ten minutes later, different volumes of concentrated nitric acid (65%-68%) were added successively and left to react for 30 min. The reaction was carried out under stirring and ultrasonic process to enhance the reaction and fully disperse the co-deposition particles. After that, 150 ml of ethanol was added into the formed suspension. After reacting for another 3 h, the suspension was filtered and the obtained precipitate was washed with ethanol and then put in vacuum drying oven at 60 °C to dry for 24 h. The detailed experiment condition for fabricating ten different co-deposited powders are listed in Table 1. They are each given a sample ID.
Table 1 List of co-deposited powder samples and corresponding experiment condition.
| Sample ID | H2O (mL) | APT (g) | Y(NO3)3·6H2O (g) | HNO3 (mL) | ρ(H+) (mol L-1) |
|---|---|---|---|---|---|
| 15Y | 120 | 20 | 2.57 | 15 | 1.58 |
| 20Y | 120 | 20 | 2.57 | 20 | 2.03 |
| 25Y | 120 | 20 | 2.57 | 25 | 2.45 |
| 30Y | 120 | 20 | 2.57 | 30 | 2.82 |
| 35Y | 120 | 20 | 2.57 | 35 | 3.21 |
| 40Y | 120 | 20 | 2.57 | 40 | 3.55 |
| 50Y | 120 | 20 | 2.57 | 50 | 4.18 |
| 60Y | 120 | 20 | 2.57 | 60 | 4.79 |
| 20 | 120 | 20 | - | 20 | 2.03 |
| 50 | 120 | 20 | - | 50 | 4.18 |
Thermal processing (calcination and reduction) of the as-prepared composite powders were carried out in a tube furnace. They were firstly calcined in argon atmosphere at 480 °C for 1 h, then reduced at 600 °C for 3 h and 800 °C for 6 h in hydrogen atmosphere (100 ml/min).
The phase composition and microstructure of the co-deposited composite powders and reduced powder precursors were characterized by X-ray diffraction (XRD, D/MAX-2500) with Cu Kα radiation, field emission scanning electron microscopy (SEM, Hitachi Model No. S 4800) and transmission electron microscopy (TEM, JEM-2100) equipped with EDX detector, respectively. X-ray photoelectron spectroscopy (XPS) analyses were carried out using a Thermo VG Scientific ESCALAB 250XI spectrometer with an Al Kα source. Avantage software (v5.967) was used to acquire and analyze datas. All the binding energies were calibrated by setting the C 1s peak to 284.8 eV of the surface adventitious carbon. Fourier-transform infrared spectra (FTIR) and Raman spectra of samples were recorded on Thermo VG Scientific IS10 spectrometer and Thermo VG Scientific DXR spectrometer, respectively.
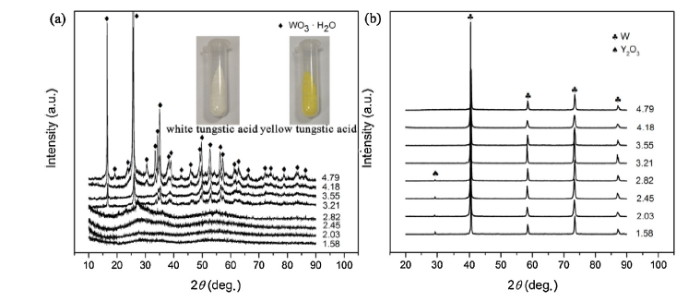
Fig. 1(a) shows the XRD patterns of all the co-deposited composite powders produced by wet chemical method in the H+ ion concentration range from 1.58 to 4.79 mol L-1 (the concentration should be larger than 0.55 mol L-1 at least to make sure [H2W12O42]10- ions are protonated completely). As shown in the insets in Fig. 1(a), the colour of co-deposited powders change from white into bright yellow when H+ ion concentration is up to 3.21 mol L-1. Judging from the XRD patterns, the white composite powder possess amorphous nature and the same amorphous tungstic acid (WO3·xH2O) was also prepared successfully by Kamal et al [15]. However, the yellow composite powder is well-crystallized tungstic acid (WO3·H2O). With an orthorhombic Pmnb structure, the yellow tungstic acid has lattice parameters of a = 0.525 nm, b = 1.071 nm and c = 0.513 nm, which is well consistent with the published data (JCPDS No. 84-0886). It is generally accepted that there are many kinds of tungstic acid and the general formula is mWO3·nH2O. When given a certain amount of APT, an excessive amount of nitric acid uauslly promotes the generation of crystalline yellow tungstic acid (n/m = 1) [16]. Nevertheless, the crystal structure of white tungstic acid is less reported and believed to be amorphous [15]. Generally, it is a mixture of tungsten oxide hydrates with different degree of hydration (n/m>1.3) [17]. But whatever the co-deposited composite powders are, the dominant phase α-W with a Im-3 m structure (JCPDS No. 89-2767) is obtained for all the samples after hydrogen reduction, and the absence of other impurity phases indicates that these co-deposited composite powders have been reduced completely, as shown in Fig. 1(b). More interestingly, the relative weak peak of Y2O3 in the reduced samples disappeared when the corresponding co-deposited composite powders transformed into yellow tungstic acid, which may result from little yttrium component being deposited during chemical reaction. Therefore, it follows that different tungstic acid particles have significantly different co-deposition efficiency with yttrium component. In order to find out the essential reason behind this phenomenon, further analysis and characterization were made on sample 20Y and 50Y selected in the range of white tungstic acid and yellow tungstic acid co-deposited composite powders, respectively.
Fig. 1. XRD patterns of (a) co-deposited composite powders produced by wet chemical method in the H+ ion concentration range from 1.58 to 4.79 mol L-1. Inset, white composite powder prepared in the H+ ion concentration of 2.03 mol L-1 and yellow composite powder prepared in the H+ ion concentration of 4.18 mol L-1, (b) reduced W-Y2O3 composite powder precursors corresponding to the co-deposited composite powders in
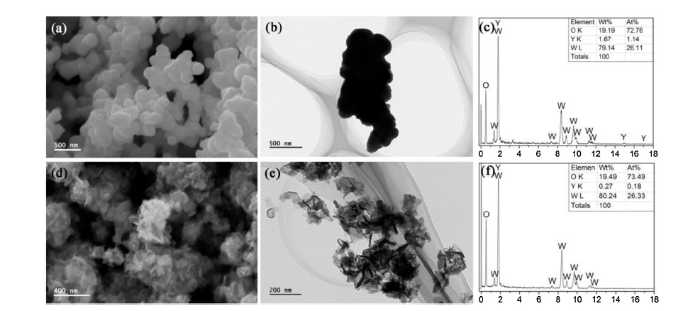
The morphologies of samples are investigated by SEM and TEM. Fig. 2(a) is the typical SEM image of sample 20Y. As seen from it, white tungstic acid is composed of some agglomerates of spherical particles with 200-300 nm in diameter. The same morphology is also observed in corresponding TEM image (Fig. 2(b)). The EDX spectrum of the agglomerates region in Fig. 2(b) is displayed in Fig. 2(c), where the main elements of W, Y, and O are detected in this composite powder. However, it is found that yttrium content deviates from the design value unexpectedly, maybe because there is not enough time for all the yttrium component to react with the white tungsten acid before deposition, resulting in the undeposited yttrium component being washed away during subsequent filtration. The typical morphology of sample 50Y is shown in Fig. 2(d), where agglomerates composed of large amounts of nanoribbons and nanosheets are observed. The observation suggests the excessive H+ ion concentration induces a structure change from 3D to 2D. More detailed information can be obtained from corrsponding TEM image, as shown in Fig. 2(e). It can be seen that the nanoribbons are less than 200 nm long and the nanosheets are about 100 nm in diameter. Fig. 2(f) shows the EDX spectrum of agglomerates region in Fig. 2(e). Compared with sample 20Y, near zero of yttrium content suggests that the co-deposition can hardly occur between yttrium component and yellow tungstic acid particles, which is in good agreement with the disappeared Y2O3 peaks in the XRD patterns of corresponding reduced powders (Fig. 1(b)).
Fig. 2. (a) SEM image of the co-deposited composite powder 20Y, (b) TEM image of the co-deposited composite powder 20Y, (c) EDX spectrum of the agglomerates region in
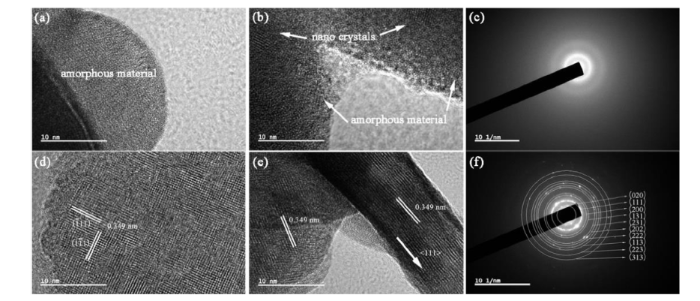
Fig. 3(a) and (b) displays the high-solution TEM (HRTEM) image of sample 20Y. As seen from Fig. 3(a), without obvious lattice fringe, most of the white tungstic acid particle is amorphous, which is consistent with the observation from XRD pattern (Fig. 1(a)). Fig. 3(c) shows the selected-area electron diffraction (SAED) pattern recorded from sample 20Y and further confirms that white tungstic acid exhibits amorphous character. Meanwhile, some nanosized crystallites (<5 nm) surrounded by amorphous material can be observed in some particles (see Fig. 3(b)). The same crystallites were also found by Wahlberg et al [13]. The nanosized crystallites exactly are yellow tunsgten acid, i.e. H2WO4 phase according to the analysis below. Little yttrium content exists in these crystalline region due to low co-deposition efficiency of yellow tungsten acid with Y3+ ions. These phenomena indicate amorphous character of white tungsten acid has intimate relationship with the presence of yttrium component [18]. However, it is difficult to distinguish yttrium component from the co-deposition particles, which suggests that a complex reactant with amorphous nature is produced to some degree. HRTEM images recorded from sample 50Y are shown in Fig. 3(d) and (e). The measured lattice spacing of 0.349 nm correspond to the {111} plane of WO3·H2O, demonstrating that the growth direction of nanosheet and nanoribbon is along <111> direction [19]. The SAED pattern recorded from the sample 50Y (Fig. 3f) is indexed to WO3·H2O with an orthorhombic Pmnb structure, which is well consistent with the XRD result in Fig. 1(a). Based on the above analysis, an important conclusion could be drawn that the microscopic characteristics of tungstic acid particle (maybe surface component, structure or morphology) play a critical role in its co-deposition with yttrium component.
Fig. 3. (a) and (b) HRTEM image of sample 20Y, (c) SAED pattern recorded from sample 20Y, (d) and (e) HRTEM image of the sample 50Y and (f) SAED pattern recorded from sample 50Y.
Surface state and composition of sample 20Y and 50Y, therefore, were further investigated by XPS. For comparison, XPS characterization was also made on the deposited powder of sample 20 and 50, which were prepared under the same experiment condition with sample 20Y and 50Y except without yttrium component being doped, as listed in Table 1. Fig. 4(a) shows the wide-scan XPS spectra of the sample 20Y and 50Y and no impurity elements were identified apart from W, O and Y elements. The peak for C 1s at binding energy 284.8 eV is due to adventitious hydrocarbon from the XPS instrument itself. The difference is that the peak corresponding to Y 3d only appears in the sample 20Y, which is in accordance with the EDX results in Fig. 2 and further confirms that yttrium component is almost not deposited together with yellow tungstic acid particles. Narrow-scan XPS spectra of the Y 3d, W 4f and O 1s core level for the four deposited powders are present in Fig. 4(b)‒(f). The binding energy values corresponding to each core level are summarized in Table 2. Fig. 4(b) shows that the Y 3d spectrum of the sample 20Y and 50Y and obvious peaks only appear in the sample 20Y, with the 5/2-3/2 spin-orbit doublet. Y 3d5/2 and Y 3d3/2 doublet at the binding energies of 158.45 and 160.49 eV are associated with the Y3+ state and are good consistent with the binding energy values earlier reported for Y3+ state in some yttrium-containing tungstates [20,21]. For comparison, the binding energy of Y 3d doublet corresponding to the Y(NO3)3·6H2O used for the co-deposition reaction is also provided in Table 2. It is found that the binding energy values for both Y 3d5/2 and Y 3d3/2 doublet decrease after co-deposition reaction, which may result from electric density increase of Y3+ ions due to the electric charge transfer during ligand formation, as discussed below. The W 4f core level spectra of the sample 20 and 50 are shown in Fig. 4(c) and the W 4f doublet binding energies are 35.65, 37.78 eV and 35.88, 38.01 eV, respectively. These binding energy values are very close to those reported by other researchers and correspond to spin-orbit splitting of the W 4f7/2 and W 4f5/2 components [22,23]. Besides, these peaks possess high symmetry without any shoulders, indicating that all W atoms in the two samples are in 6+ oxidation state. After co-deposition reaction, no significant peak position changes for W 4f doublet are observed in both sample 20Y and 50Y (Fig. 4(d)), which suggests the almost same chemical environment of W6+ state in the four samples. The O 1s core level spectra of sample 20 and 50 are depicted in Fig. 4e. The O 1s peak can be resolved into three distinct components using Gauss-Lorenz fitting, demonstrating that there are three different kinds of O binding state in the two samples. The predominant peaks, with binding energy at 530.60 and 530.61 eV, respectively, are attributed to the crystal lattice oxygen (W—O) [24]. The smaller peaks at 532.40 eV are assigned to oxygen in water molecules adsorbed on the sample surface [22]. Through calculating the fitted peak areas of three O binding state, it can be found that water molecule content in sample 50 (21%) is about twice as much as that in the sample 20 (9%), which may benefit from its two-dimensional layered structure. The most significant difference between the two samples comes from the fitted peaks at 531.23 and 531.45 eV, respectively. These fitted peaks can be assigned to the contribution from W—OH bonds [25]. It is surprised that W—OH content in sample 20 (14%) is far more than that in sample 50 (2%), which may be the main reason behind significant yttrium content difference between the co-deposition powder 20Y and 50Y (see Fig. 2). Moreover, the O 1s spectra of sample 20Y and 50 Y are also fitted with three peaks (see Fig. 4(f)) and the position of fitted peaks ascribed to inter-structural water molecules and crystal lattice oxygen contribution remain almost the same before and after co-deposition reaction. However, compared with the fitted W—OH peaks in sample 20 and 50, a slight increase in peak position occurs for the peaks belonging to W—O—Y coordination bond in both sample 20Y and 50Y. This could be due to electric density decrease of O atoms during ligand formation [26]. In addition, a remarkable and similar content discrepancy of W—O—Y coordination bond also exist between sample 20Y (13%) and 50Y (2%), probably originating from the W—OH bond content different in corresponding sample 20 and 50. From the above, the presence of W—O—Y bonds suggests that coordination reaction between W—OH bond and Y3+ ions occurs during the chemical co-deposition process and the amount of Y3+ ions involved into the reaction depend on the W—OH bond content.
Fig. 4. (a) Wide-scan XPS spectra of the sample 20Y and 50Y, (b) Y 3d core level spectrum of the sample 20Y and 50Y, (c) W 4f core level spectrum of the sample 20 and 50, (d) W 4f core level spectrum of the sample 20Y and 50Y, (e) O 1s core level spectrum of the sample 20 and 50 and (f) O 1s core level spectrum of the sample 20Y and 50Y.
Table 2 List of the binding energy values corresponding to Y 3d, W 4f and O 1s core level of sample 20, 20Y, 50, 50Y and Y(NO3)3·6H2O, respectively.
| Sample ID | W 4f (eV) | Y 3d (eV) | O 1s (eV) | ||||
|---|---|---|---|---|---|---|---|
| W 4f7/2 | W 4f5/2 | Y 3d5/2 | Y 3d3/2 | W—O | W—OH | W—OH2 | |
| 20 | 35.65 | 37.78 | - | - | 530.60 | 531.23 | 532.40 |
| 20Y | 35.82 | 37.96 | 158.45 | 160.49 | 530.88 | 531.68 | 532.66 |
| 50 | 35.88 | 38.01 | - | - | 530.61 | 531.45 | 532.40 |
| 50Y | 35.92 | 38.06 | - | - | 530.73 | 531.86 | 532.66 |
| Y(NO3)3·6H2O | - | - | 159.24 | 161.29 | 533.56 | ||
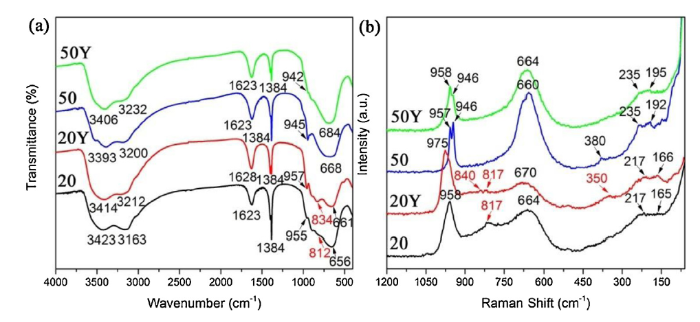
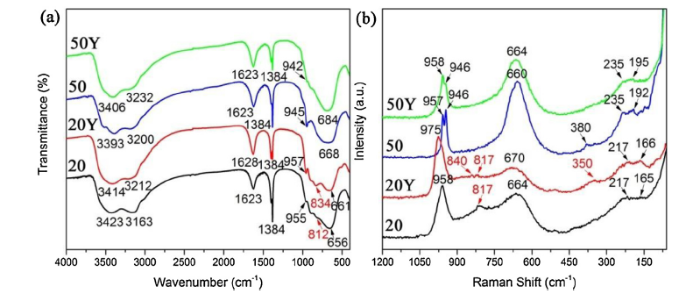
To further characterize the detailed chemical structure of the four deposited powders, FTIR and Raman spectroscopy were employed, as shown in Fig. 5. Intense absorption peaks in the range of 3100‒3600 cm-1 are observed for all the deposited powders (Fig. 5(a)). These peaks can be assigned to OH stretching bands, with the band at 3400 cm-1 associated to weakly adsorbed water on the surface and the band at 3200 cm-1 to hydrogen bonded OH groups [27]. Moreover, the peaks around 1620 cm-1 can be ascribed to H2O bending vibration mode. All the absorption peaks indicate the presence of coordinated or interlayer water in these deposited powders [28]. Besides, the strong and sharp absorption band at 1384 cm-1 should correspond to the characteristic bending vibration of remaining NH4+ ions [29]. The shoulders at about 950 cm-1, with small intensity in FTIR spectrum but more obvious in Raman spectrum (Fig. 5(b)), are attributed to the stretching mode of terminal W═O [22]. At the same time, around 660 cm-1, every sample displays a strong absorption band that corresponds to stretching vibration mode of O—W—O for bridging oxygen [30].
Fig. 5. (a) FTIR spectra recorded from sample 20, 20Y, 50 and 50Y, respectively and (b) Haman spectra from sample 20, 20Y, 50 and 50Y, respectively.
Nevertheless, what is different is that a small transition in FTIR spectrum at 812 cm-1 but more evident in Raman spectrum at 817 cm-1 appear only in sample 20. The transition could be attributed to another kind of W—O stretching vibration mode [31]. According to XPS analysis above, the remarkable W—OH bond content discrepancy in sample 20 and 50 is probably the reason behind this phenomenon (see Fig. 4(e)). Hence, it is reasonable to attribute the transition at 812 cm-1 to the W—OH bonds involved into coordination reaction and it is expected that a new absorption band belonging to W—O—Y bond stretching vibration mode appears at 834 cm-1 in sample 20Y [32]. And a corresponding peak at 840 cm-1 also can be observed in Raman spectrum accompanying by a peak at 350 cm-1 that is absent in other samples and may be attributed to the bending vibration mode of W—O—Y bond. What’s more, intensity of the peak at 817 cm-1 in sample 20 is reduced compared with that in sample 20Y, because of the decrease in W—OH bond content after coordination reaction. Used for identifying hydration level, the intensities of peaks at about 660 cm-1 in sample 50 and 50Y are found to be increased when compared with sample 20 and 20Y. What’s more, a weak intensity band belonging to W-OH2 vibration appear at 380 cm-1 in sample 50 [33]. These results suggest a increase in the degree of hydration in sample 50 and 50Y, which is consistent with XPS fitting results above. According to literature, the bands in the range of 200‒300 cm-1 can be attributed to the bending mode of O—W—O bond and the rest of bands below 200 cm-1 is induced by lattice vibrations [34,35].
To sum up, combined with XRD, TEM, XPS, FTIR and Raman results, one can conclude that relatively intensive coordination reaction between W—OH bond and Y3+ ions definitely occurs in sample 20Y. Moreover, white tungstic acid and yellow tungstic acid possess almost identical chemical structure except for the more W—OH bonds in the former, including terminal W═O bond, W-OH2 bond and O—W—O bond for bridging oxygen. Then, a key question arises: why and how does the higher acidity make tungstic acid change from amorphous state to crystalline state and the structure change from 3D to 2D?
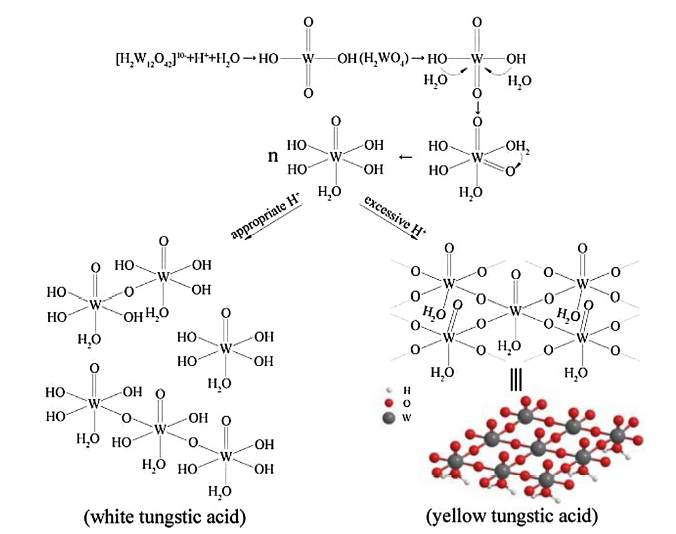
The proposed schemes for the crystallization and growth of white tungstic acid and yellow tungstic acid are presented in Fig. 6. Once the pH value is less than 2, the released paratungstate ions from APT will firstly transform into sparely soluble tungstic acid:
[H2W12O42]10- + 10H+ + 6H2O → 12 [WO2(OH)2] (aq) (1)
Fig. 6. Proposed schemes for the the crystallization and growth of white tungstic acid and yellow tungstic acid, respectively.
Then, the hydration of the tetrahedral [WO2(OH)2] molecules occurs under the attack of two H2O molecules, transforming into octahedral structure, during which a hydrogen atom is transfered to adjacent non-hydroxyl oxygen from H2O atom:
[WO2(OH)2] (aq) + 2H2O → [WO(OH)4H2O] (aq) (2)
Finally, the tungstic acid precipitates as solid tungstic acid particle (i.e., tungsten trioxide hydrate) with different crystal structures and contents of water depending on the chemical conditions [36]:
n[WO(OH)4H2O] (aq) → WO3·xH2O (s) + H2O (3)
Under a high acidity circumstance, all four W—OH bonds in a [WO(OH)4H2O] monomer are involved into dimerization via O-bridging to form WO3·H2O phase containing WO6 octahedron:
W—OH + HO—W → W—O—W + H2O (4)
According to the observation from Fig. 3(d) and (e), the O-bridging is main along equivalent x and y directions ({111} lattice plane) and four oxygen atoms in the same plane of a WO6 octahedron share with other WO6 octahedrons to form two-dimensional crystal structure, which accords with the observed nanosheets and nanoribbons in Fig. 2(d) and (e) [34]. In another direction perpendicular to the plane, one oxygen atom exists in structure water and another oxygen atom is joined by a double bond with tungsten atom [37,38]. The formation process of WO3·H2O crystal structure is displayed in the right side of Fig. 6. Hence, it is understandable that there is few hydroxyl groups in yellow tungstic acid particles and no evident W—OH peak appears in corresponding Raman spectrum (see Fig. 5(b)) [16]. On the contrary, under a low acidity condition, not all the W—OH bonds in a [WO(OH)4H2O] monomer take part in dimerization and only fractional WO6 octahedrons are connected each other via bridging oxygen, which results in irregular atom configuration (i.e., amorphous). Nevertheless, if the dimerization presents periodic regularity on a small scale, atom arrangement in this area is therefore ordered, forming nanosized crystallites surrounded by amorphous material, as observed in Fig. 3(b). Thus, it follows that low acidity in chemical reaction can suppress the dimerization and then reserve much more W—OH bonds in the white tungstic acid than yellow tungstic acid, as shown in the left side of Fig. 6.
According to previous research by Owen [39], the W—OH bond can be regarded as X-type ligand depending on the number of electrons that ligand donates to the O—H bond. This labile ligand can be displaced if W—OH bonds are placed in a solution containing a much greater concentration of a new X-type ligand according to Le Chatelier’s principle [39,40]. Actually, the relative displacement potency strongly depends on chelation, hard/soft match and sterics [41]. It is commonly known that Y3+ ion with higher valence than H+ ion is regarded as hard acid and has priority to coordinate with hard base W-O-. Furthermore, plenty of W-O- coordination sites on white tungstic acid particle surface (multidentate ligand) can coordinate with a Y3+ ion simultaneously, forming ring-like chelate that has better stability than monodentate W—OH ligand [42]. Hence, when the reaction is carried out in the presence of Y(NO3)3 (aq), the coordination reaction between Y3+ ions and white tungstic acid particles with abundant W—OH bonds will occur instantly:
nW-OH + Y3+ → [(WO)nY] + nH+ (5)
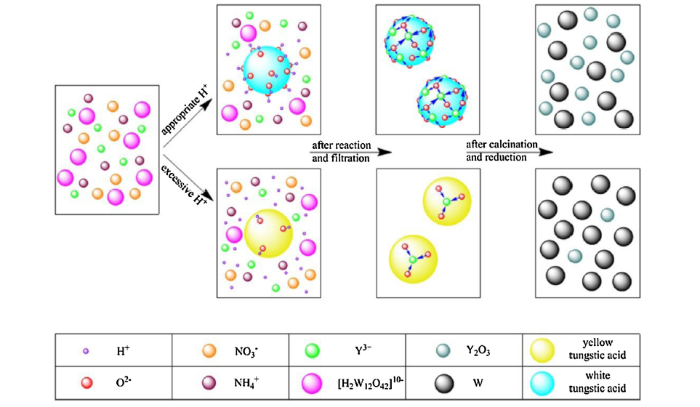
Y3+ ions, as a result, are randomly adsorbed on the surface of or encapsulated within white tungstic acid particles, forming a uniform mixture of yttrium and tungsten components. Fig. 7 shows the proposed chemical structure of the co-deposited powder of white tungstic acid particles and Y3+ ions. Partial WO6 octahedrons with W-center are linked each other via bridging oxygen, but not all the W—OH bonds in white tungstic acid are involved in dimerization, as mentioned above. Each Y3+ ion is coordinated by a few residual W—OH bonds via W—O—Y bridge, making it deposit together with white tungstic acid particle. However, the coordination number of each Y3+ ion is unknown, which need to be investigated in the near future.
Fig. 7. The proposed chemical structure of the co-deposited powder of white tungstic acid particles and Y3+ ions. Color code: WO6 octahedra (yellow octahedra), W (gray ball), O (blue ball), yttrium (red ball) and YO bond (red line).
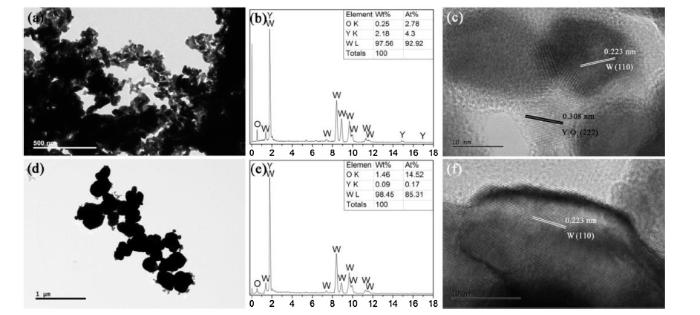
Fig. 8 presents the schematics showing microstructural evolution of the co-deposited composite powder 20Y and 50Y during the wet chemical reaction and subsequent thermal processing. At first, [H2W12O42]10- and Y3+ ions are randomly dispersed in liquid solution, which facilitates the homogeneous mixing of W and Y components [11]. Subsequently, after the addition of nitric acid, W—OH bonds on the formed tungstic acid particles make Y3+ ions adsorbed on their surfaces in the form of ligand, promoting the co-deposition of Y3+ ions and tungstic acid particles. Finally, the difference in W—OH bonds content in sample 20Y and 50Y results in the different Y2O3 content in reduced W-Y2O3 composite powder precursors. Fig. 9(a) and (d) shows the typical TEM images of the reduced powder precursors corresponding to sample 20Y and 50Y, respectively. Agglomerates of W particles with quasi-sphere like morphology are observed in Fig. 9(a). The uniformity of W grain size is excellent except few larger grains. Through statistically analysing about 300 W grains, average grain size of this powder is about 29 nm that is in accordance with the result calculated by Scherrer equation based on XRD data in Fig. 1(b). However, the average grain size of reduced powder precursors corresponding to sample 50Y is much larger than that of sample 20Y. This particle size suggests the instability of W particles during reduction process to some extent. The EDX spectra of the agglomerates regions in Fig. 9(a) and (d) are shown in Fig. 9(b) and (e), respectively. It is found that the yttrium contents in both powder precursors are pretty close to the yttrium content in corresponding co-deposited composite powders, which further confirm the vital role played by W—OH bonds in co-deposition of Y3+ ions and tungstic acid particles. To gain more insight, the HRTEM images corresponding to Fig. 9(a) and (d) are displayed in Fig. 9(c) and (f), respectively. All the particles have a crystalline structure and Y2O3 particle with about 10 nm in diameter appears in Fig. 9(c), while the absence of Y2O3 in Fig. 9(f) indicates that the stabilizing effect of Y2O3 on W particles is restricted greatly during hydrogen reduction, as observed in Fig. 9(d). Therefore, the H+ ion concentration affects not only the component of co-deposited composite powder, but also the morphology of reduced powder precursor. According to discussion above, to obtain white tungstic acid, the H+ ion concentration should range from 0.55 to 2.82 mol L-1, during which an optimal value need be found to synthesize the controlled high-quality powder precursor without bimodal structure. Based on our previous work, the optimal value of H+ ion concentration is determined as about 1.58 mol L-1 according to the plot of average grain size vs H+ ion concentration [43]. In this case, both minimum average grain size and the best size uniformity can be obtained. Without nanosized crystallite areas as observed in Fig. 3(b), co-deposited composite powder is competely amorphous and yttrium component distribute evenly among white tungstic acid through coordination reaction. During hygrogen reduction, uniformly distributed Y2O3 will effectively hinder W grain growth and fusion utill the balance between the driving force for grain growth and the inhibition from Y2O3 is reached. Therefore, the minimum W grain size of about 17 nm with uniform size distribution (Fig. 10(b)) is obtained [44]. When H+ ion concentration exceeds 1.58 mol L-1, some part of the co-deposition powder become crystalline yellow tungstic acid due to the dimerization on a small scale, as observed in Fig. 3(b). These crystalline area will increase gradually with the increase of acidity, which can be confimed by the increasing crystallinity shown from XRD patterns in Fig. 1(a). The lesser yttrium content in these areas due to lower co-deposition efficiency will impair the inhibition to W grain growth, leading to some larger W grains (about 200 nm), as shown in Fig. 10(c). While in the amorphous white tungstic acid area with uniform distributed yttrium component, reduced W grains are obviously small due to the inhibition from Y2O3 particles. Thus, the bimodal W grains are formed under this reaction condition. As the H+ ion concentration further increases, small sized W grains will decrease gradually due to the lack of Y2O3, which results in larger average grain size, as observed from Fig. 9(d). When H+ ion concentration is lower than 1.58 mol L-1, co-deposited composite powder is also yttrium-doped white tungstic acid. However, the slower nucleation rate of white tungstic acid makes that firstly formed contain more yttrium component, resulting in the nonuniform distribution of yttrium component and the formation of bimodal structure in composite powder precursor eventually, as show in Fig. 10(a) [43]. Therefore, the uniform distribution of Y2O3 particles in the W-Y2O3 composite is one critical factor to avoid the bimodal structure of W grains, which will cause abnormal grain growth during subsequent sintering and then deteriorate mechanical properties of alloy if unchecked [45]. Only under H+ ion concentration of 1.58 mol L-1 can the minimum W grain size without bimodal structure be obtained.
Fig. 8. Schematics showing the microstructural evolution of the co-deposited composite powder 20Y and 50Y during wet chemical reaction and subsequent thermal processing.
Fig. 9. (a) TEM image of the reduced W-Y2O3 composite powder precursor corresponding to sample 20Y, (b) EDX spectrum of the agglomerates region in
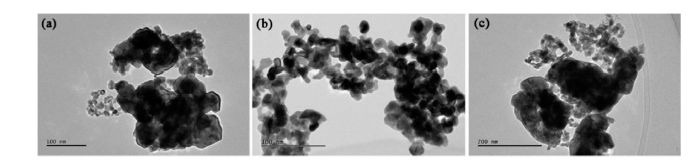
Fig. 10. TEM image of reduced W-Y2O3 composite powder precursor under the H+ ion concentration of (a) 1.23 mol L-1, (b) 1.58 mol L-1 and (c) 2.45 mol L-1.
Besides, the nanosized Y2O3 particles can also impede W grain boundary migration and then inhibit grain growth effectively, finally leading to the refined W grains during subsequent sintering process [5]. After sintering, the Y2O3 particles dispersed within W grains can generate, pin down and accumulate dislocations within grains, resulting in the enhanced mechanical properties [46,47].
High-quality Y2O3-doped W composite powder is the precondition for preparing high-performance Y2O3 dispersion strengthened W based alloy. For controlled preparation of W-Y2O3 composite powder consisting of uniform nano W grains and homogenously dispersed Y2O3 grains, the co-deposition mechanism behind the wet chemical method was studied in depth firstly. It was found that, the phase composition and surface structure of co-deposition powder can be well tuned by changing the H+ ion concentration. Co-deposition composite powder changes from amorphous white tungstic acid to crystalline yellow tungstic acid completely when H+ ion concentration is above 3.21 mol L-1. Once H+ ion concentration is in the range of 0.55-2.82 mol L-1, white tungstic acid containing much more W—OH bonds than yellow tungstic acid can be obtained. The unique surface feature of white tungstic acid plays a key role in facilitating the co-deposition of Y3+ ions and tungstic acid particles. Y3+ ions with excellent chemical properties could displace H+ ions in W—OH bonds and then form thermodynamically stable ligand, resulting in their high-efficiency co-deposition behavior. However, due to few W—OH bonds in yellow tungstic acid, hardly can any Y3+ ions be deposited together with it. Accordingly, white tungstic acid should be a promising complexing agent for preparing oxide-doped tungsten composite nanopowder precursors through wet chemical method. Besides, the grain size and morphology of composite powder precursor can also be optimized conspicuously by adjusting H+ ion concentration. The size of W grains decreased firstly and then increased again as the H+ ion concentration increasing. Under the optimal value of 1.58 mol L-1, high-quality powder precursor with the minimum average grain size and the best size uniformity could be fabricated. This kind of composite powder can serve as good precursor for sintering high-performance Y2O3 dispersion strengthened W based alloys. Our study will also help to understand analogous synthesis mechanism in other alloy systems.
This work was supported financially by the National Natural Science Foundation of China (Nos. 51574178 and 51822404) and the Natural Science Foundation of Tianjin (No. 18JCYBJC17900), and the Seed Foundation of Tianjin University (No. 2018XRX-0005).

 WeChat
/
| 〈 |
|
〉 |
