Search for articles:
Mulin Liu , Naoki Takata, Asuka Suzuki, Makoto Kobashi
Corresponding authors:
Received: 2019-05-10
Revised: 2019-06-17
Accepted: 2019-06-18
Online: 2020-01-01
Copyright: 2020 Editorial board of Journal of Materials Science & Technology Copyright reserved, Editorial board of Journal of Materials Science & Technology
More
Abstract
To identify the microstructural features of the lattice structures of Al alloys built via the selective laser melting (SLM) process, AlSi10Mg alloy with a body-centered cubic (BCC)-type lattice structure was prepared. Characteristic microstructures comprising melt pools with several columnar α-Al phases with <001 > orientations along the elongation direction and surrounded by eutectic Si particles were observed at all portions of the built lattice structure. In the node portions of the lattice structure, a gradient microstructure (continuous change in microstructure) was observed. The columnar α-Al phases were observed near the top surface of the node portion, whereas they became coarser and more equiaxed near the bottom surface, resulting in softening localized near the bottom surface. In the strut portions of the lattice structure, the columnar α-Al phases were elongated along the inclined direction of struts. This trend was more prevalent near the bottom surface. The α-Al phases became coarser and more equiaxed near the bottom surface as well. The aforementioned results were the basis of a discussion of the development of the gradient microstructure in lattice-structured Al alloys during the SLM process in terms of thermal conductivities at the boundaries between the manufactured (locally melted and rapidly solidified) portions and adjacent (unmelted) alloy powder.
Keywords:
Lightweight porous metals exhibit several unique mechanical properties including low density, low thermal conductivity, high specific stiffness, and high impact energy absorption [1]. These materials can be used in the structural applications for shock absorbers used for transport machinery. In particular, the lattice structure of Al alloy (which comprises interconnected struts and nodes in a periodic arrangement) is a new category of porous metals. Lattice-structured Al alloys are a candidate for use in the crumple zones of automobiles [2] because they are lightweight and exhibit a relatively high impact energy absorption, which is a consequence of their stable and highly reliable compressive strength (plateau-stress).
Metal additive manufacturing (AM) is one of the promising process technologies to manufacture lattice structures using metals and alloys. Powder bed fusion (PBF) involves using either a laser or an electron beam to fuse metal or alloy powder particles [3,4]. In particular, the selective laser melting (SLM) process combined with a powder-bed system has been widely used to build lattice structures [[5], [6], [7], [8], [9], [10]] from AlSi10Mg alloy (a commonly used Al alloy for metal AM technologies [11,12]). Extensive studies have reported the mechanical properties of bulk Al alloys built via SLM [[13], [14], [15], [16], [17], [18]]. Several recent studies have investigated the compressive properties of lattice-structured Al alloys [[5], [6], [7], [8], [9], [10]]. These results have demonstrated that SLM-built lattice structures exhibit unstable compressive stress with a series of peaks and troughs, which are unsatisfactory for a material used in structural parts of crumple zones [2]. These previous studies have focused on extrinsic factors (periodic structures or local porosities) observed in the SLM-built lattice structures as factors that contribute to their unstable compressive properties [[5], [6], [7], [8], [9], [10]]. However, as an intrinsic factor, microstructural inhomogeneity might provide preferential sites for crack initiation, resulting in fracture of a lattice structure. Few details are known about the interior microstructure of SLM-built lattice structures [19]. In previous works, we investigated the effect of sample size and geometry on the microstructural development of AlSi10Mg alloy parts built via SLM [20,21]. A local thermal effect near the boundaries between the melted and rapidly solidified regions exposed to the laser and the unmelted alloy powder particles was found to result in microstructural heterogeneity. The results of these previous investigations led us to speculate about the formation of inhomogeneous microstructure inside SLM-built lattice structures.
In the present study, to further elucidate the microstructure development during SLM processing, we examined the microstructural and crystallographic characteristics of the lattice structure of AlSi10Mg alloy built via the SLM process. The present microstructural characterizations were used in conjunction with our previous results [20,21] to evaluate dominant factors contributing to the observed microstructural characteristics of the SLM-built lattice structures of Al alloys.
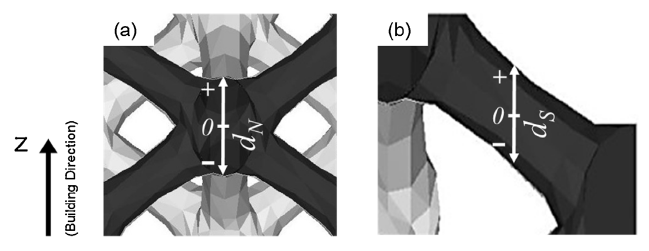
AlSi10Mg alloy powder [11] was studied in this work. The nominal composition of the alloy powder and measured composition (as analyzed by inductively coupled plasma-atomic emission spectrometry (ICP-AES)) are summarized in Table 1. Notably, the proportions of the major alloy elements (Si, Mg, and Fe) in the initial powder are almost the same as those in the SLM-built samples. The lattice structure samples were built at room temperature using an EOSINT M 280 AM system (EOS GmbH) equipped with a Yb-fiber laser (wave length: 1060 nm). The base plate heated to approximately 200 °C, was used to reduce the thermal gradient and stress of the built samples. The detailed laser processing parameters and the laser scanning pattern has been described in detail elsewhere [21]. In the present study, the directions normal and parallel to the bedded-powder layer are designated the Z direction and X/Y direction, respectively. The body-centered cubic (BCC)-type lattice structure was fabricated as a representative lattice structure to examine the microstructural and crystallographic characteristics of the lattice structures of AlSi10Mg alloy. Fig. 1 shows the computer-aided design (CAD) models of the BCC-type lattice structure and its unit cell. The BCC-type lattice structure sample was designed as a cylinder with a diameter of 30 mm and a height of 30 mm (Fig. 1(a)). The width and height of the unit cell of the BCC-type lattice structure were designed to be 4.2 mm, respectively, as illustrated in Fig. 1(b). The schematic showing a cross-section of the lattice structure in Fig. 1(c) indicates the area observed in the present study. The representative optical micrograph in Fig. 1(d) shows several node portions and strut portions of the lattice structure. To identify the location inside the node and strut portions, the distances from the centroids of node portion and strut portion were defined as dN and dS, respectively. The centroids of the node and strut portion were defined as original points. The direction along and against the building were defined as positive (+) and negative (-), respectively (Fig. 2).
Table 1 Chemical composition of the SLM-fabricated AlSi10Mg alloy samples (wt%).
| Sample | Si | Fe | Cu | Mn | Mg | Ni | Zn | Pb | Sn | Ti |
|---|---|---|---|---|---|---|---|---|---|---|
| Nominal | 9.0-11.0 | ≤0.55 | ≤0.05 | ≤0.45 | 0.20-0.45 | ≤0.05 | ≤0.10 | ≤0.05 | ≤0.05 | ≤0.15 |
| ICP analysis | 10.23 | 0.12 | - | - | 0.37 | - | - | - | - | - |
Fig. 1. CAD models of (a) the BCC-type lattice structure, (b) the corresponding unit cell, (c) the cross-section of the BCC-type lattice structure and (d) optical micrograph of the BCC-type lattice structure showing node portions and strut portions.
Fig. 2. Schematics showing (a) the node portion and (b) the strut portion of the lattice structure. The centroids of the node and strut portion were defined as the original points. The directions along and against the building direction were defined as positive (+) and negative (-), respectively. The distances from the original points of the node portion and strut portion were defined as dN and dS, respectively.
The sample surfaces for optical microscopies (OM) were mechanically polished and then electropolished with a solution of perchloric acid and ethyl alcohol, at a volume ratio of 1:9 at room temperature. In order to observe microstructures by using scanning electron microscope (SEM), cross-sections of each sample were ion-polished with a cross-section polisher at 6 kV. The relative densities of various portions were quantified by the porosities measured using a couple of optical micrographs of polished samples [21]. The microstructures were observed by OM and field-emission type SEM (FE-SEM). Electron backscatter diffraction (EBSD) analyses were performed at a step size of 2 μm to identify the orientations of microstructures. In order to observe microstructures by transmission electron microscope (TEM), the thin TEM samples were ion-polished at 6 V. The TEM characterizations and energy-dispersive X-ray spectroscopy (EDS) analyses were carried out at 200 kV. The hardness (HV) of the polished samples was measured using a Vickers indenter at a constant load of 9.8 N at ambient temperature.
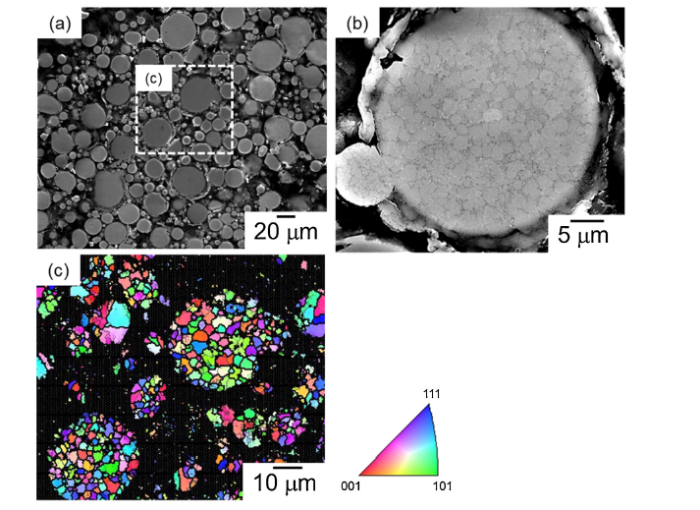
SEM images of the cross-section of AlSi10Mg powder particles are displayed in Fig. 3(a) and (b). Pores were scarcely observed inside the powder particles (Fig. 3(a)). Fine cellular microstructures consisting of primary fine Al phases surrounded by Si particles were observed inside the powder particles (Fig. 3(b)). The EBSD analyses (Fig. 3(c)) revealed numerous equiaxed grains (approximately 1-8 μm in grain size) consisting of the alloy particles studied.
Fig. 3. SEM images showing the cross-sections of AlSi10Mg powder particles at (a) low magnification and (b) high magnification and (c) orientation color map of the AlSi10Mg powder particles in (a).
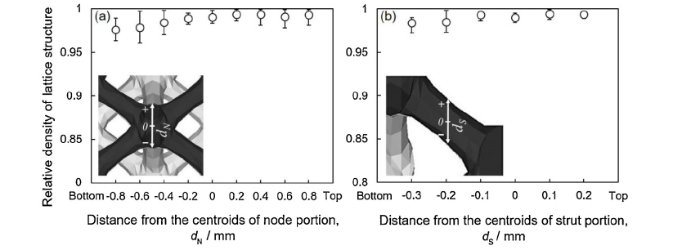
Fig. 4 shows the local relative densities plotted as functions of the distances from the centroid of the node portion (dN) and the strut portion (dS) of the investigated lattice structure. The relative density was quantified through the analysis of several optical micrographs of mechanically polished samples. In both the node and strut portions, the measured relative density is higher than 97%, whereas it is slightly lower near the bottom surface. In the node portion (Fig. 4(a)), the relative density is 99.3% at the location close to the top surface (dN = 0.8 mm) but decreases slightly to 97.6% at a different location near the bottom surface (dN = -0.8 mm). In the strut portion (Fig. 4(b)), the relative density slightly decreases from 99.4% to 98.4% at the location close to the bottom surface (dN = -0.3 mm). Notably, the observed deviations in the measured relative density (porosity) are approximately 1% in both the node and strut portions.
Fig. 4. Relative densities as functions of the distances from the centroids of (a) the node portion (dN) and (b) the strut portion (dS) of the lattice structure.
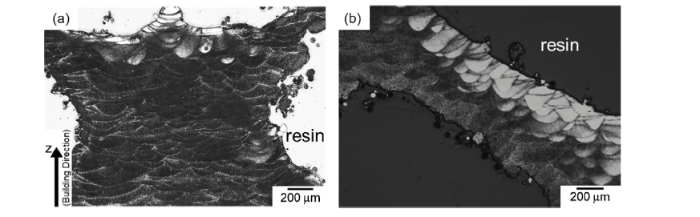
Fig. 5 presents OM images showing microstructures of electropolished samples. In both the node and strut portions, the observed microstructures consist of a number of melt pools with a mean height of approximately 170 μm. Relatively deep melt pools were observed near the top surfaces of both portions. These features characterized by melt pools correspond well to previous studies [3,4].
Fig. 5. Optical micrographs showing the microstructures in (a) the node portion and (b) the strut portion of the lattice structure.
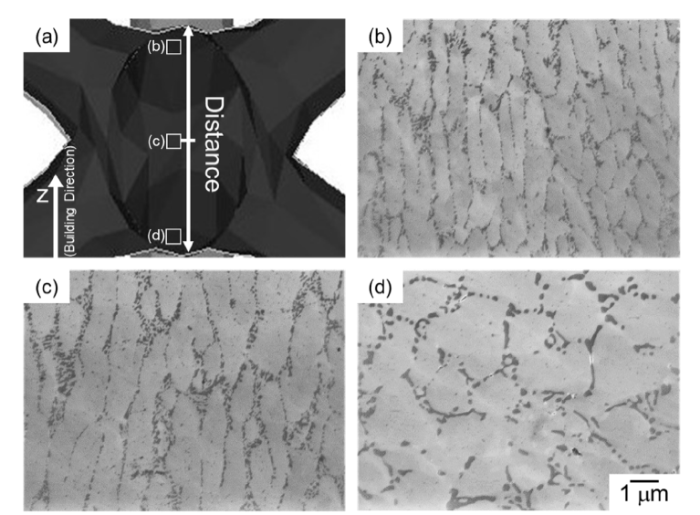
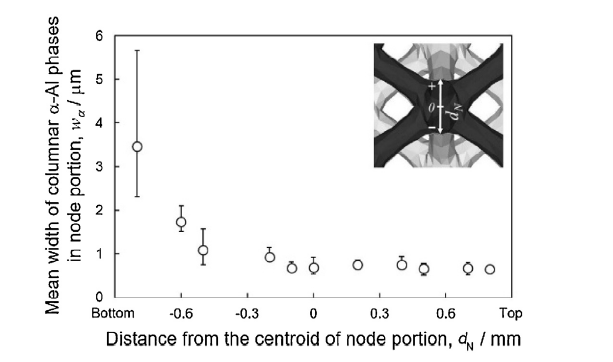
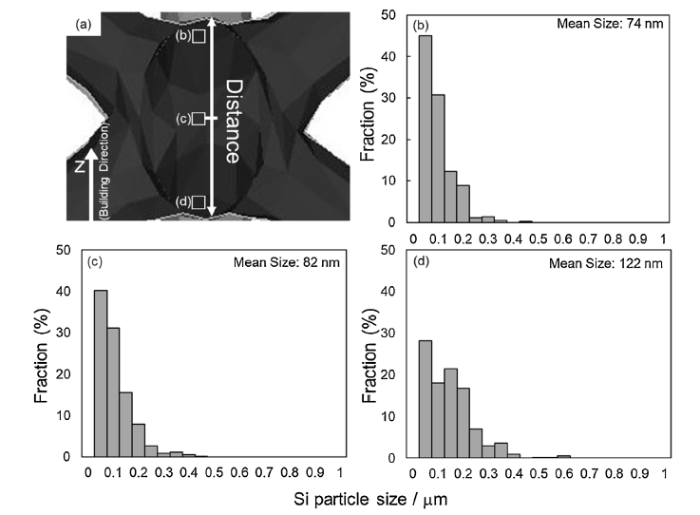
Fig. 6 presents SEM images showing microstructures observed at different locations in the node portion of the lattice structure. Cellular microstructures consisting of columnar α-Al phases with a mean width below 1 μm and surrounded by numerous fine Si particles were observed at the upper location (dN =0.8 mm, Fig. 6(b)) and center location (dN =0 mm, Fig. 6(c)). Most of the α-Al phases were elongated along the Z-direction. These microstructural characteristics have been previously observed in SLM-built bulk samples [14,22]. At the lower location (dN = -0.8 mm, shown in Fig. 6(d)), equiaxed α-Al grains with a mean size greater than 1 μm were observed. The size of Si particles appears larger at the lower location. The average width of columnar α-Al phases (wα) in the node portion was plotted as a function of the distance from the centroid (dN). The result is presented in Fig. 7. The value of wα was almost constant at approximately 0.8 μm from dN = 0.8 μm to dN = -0.1 μm, whereas it increased with decreasing dN when dN < -0.1 mm (corresponding to the lower location). Fig. 8 represents the size distribution of Si particles observed at different locations in the node portion. At the upper (dN = 0.8 mm, Fig. 8(b)) and center (dN = 0 mm, Fig. 8(c)) locations, the average size of Si particles was approximately 80 nm, whereas the average size increased to approximately 120 nm at the lower location (dN = -0.8 mm, Fig. 8(d)).
Fig. 6. (a) Schematic showing corresponding locations observed by SEM and (b-d) SEM images showing the microstructures in the node portion of the lattice structure with different distances from the centroid: (b) dN = 0.8 mm; (c) dN = 0 mm; (d) dN = -0.8 mm.
Fig. 7. Mean width of columnar α-Al phases in the node portion of the lattice structure as a function of the distance from the centroid (dN).
Fig. 8. (a) Schematic showing the corresponding locations in node portions of the lattice structure and (b-d) size distribution of Si particles in the node portion of the lattice structure with different distances from the centroid: (b) dN = 0.8 mm; (c) dN = 0 mm; (d) dN = -0.8 mm.
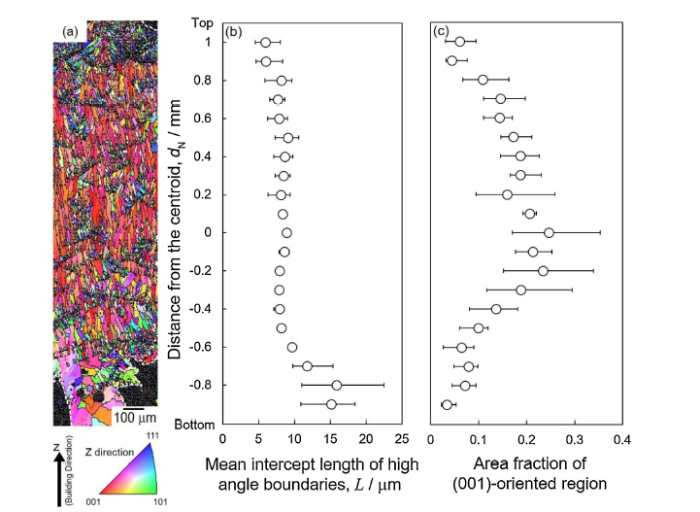
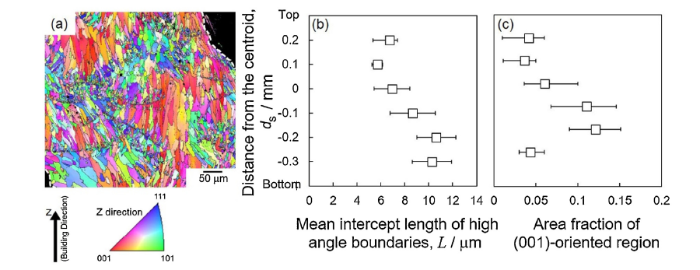
Fig. 9(a) shows an orientation color map for the α-Al (fcc) phase in the node portion of the lattice structure, as obtained from EBSD analyses. The orientation along the Z-direction is color-coded according to the color key in the unit triangle. The orientation color map shows that microstructure of the α-Al matrix comprises mostly elongated grains with mean widths ranging from approximately 5-20 μm. Finer and equiaxed grains were located around melt pool boundaries. Many elongated grains exhibited <001 > orientations along the Z-direction (red-colored area). It is noteworthy that relatively coarse α-Al grains were observed at the lower location near the bottom surface (dN < -0.5 mm). Substantially coarsened grains were localized in the irregular-shaped region close to the bottom surface (Fig. 9(a)). Note that the black areas near the top and bottom of the node portion are the porous portions of the lattice structure. The fine grains might be the unmelted powder particles detected behind the observed cross-section with low confidence index (CI) values and could be negligible. In order to quantify the varied microstructure of α-Al phase depending on the location of the node portion, a mean intercept length of high-angle boundaries was measured by EBSD analyses [14]. Assuming that the EBSD-analyzed areas are representative three-dimensional morphologies of the observed microstructures, the area corresponding to high-angle boundaries per unit volume, Sv, is equivalent to the total length of the high-angle boundaries per unit area. A relation between Sv and the mean intercept distance, L, can be described as Sv = 2/L, following quantitative microscopy [23]. This equation was utilized to quantify the mean spacing of the high-angle boundaries (equivalent to the mean grain size). Note that fine grains smaller than 2 μm were excluded for the evaluation of grain size. The quantified values of L plotted as a function of dN are presented in Fig. 9(b). The L value slightly increases from dN = 1 mm to dN = 0.8 mm. This trend is consistent with the difference in the width of columnar α-Al phases observed by SEM (Fig. 6(b) and (c)). The L value becomes almost constant at approximately 8 μm until dN = -0.5 mm. The present measured values correspond well to the evaluated L of bulk AlSi10Mg samples built by SLM [14]. Notably, the L value increases to approximately 15 μm at dN < -0.5 mm, corresponding to the observed coarse grains close to the bottom surface (Fig. 9(a)).
Fig. 9. (a) Orientation color map of node portion of the lattice structure, (b) the corresponding mean intercept length of high-angle boundaries (equivalent to the grain size) and (c) the area fraction of the (001)-oriented grains as functions of the distances from the centroids (dN) of node portions of the lattice structure.
To identify a change in the crystallographic texture depending on the location, the area fraction of the <001 > -oriented grains was measured using EBSD analyses. In the present study, the tolerated deviation was smaller than 15° from the <001 > direction along the Z-direction. A change in the analyzed area fractions is plotted as a function of dN in Fig. 9(c). The area fraction of the <001 > -oriented grains is approximately 5% at the location close to the top surface (dN > 0.9 mm), whereas it increases with decreasing dN. At the center location of the node portion (-0.3 < dN < 0.6 mm), the area fraction is as large as 20%. The area fraction decreases at the location near the bottom surface (dN < -0.3 mm), indicating the coarsened α-Al grains (Fig. 6(d)) with different orientations localized around the bottom surface of the node portion.
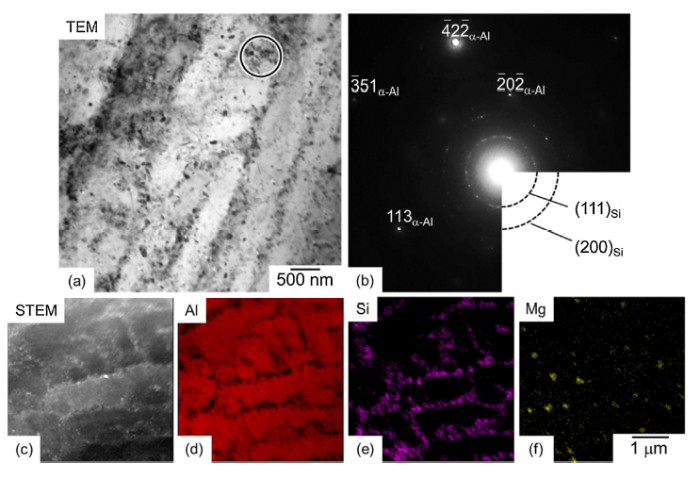
Fig. 10 displays a bright-field TEM image and high-angle annular dark field (HAADF) STEM image showing the microstructure within the columnar α-Al phases in the node portion. Several particles with several tens of nanometers in diameter were observed within the α-Al phases (Fig. 10(a)). The selected area electron diffraction (SAED) patterns (Fig. 10(b)) indicate the reflections derived from fine Si particles with diamond structure precipitated within the α-Al phases. The EDS chemical analysis revealed the presence of fine Si particles within the α-Al phase surrounded by fine eutectic Si particles (Fig. 10(e)). Notably, Mg segregated at the α-Al/Si eutectic microstructure (Fig. 10(f)).
Fig. 10. (a) TEM bright-field image showing the microstructure in the node portion of the lattice structure with the distance of dN = 0.8 mm from the centroid, (b) selected area electron diffraction (SAED) patterns of the circled area in (a), (c) STEM-HAADF image showing the microstructure and (d-f) the corresponding EDS element maps of Al, Si and Mg.
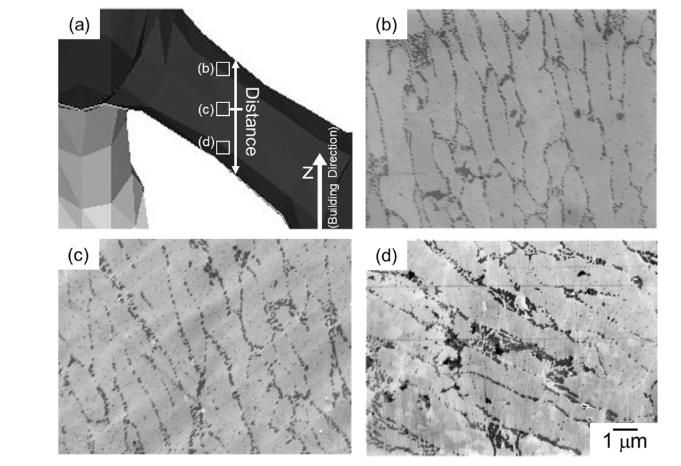
Fig. 11 displays SEM images showing microstructures observed at the different locations in the strut portion. The eutectic cellular microstructure consisting of α-Al phases surrounded by fine Si particles were observed in the strut portion as well. The columnar α-Al phases with a width of approximately 1 μm were observed at the upper location (dS = 0.2 mm, Fig. 11(b)) and center location (dS = 0 mm, Fig. 11(c)). A trend is observed that the columnar α-Al phases were elongated along the Z-direction (building direction). By contrast, relatively coarse columnar α-Al phases were observed at the lower location (dS = -0.3 mm, Fig. 11(d)). The elongated direction of the columnar α-Al phases appears parallel to the inclined direction of the strut portion. These results indicate a substantial effect of sample geometry on the development of microstructures around the bottom location of built parts.
Fig. 11. (a) Schematic showing the corresponding locations observed by SEM, (b-d) SEM images showing the microstructures in strut portions of the lattice structure with different distances from the centroid: (b) dS = 0.2 mm; (c) dS = 0 mm; (d) dS = -0.3 mm.
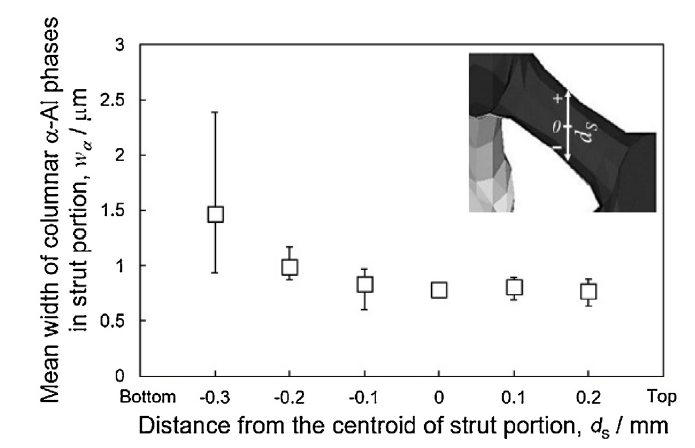
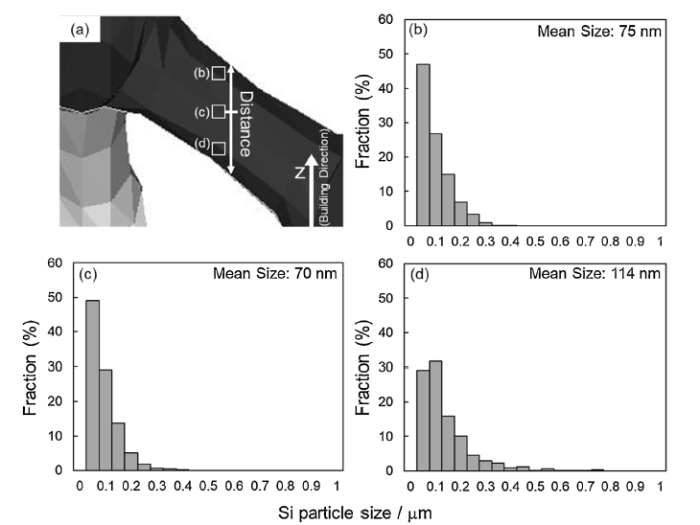
To quantify a change in size of the α-Al phases observed depending on the location of the strut portion, the widths of columnar α-Al phases (wα) were measured at various locations. The values of wα plotted as a function of the distance from the centroid are presented in Fig. 12. At the location with dS < 0.2 mm from the centroid, wα was almost constant at approximately 1 μm, which is the same as the wα value at the upper and center locations (dN < 0.8 mm) of the node portion. At the location close to the bottom surface (dS < -0.1), wα increases with decreasing dS. The large variation in the measured wα at dS = -0.3 mm is likely associated with the inhomogeneous microstructure developed around the bottom surface. Fig. 13 shows the size distribution of Si particles measured at different locations in the strut portion. The average sizes of Si particles were approximately 75 nm at the upper (dS = 0.2 mm, Fig. 13(b)) and center (dS = 0 mm, Fig. 13(c)) locations, whereas the average size was larger ($\widetilde{1}$15 nm) at the lower location (dS = -0.3 mm, Fig. 13(d)).
Fig. 12. Mean width of columnar α-Al phases in strut portions of the lattice structure as a function of the distance from the centroid (dS).
Fig. 13. (a) Schematic showing the corresponding areas in a strut region of the lattice structure and (b-d) size distribution of Si particles in strut portions of the lattice structure with different distances from the centroid: (b) dS = 0.2 mm; (c) dS = 0 mm; (d) dS = -0.3 mm.
Fig. 14 displays the results of EBSD analyses for microstructures of the α-Al matrix in the strut portion. The orientation color map (Fig. 14(a)) shows that the microstructure comprises mostly elongated grains, as observed in the node portion (Fig. 9(a)). At the location near the bottom surface (dS < -0.2 mm), the elongated direction is parallel to the inclined direction of the strut portion. Fewer <001 > -oriented grains (red regions) were observed in the lower location of the strut portion (dS < -0.2 mm). The mean intercept length of high-angle boundaries (L) measured at various locations in the observed strut portion is shown in Fig. 14(b). The L value is almost constant of approximately 7 μm until dS = 0 mm (corresponding to the upper and center locations), whereas it increases to approximately 10 μm in the lower location (dS < 0.1 mm). The coarsened microstructures were observed near the bottom surface of the strut portion as well as the node portion (Fig. 9(b)). Fig. 14(c) shows the area fractions of the grains along the Z-direction measured at various locations of the strut portion. The area of <001 > -oriented grains at the upper (dS > 0 mm) and lower (dS < -0.2 mm) locations was lower than that at the center location (0.1 < dS < -0.2 mm) of the strut portion. The trend was recognized in the node portion as well (Fig. 9(c)).
Fig. 14. (a) Orientation color map of the strut portion of the lattice structure, (b) the corresponding mean intercept length of high-angle boundaries (equivalent to the grain size) and (c) the area fraction of the (001)-oriented grains as functions of the distances from the centroids (dS) of the strut portions of the lattice structure.
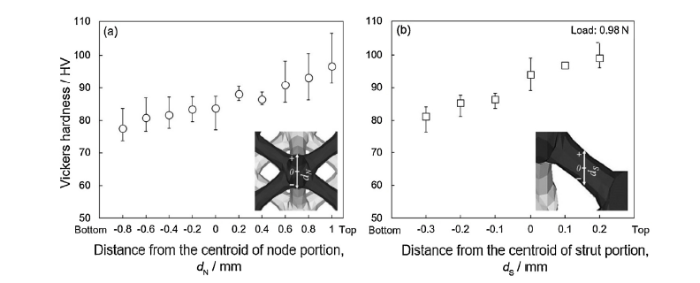
The microhardness values measured at different locations in both node and strut portions are summarized in Fig. 15. The hardness values plotted as functions of the distances from the centroids of the node portion (dN) and the strut portion (dS) are summarized in Fig. 15(a) and (b), respectively. In both the node and strut portions, the hardness decreases toward the bottom surface (corresponding to decreasing dN and dS). The average hardness was approximately 100 HV at the top surface, which corresponds well to the hardness values reported for plate-shaped samples built via SLM [20]. The hardness measured at the location of the bottom surfaces was approximately 80 HV and decreased with decrease dN and dS. The variation of the hardness depending on the location of the node and strut portions was attributed to the variation in the microstructure observed in the node and strut portions (Fig. 7, Fig. 12).
Fig. 15. Average hardness values as functions of the distances from the centroids of (a) the node portion (dN) and (b) the strut portion (dS) of the lattice structure.
The present study demonstrated microstructural variations of the major structural portions (node and strut portions) in the lattice structure of AlSi10Mg alloy built via SLM. One of the intriguing findings is a continuous change in microstructure (gradient microstructure) from the top surfaces to the bottom surfaces of the built portions (Figs. 6, 9, 11 and 14). In particular, at the locations near the bottom surface, the microstructural change appears to be more substantial, corresponding to the locally coarsened microstructure (e.g., Fig. 9). These results indicate a substantial effect of the bottom surface on the development of the coarsened microstructure. One of its dominant contributors is likely low thermal conductivity at the boundaries between the built (locally melted and rapidly solidified) portions and adjacent (unmelted) alloy powder. In general, the SLM process induces local heating of the built sample by laser irradiation. The provided heat could be released rapidly from the built parts with high thermal conductivity of 120-170 W m-1 K-1 [17] and then built parts was cooled at an extremely high cooling rate (approximately 105 K s-1 [24]). In contrast, the surfaces of the built portions are in partial contact with the surrounding particles of alloy powder, depending on the sample geometries built by SLM. Because the thermal conductivity of the alloy powder particles is much lower than that of the built parts [25,26], any contact with the alloy powder particles could reduce the efficiency of the heat flow paths inside the built parts, resulting in a lower cooling rate localized around the sample surfaces. Therefore, the sample geometries could strongly affect the local cooling rates inside the built parts controlled by surrounding surfaces adjacent to the alloy powder particles.
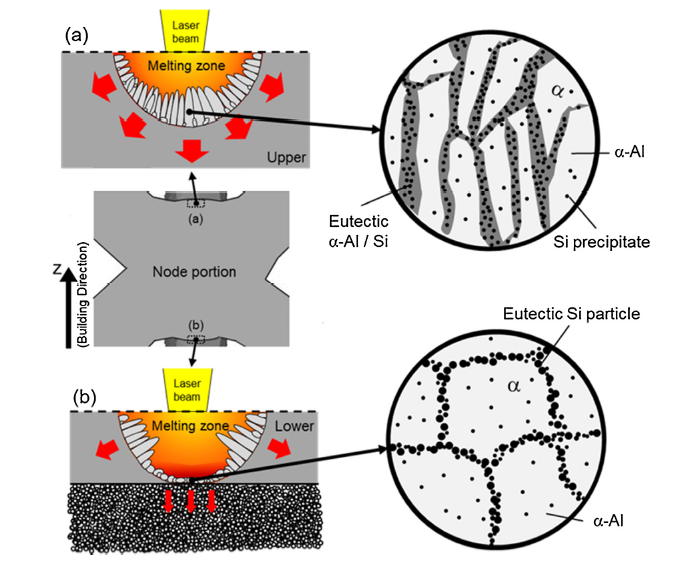
On the basis of the aforementioned discussion, a possible mechanism for the development of a gradient microstructure inside the structural portions of the lattice structure of AlSi10Mg alloy built by SLM is discussed below. The microstructural changes in (a) the upper location (dN=0.8 mm) and (b) the lower location (dN = -0.8 mm) of the node portions during the SLM process is shown schematically in Fig. 16. At the upper location of the node portions, supplied heat can be rapidly released into the previously fabricated regions with high thermal conductivities, resulting in the development of a fine solidification microstructure consisting of fine columnar α-Al phases under an extremely high cooling rate in melt pools (Fig. 16(a)). By contrast, coarser and equiaxed α-Al phases were observed at the lower location near the bottom surface (dN < -0.5 mm, Fig. 6, Fig. 7). The coarser and equiaxed phases could be due to the bottom surface being in contact with alloy powder particles, as illustrated in Fig. 16(b). The configuration at the lower location results in a lower heat removal capacity, reducing the local cooling rate. In addition, these locations would be reheated to elevated temperatures by subsequent laser irradiation of the upper bed-powder. The localized low cooling rate could enhance the formation of coarsened and equiaxed α-Al phases at the lower location (Fig. 6, Fig. 7). The significantly coarsened α-Al grains localized in the irregular-shaped region around the bottom surface (Fig. 9(a)) would be due to a much lower cooling rate inside the solidified region surrounded by large-area surfaces. These thermal effects controlled by sample bottom surfaces would become negligible as the solidified sample is built up (corresponding to the observed increase in dN), resulting in the development of a gradient microstructure in the node portions. The present result corresponds well to the previous report of gradient in microstructure at the surface area of bulk AlSi10Mg samples built by SLM [27], which can be rationalized using our proposed mechanism.
Fig. 16. Schematics of the microstructural changes in node portions of the lattice structure with different distances from the centroid: (a) dN = 0.8 mm; (b) dN = -0.8 mm. The red arrows indicate the direction of heat flow.
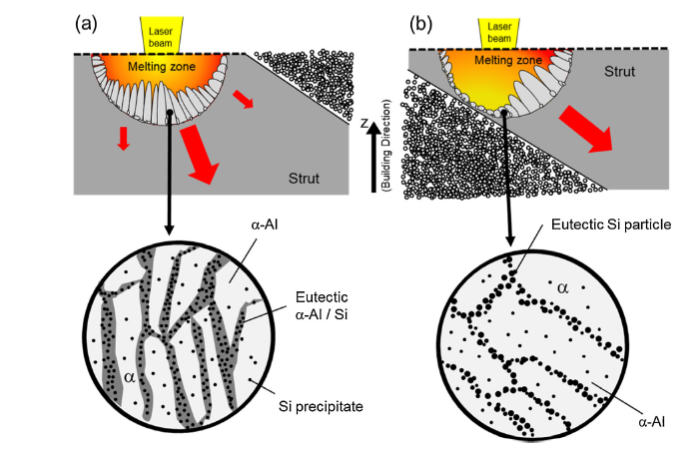
The proposed mechanism could be used to explain the development of gradient microstructures in the strut portions. The elongation of columnar α-Al phases was found to depend on the incline direction of strut portions (Fig. 11). The inclined direction of α-Al phase appearance more strongly affected at the lower location (Fig. 11(d)). In addition, the gradient change in the microstructural features was attributed to the thermal effect controlled by the bottom surface. The development of varied microstructures in the strut portion during the SLM process is shown schematically in Fig. 17. At the upper location in the strut portion, the provided heat can be rapidly released into the previously fabricated regions, resulting in fine columnar α-Al phases in the melt pools (Fig. 17(a)). These elongated directions correspond to the solidification direction of the α-Al phase during the SLM process. At the lower location, the bottom surface could be in contact with unmelted alloy powder particles with low thermal conductivities, limiting the heat flow path. Consequently, the supplied heat would flow preferentially into the previously fabricated strut portion, resulting in a preferential solidification direction along the inclined strut (Fig. 17(b)). The limitation of the heat flow path leads to a lower cooling rate, which facilitates coarsening of the α-Al phase elongated in the longitudinal direction of the strut portion (Fig. 11(d)). The varied solidification directions correspond well to the change in the <001 > texture depending on the location of the strut portion (Fig. 14(c)). This change in texture is attributed to the <001 > preferential solidification direction of the α-Al phase along the heat flow direction [28,29]. At the locations around the top surface of the strut portions inclined to the building direction, the heat flow path might be limited by surrounding alloy powder particles. The limited heat flow could control the solidification direction around the top surface as well, contributing to the reduced <001 > texture at the location near the top surface (Fig. 14(c)). These results and discussion lead to the conclusion that the development of gradient microstructures in the lattice structure of Al alloys built by SLM can be explained by local thermal effects caused by surrounding surfaces in contact with alloy powder particles. The effect could depend on the geometries and size of the fabricated samples. It is noteworthy that a gradient microstructure has also been observed in the strut portions of the lattice structure of Cu alloys [30]. The present proposed mechanism provides insights to control local microstructures in the different portions of cellar-lattice structures of not only Al alloys but the other fcc alloys (e.g. Ni and Cu).
Fig. 17. Schematics of the microstructural changes in strut portions of the lattice structure with different distances from the centroid: (a) dS = 0.2 mm; (b) dS = -0.3 mm. The red arrows indicate the direction of the heat flow.
The variation in the local hardness depending on the locations of the node and strut portions (Fig. 15) could be attributed to the developed gradient microstructure. The change in size of the primary solidified α-Al phase (Fig. 7, Fig. 12) appears synchronized with the variation of the measured hardness (Fig. 15). The reduced hardness corresponds well to the location in which the coarsened α-Al phase was observed due to the local thermal effect caused by surrounding surfaces in contact with alloy powder particles. The coarsened α-Al phase including fine Si precipitates (Fig. 6, Fig. 11) may form through the solidification at a relatively slower cooling rate (Fig. 16) or reheating to elevated temperatures by subsequent laser irradiation of the upper bed-powder. The observed microstructural features were in reasonably good agreement with microstructures of SLM-fabricated AlSi10Mg bulk samples heated at elevated temperatures [14], whereas there is still an issue about the reason for the low hardness of α-Al grains with a number of fine Si precipitates. Thus, further investigations will be required to understand a dominant microstructural parameter for strengthening of the SLM-fabricated AlSi10Mg parts.
The issue concerning the effect of gradient microstructures on the compressive properties of the lattice-structured AlSi10Mg alloy remains unresolved. The gradient microstructure can enhance the localized deformation of the structural parts under compression. Localized fractures have been reported at the strut portions in the lattice structure have been reported [[6], [7], [8], [9]], resulting in unstable compressive stress with a series of peaks and troughs. The intrinsic (microstructural) effect on the compressive properties of the SLM-fabricated lattice structure remains unclear. To clarify this effect, the gradient microstructures should be controlled via subsequent heat treatments, whereas previous studies on the compression response of the heat-treated lattice structure of AlSi10Mg alloy fabricated by SLM have been scarcely reported. Thus, further investigations of microstructures controlled by heat treatments will be required before SLM-fabricated lattice structures of lightweight Al alloys can be used for structural parts of crumple zones.
In this study, the BCC-type lattice structure of AlSi10Mg alloy was built via SLM process. A gradient microstructure was found in the major structural portions (i.e., the node and strut) of the fabricated lattice structure. The results are summarized as follows:
(1)Characteristic microstructures comprising melt pools with several columnar α-Al phases with <001 > orientations along the elongation direction and surrounded by eutectic Si particles were observed in both the node and strut portions.
(2)A gradient microstructure (a continuous change in microstructure) was observed in both portions. The columnar α-Al phases were observed around the top surface. However, they became coarser and more equiaxed toward the bottom surface. The microstructural gradient resulted in softening localized around the bottom surface, which is likely a consequence of varied cooling rates resulting from the lower thermal conductivity of the unmelted powder particles in contact with built regions.
(3)In the strut portion, the α-Al phases were elongated along the incline direction of struts. This trend was more prevalent near the bottom surface. The α-Al grains also became coarser and more equiaxed near the bottom surface. The change in microstructure can be rationalized by local cooling rates of the fabricated parts controlled by surrounding surfaces adjacent to the alloy powder particles.
The support of the “Knowledge Hub Aichi” a Priority Research Project of Aichi Prefectural Government, Japan is gratefully acknowledged. We are grateful for the sample preparation provided by Mr. H. Tauchi of White Impact Co., Ltd.

 WeChat
/
| 〈 |
|
〉 |
