Search for articles:
Zihao Yuan
Corresponding authors:
Received: 2019-03-14
Revised: 2019-04-19
Accepted: 2019-04-22
Online: 2019-09-20
Copyright: 2019 Editorial board of Journal of Materials Science & Technology Copyright reserved, Editorial board of Journal of Materials Science & Technology
More
Abstract
Skin layer is a characteristic microstructure of aluminium die castings, which would effect the surface blistering during solution treatment. In this study, the microstructures of skin layer were investigated by the methods of optical microscope (OM), scanning electron microscope (SEM) and electron probe micro-analyzer (EPMA). High resolution X-ray CT was used to compare the skin layer with normal surface before and after solution treatment. With the aid of computational fluid dynamics (CFD), the formation mechanism of the skin layer was discussed based on microstructure distribution, solute segregation, porosity distribution and surface blistering. The results suggested that the skin layer is related to a succession of complex processes before the filling process finished. Pore clusters or laminar defects would be formed in skin layers during solution treatment and cause severe surface blistering.
Keywords:
Die casting is one of the most economical processes for massive production of high precision components in industry [1]. Highly turbulent flow of semi-solid melt, fast cooling rate [[2], [3], [4], [5]] and rigid constraint during solidification make it difficult to understand the formation mechanism of casting defects, including band-like distributions of gas pores, shrinkage porosity [6,7], macro-segregation [8,9] and skin layer [10,11].
In a die casting, a skin layer is formed at the casting surface and exhibits different microstructure features from its adjacent region. Because of distinct microstructure, mechanical properties and unique location, the surface region has a great influence on the performance of the die casting components. Detailed characterization of the surface generates better understanding on the constitutive behavior [12,13] and the yielding behavior [14,15] of the die casting components. The fatigue behavior was found to be dominated by the existence of the sub-surface micro-pores [16]. Finite element simulations indicated that the porosity near the surface could induce fracture strain when a component is subjected to a tensile load [17]. The surface also influences the bending performance [18,19] due to the non-uniform stress distribution across the cross-section of the die casting.
As a kind of abnormal surface, the formation mechanism of skin layers attracted attentions of some researchers. Chen [10] designed two special molds to investigate different types of surface microstructure in a Al-11Si-2Cu-1Fe die casting. The skin layers were found in the locations where the flow impingement was not direct. The researcher concluded that the formation of skin layer was attributed to the solidification with the relatively lower die temperature and short-time intensification pressure before “gate blockage”[20]. Otarawanna et al. [11] studied the skin-layer edge (the band-like region between the skin layer and the inner regions) of a AlMg5Si2Mn alloy die casting and attributed it to the shear between the outer stagnant layer and inner moving layer during filling process and intensification process.
Avoiding blistering is one of the key issues of heat treatment of die castings. The intensification pressure would be exerted on the entrapped air through the melt. The volume of gas pores would be compressed by up to 1000 times during intensification under a metal pressure of 100 MPa before solidification [21]. The high pressure gas pores, especially those close to the surface of die castings, tend to expand when exposed at high temperature [22,23]. Ozhoga-Maslovskaja et al. [24] simulated the development of blisters using FEM with consideration of aspect ratio, ligament thickness and pore pressure. Lumley et al. [25] thought that a thin laminar defect (see Fig. 1) of sub-surface was responsible for a significant proportion of blisters in an A380 alloy during solution treatment.
Fig. 1. An expanded laminar defect leading to blistering in an A380 alloy die casting solution treated 20 min at 490 °C [
However, the feature of the skin layer in a A380 aluminum alloy die casting has not been reported. The skin layer has different blistering behaviors from a normal surface during solution treatment. In this study, the skin layer of a A380 aluminum alloy die-casting bar was characterized to investigate its microstructure, solute segregation and porosity. New facts of the skin layer were revealed. The filling process was also simulated, which showed that the skin layer of the die casting is due to melt chilling during filling.
A commercial A380 aluminum alloy was used in this study and the ICP test result is shown in Table 1. The solidification temperature range is 540-595 °C [26]. Prior to casting, the melt was degassed with Ar for over 15 min at 730 °C to conform with established foundry practices.
Table 1 The composition of the A380 alloy used in this study.
| Elements | Si | Cu | Fe | Mn | Zn | Ni | Mg | Al |
|---|---|---|---|---|---|---|---|---|
| wt% | 8.67 | 3.27 | 0.82 | 0.42 | 2.57 | 0.03 | 0.08 | balance |
Die castings were produced using a TOYO BD-350V5 cold chamber die casting machine, with key processing parameters listed in Table 2. The first 15 shots were made before the samples were produced to obtain quasi-steady-state thermal conditions in the shot sleeve and the die. Circulating oil (around 120 °C) was utilized to maintain the die temperature at a certain level. Fig. 2a shows the configuration of the casting, which comprised three bars and one 170 mm × 30 mm × 2.5 mm plate. The gauge length of the bar was 50.8 mm. The diameter within the gauge length was 6.35 mm. Detailed information on the tensile test bar is shown in Fig. 2b. The semi-circle gates of the bars were made at the moving side of the die (see the inset in Fig. 2a), with a diameter of 7.5 mm. The solution treatment was performed at 490 °C for 15 min or 30 min.
Table 2 Key processing parameters during HPDC.
| Parameters | Value |
|---|---|
| Melt temperature | 680 °C |
| Slow shot speed | 0.15 m/s |
| Gate speed | around 60 m/s |
| Intensification pressure | 79 MPa |
Fig. 2. (a) The specific die casting employed in the high pressure die casting experiment. (b) Configuration of the tensile test bar used in the present study.
The X-ray tomography experiment was performed using a CT machine namely phoenix nanotom|m manufactured by GE. The voltage and electric current were selected as 100 kV and 110 μA, respectively. With a resolution of 7.5 μm, bars were scanned and reconstructed to study the distribution of the skin layer. To observe the pores, segments containing skin layer were cut using an electrical discharge machining and scanned with a resolution of 2.5 μm or 0.667 μm. The skin layers were characterized before and after solution treatment.
All the macro-/micro-graphs shown in this article were obtained within the gauge length of tensile bars. In order to reveal the microstructure distribution and morphology, polished cross-sections were chemically-etched with 0.5 vol% HF and observed with OM and SEM. The solute concentration of the skin layers were characterized using EDS and EPMA.
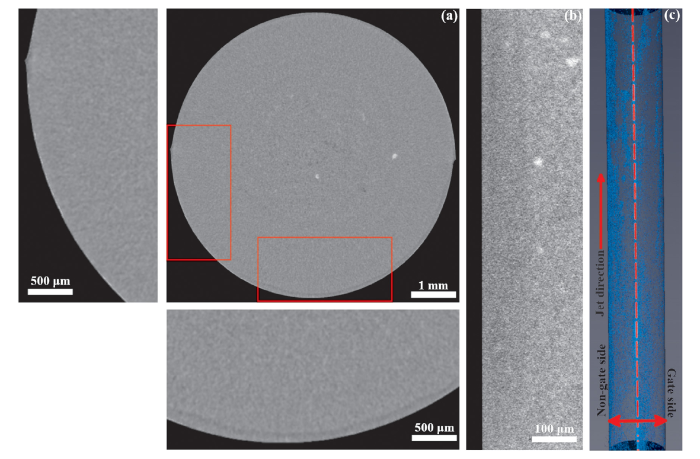
The intensity of the reconstructed CT images reflects the density contrast in a component. In other words, a brighter color designates the heavier elements while a darker designates the lighter.
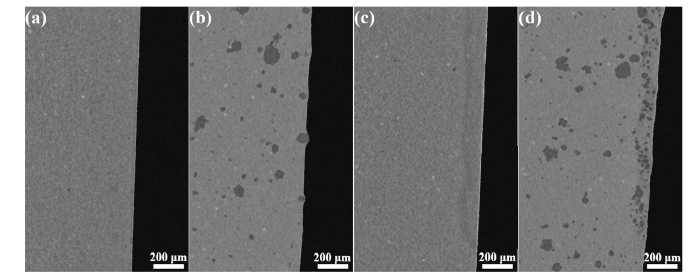
A dark band could be identified near the surface from the reconstructed cross-section (see Fig. 3a). The width of this dark band ranged from 80 μm to 150 μm. Brightness was not uniform in the dark band. Some dark bands were wide and diffuse (see Fig. 3b), while others were narrow and clear (see Fig. 3a). The brightness at the dark band edge was even lower. To further reveal the structure inside the dark band, the dark band was cut from the bar and scanned with a resolution of 0.667 μm (see Fig. 3b). Based on the finer scanning, many black spots could be recognized. Those black spots usually displayed as several black pixels in the images, indicating micro-pores with diameters of less than 3 μm. The white points were α-Al grains and eutectic Al2Cu in Fig. 3b while the bigger bright objects were α-Al15(Fe,Mn)3Si2.
Fig. 3. Density distribution of the bar within the gauge length. (a) A reconstructed cross-section with a resolution of 7.5 μm. (b) A reconstructed skin layer with a resolution of 0.667 μm. (c) Distribution of skin layer within the gauge length of a tensile bar.
The dark bands distributed widely in the tensile bars. Fig. 3c shows the distribution of the dark bands within the gauge length of a tensile bar. There were more dark bands at the non-gate side than at the gate side. Besides, the lower half contained more dark bands. Some dark bands were spiral upward.
Fig. 4 shows microstructure of a cross-section of the segment with dark bands in Fig. 3. The bright represents α-Al grains while the dark represents eutectic phases and porosity. Fig. 4 confirmed that the dark bands (see Fig. 3) were the skin layers reported by previous literature [10,11]. Skin layer, which mostly located where the melt impingement was indirect, was not continuous in a casting. That was in accordance with Refs. [10,11].
Fig. 4. Microstructure contrast between (a) skin layer and (b) normal surface.
As shown in Fig. 4, the as-cast microstructure comprised primary α-Al grains with an equiaxed morphology surrounded by eutectic phases and porosity. The normal surface exhibited no clear boundary with the inner region (see Fig. 4b). As a contrast, the skin layer with a clear boundary exhibited denser and finer α-Al dendrites (see Fig. 4a). Adjacent to the skin layer, the dark microstructure in the sub-skin region (see Fig. 4a) was generally the microstructure rich in eutectic phases, which was similar to the normal surface microstructure (see Fig. 4b) with chilling feature. The skin layer seemed to be attached to the normal surface.
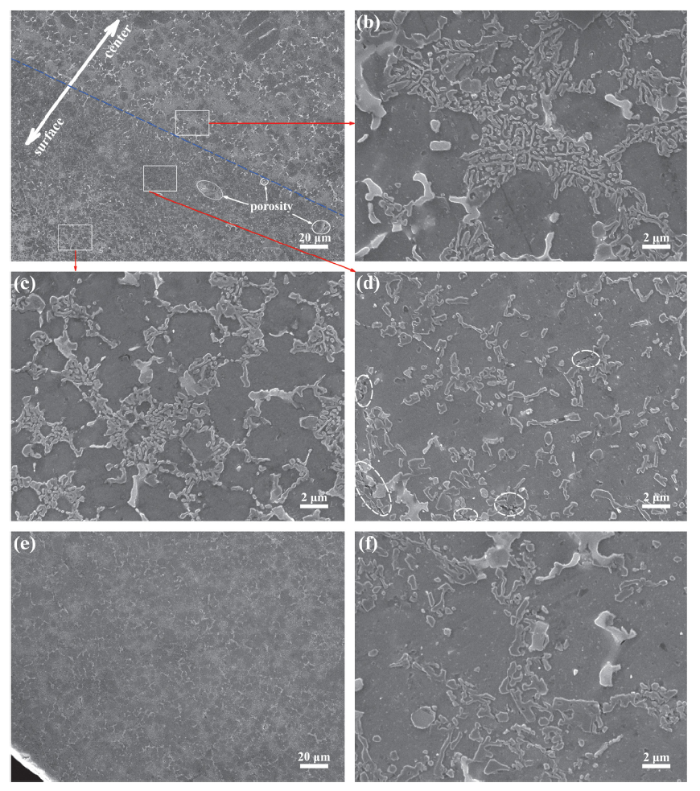
Fig. 5 shows the SEM images in the region from skin layer to sub-skin region. The blue dash line (see Fig. 5a) marks the border between the skin layer and the sub-skin region according to microstructural morphology. There were two sub-layers in the skin layer (see Fig. 5a). The outer sub-layer of the skin layer (represented by “OSL” below) was around 80 μm in width while the inner sub-layer of the skin layer (represented by “ISL” below) was 20-40 μm in width. The border between OSL and ISL was diffuse. The OSL contained finer and worm-like eutectic silicon (see Fig. 5c) while the ISL contained coarser and granular/blocky eutectic silicon (see Fig. 5d). The eutectic silicon close to the edge of sub-skin region (represented by “SSR” below, see Fig. 5b) exhibited a worm-like morphology, which was similar to the OSL (see Fig. 5c) but the size. The SSR (Fig. 5b) was about hundreds of microns wide towards the center, just like the normal surface microstructure (see Fig. 5e). The worm-like eutectic silicon at the SSR edge (see Fig. 5b) gradually changed to granular or blocky at the central region of the bar (see Fig. 5f).
Fig. 5. Structure of the skin layer. (a) Overview of the transitional region between the skin layer and the sub-skin region. (b) Sub-skin region (SSR). (c) Outer sub-layer of the skin layer (OSL). (d) Inner sub-layer of the skin layer (ISL). (e) Normal surface. (f) Central region of the bar.
The skin layer contains porosity (as marked in Fig. 5a), especially the ISL. Those pores were the sub-surface micro-pores that were reported to be predominant in fatigue crack initiation [16], fracture strain [17] and bending performance [18,19]. The size ranges from 1 μm to 10 μm. Fig. 5 confirms that the black spots in Fig. 3c were micro-pores. In a magnification view (see Fig. 5d), more micro-cracks exhibited (marked by circles), indicating stress and deformation. Those micro-cracks were 1 μm-5 μm in length and around 0.1 μm in width, which could not be captured in the CT images. But the presence of these cracks lowered the local density and contributed to the formation of dark bands. The lower brightness of dark band edge in Fig. 3a resulted from more porosity and micro-cracks in ISL (see Fig. 5a and d).
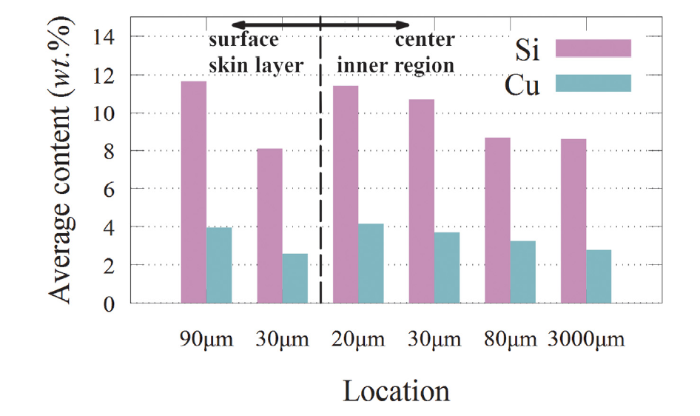
Fig. 6 shows the concentration variation of alloy elements from the outer skin layer to the center of the tensile bar. The vertical blue dash line represents the border between the skin layer and the SSR (see Fig. 5a). Regions of 20 × 20 μm2 were selected to calculate the average content of Si and Cu. The left two groups marked as 90 μm and 30 μm represented the average element content of OSL (see Fig. 5c) and ISL (see Fig. 5d), respectively. The right four groups demonstrated the average element contents of the inner region. The OSL contains higher concentrations of elements than these of the ISL. The element concentrations increased steeply at the border and then decreased towards the center, which was the same as that of the normal surface.
Fig. 6. Composition distribution from the surface to the center of the bar.
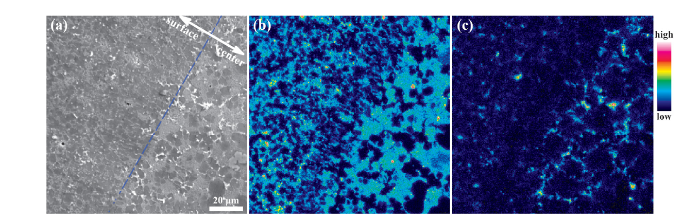
Fig. 7 shows the concentration distributions of Si and Cu near the border between the skin layer and the sub-skin region. This region was 120 × 120 μm2 and the image resolution was 0.4 μm. Between the SSR and the OSL, the ISL exhibited as a band with relatively lower concentrations of Si and Cu. This was consistent with the result of EDS (see Fig. 6). The content transition from the OSL to the ISL was rather diffusing while the transition close to the border was sharper.
Fig. 7. Distribution of element concentration obtained by the method of EPMA. (a) SEM image. (b) Si distribution. (c) Cu distribution.
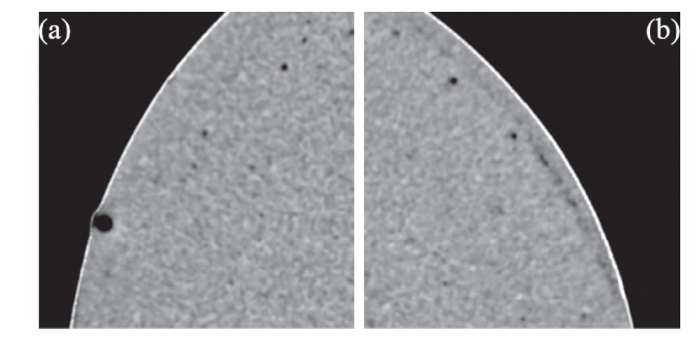
Fig. 8 shows the same locations of a normal surface and a skin layer before and after solution treatment. The blistering of normal surface resulted from the isolate gas pores expanding into large hemispherical bulges (see Fig. 8a-b). For the surface with a skin layer, the gas pores in SSR (see Fig. 8c) grew into a huge spheroidal bubble (see Fig. 8d). The dark band (see Fig. 8c) turned into a band full of pores after solution treatment (see Fig. 8d). It is clear that the number of irregular gas pores was much lower than that of the black spots in the dark band (see Fig. 8c), indicating merging of micro-pores during the solution treatment. The merging could also lead to laminar gas pores (see Fig. 9) parallel to the bar outline, which were very similar to the laminar defect reported in the literature [25] (see Fig. 1). The laminar gas pores, which was 10 μm-20 μm in thickness while several millimeters in length, existed where the dark bands were narrow and clear (see Fig. 3a) before solution treatment.
Fig. 8. Surface blistering during solution treatment of 30 min at 490 °C. (a-b) for the normal surface, (c-d) for the skin layer. (a) and (c) for the die-cast bar, (b) and (d) for the same locations after solution treatment. The CT resolution was 2.5 μm.
Fig. 9. Laminar gas pores after solution treatment, which was very similar to
The change of porosity during solution treatment of 30 min at 490 °C is revealed by reconstructing CT images with a resolution of 0.667 μm (see Table 3). ISL always contained most porosity before and after solution treatment. The SSR exhibited less porosity than the OSL before solution treatment. However, the expansion time of pores in SSR was larger and accordingly its porosity exceeded that of OSL after solution treatment.
Table 3 Porosity in different regions.
| Region | Before solution treatment | After solution treatment | Expansion time |
|---|---|---|---|
| OSL | 1.34% | 4.05% | 3.02 |
| ISL | 2.50% | 14.6% | 5.84 |
| SSR | 0.74% | 5.54% | 7.49 |
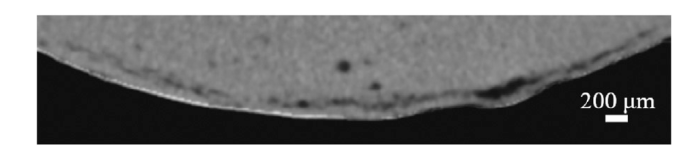
Fig. 10 shows the surface of the sample after a solution treatment at 490 °C for 15 min. The normal surface exhibited blisters due to the expansion of gas pores under the surface. However, the surface with the presence of skin layer did not exhibit blisters due to less expansion in OSL. Besides, the size of gas pores under the skin layer exceeded that of the pores in skin layer. The gas pores in normal surface and SSR expanded faster than these in skin layer.
Fig. 10. Blistering after solution treatment of 15 min at 490 °C. (a) Normal surface, (b) skin layer. The CT resolution was 7.5 μm.
The Weber number [27] is a non-dimensional number that represents the ratio of the fluid inertia to the surface tension:
$We=\frac{\rho U^{2}}{\sigma / l}$ (1)
Where ρ is the density of the melt, namely 2460 kg/m3; U is the velocity component normal to the free surface, namely 60 m/s; l is the minimum width of the flow channel (the radius of gate here), namely 0.00375 m; σ is the surface tension coefficient, namely 0.77 J/m2.
The free surface of a flow would be torn if the Weber number is greater than 1. It has been observed experimentally that a free surface breaks up into small droplets when the Weber number exceeds a critical value of 60 [28]. The Weber number was estimated to be around 43,130 here, much larger than the critical value. The large Weber number, the huge kinetic energy, the entrapped air in gating system, combined with large perturbations of the flow at the gates due to friction and surface roughness, would result in severe flow atomization [29].
The information on flow patterns is a prerequisite of analysis because it is the carrier of heat and mass. The software Flow-3D was used to simulate the filling process to reveal the high-resolution flow patterns and air entrapment. In order to reveal the detail of the jet, the mesh size was set as 0.15 mm, which was around 1/4 of the difference between the gate radius (3.75 mm) and the radius (3.175 mm) of the bar within gauge length (see Fig. 2). The k - e two-equation model was chosen as the turbulent model.
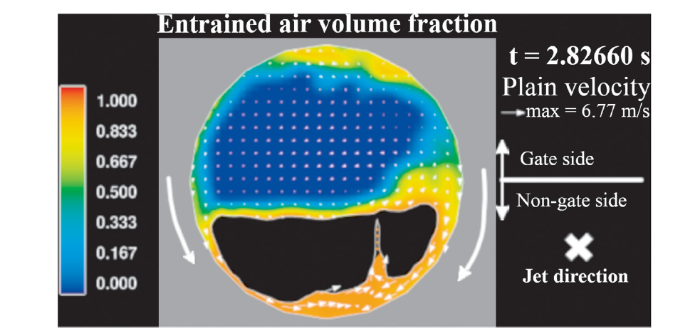
Fig. 11 shows the flow pattern and the air entrapment of the rightmost bar (Fig. 2a) during filling. The front of the jet began to entrap air as soon as it rushed out of the gate at 2.82465s (see Fig. 11a). Within less than 1 ms, the jet began to be dispersed (see Fig. 11b) and the local entrained air volume fraction was very close to 1, indicating the high atomization at the free surface of the jet. After that the jet impinged on the moving side of the die and splashed (see Fig. 11c). Due to the inertia the jet continued to rush upward with its bulking forepart in contact with the die wall at the non-gate side (see Fig. 11d). During that process the melt was spread over the inner surface of the die. A thin film of melt was adhered to the die wall. Behind the forepart the mainstream of the jet was relatively thinner and lost contact with the non-gate side (as circled in Fig. 11e).
Fig. 11. Contour of the entrained air volume fraction at a series of moments during filling the rightmost bar in
There was another path for the melt to form a thin film adhering to the die wall at the non-gate side during filling process. Fig. 12 shows a cross-section (see the dash line in Fig. 11e) of the flow pattern. Some melt would flow spirally against the die wall from the gate side to the non-gate side when the jet rushed upwards. That tangential velocity could be 2.5-20 m/s at the non-gate side within the gauge length.
Fig. 12. Contour of the entrained air volume fraction of a cross-section of the bar (see
The jet rushed through the gauge length towards the top of the cavity (see Fig. 11f and g). Then the backward flow went down against the non-gate side (see Fig. 11h) and filled the rest cavity (see Fig. 11i). The gate side received more violent flush than the non-gate side during the whole filling process.
There were at least 3 stages of temperature drop before the solidified shell was formed at the inner surface of the die.
Firstly, the melt that contacted the shot sleeve would cool rapidly to the liquidus temperature (595 °C [26]). Previous study [30] revealed that the superheated melt begins solidification within 0.67 s after it is poured into the shot sleeve and impinges the cold sleeve wall and the plunger. Some researchers investigated the solid fraction when the melt leave from shot sleeve, the estimated value was 43% in [31]. The melt temperature would decrease further during the slow-shot stage. It took around 3 s before a mixture of externally solidified crystals (ESCs) and melt was injected into the die cavity.
Secondly, as discussed, the semi-solid melt would break up into a stream of micro-droplets after filling into the open space of the die cavity. The severely dispersed flow with micro-droplets experienced a rapid thermal exchange process with the cool air due to the vast surfaces exposed to environment. The cooling rate depends on the diameter of each single droplet. For example, it could be 0.4-1 × 10⁴ K/s according to [32,33] for the droplets with mean diameter of 80 μm. It took about 1 ms-3 ms (see Fig. 11a-c) before the flow with micro-droplets impacted and deposited on the inner surface of cavity, thus the temperature drop during the flight could not be ignored.
The third stage of temperature drop occurred at the surface of the die cavity. The die was cold as the substrate for the severely dispersed flow and micro-droplets to deposit. The impingement must result in a high heat transfer to the die. Our previous study [2] revealed that the interfacial heat transfer coefficient could be over 20 kW/(Km2). For an approximation, the heat flux could be equated to the rate of heat released due to the latent heat of solidification. Accordingly the thickness of the solidified metal shell could be estimated as:
$S=h\frac{T_{melt}-T_{die}}{\rho L(1-f_{s})}t$ (2)
Where h is the interfacial heat transfer coefficient, namely 2.0 × 10⁴ kW/(Km2) [2]; Tmelt is the temperature of the melt at free surface; Tdie is the temperature of the die wall, namely 120 °C; fs is the solid fraction of the melt at free surface; ρ is the density of the metal, namely 2700 kg/m3; L is the latent heat, namely 3.89 × 10⁵ J/kg; t is the time for solidifying.
On a very conservative estimate, half of the melt in micro-droplets or at the free surface of the flow had solidified (fs = 0.5), thus the temperature of the droplets (Tmelt) would be around 560 °C. The time interval between the depositing and the backward flow covering is around 6 × 10⁻³ s (see Fig. 11). Accordingly Eq. (2) estimated that the thickness of solidified shell is around 100 μm. This thickness had exceeded the width of the OSL and roughly equals to the thickness of the skin layer in Fig. 5. The non-dimensional time for thermal diffusion, i.e. Fourier number, is defined as Fo=αt/S2 and estimated to be around 21, where α is the thermal diffusivity of the melt (around 3.5 × 10⁻⁵ m2/s [34]). Thus the time 6 × 10⁻³ s was long enough to occur a substantial temperature drop within such a thin film.
As calculated with Eq. (2), a deposit layer of around 100 μm almost finished solidification when it was covered by the backward flow (see Fig. 11h). The unsolidified part of the deposit layer would be flushed away by the backward flow. There was little mix between the solidified part of the deposit layer and the backward flow thus a clear boundary could be recognized between them (see Fig. 4a). The following solidification of the backward flow had no difference with the normal surface.
However, on the gate side of the die, a deposit layer with stagnant solid phase was much harder to form due to the violent flush of melt all the time during the filling process. Besides, the entrapped air was also much less at the gate side. Thus the bar at gate side contained much less skin layers than the non-gate side.
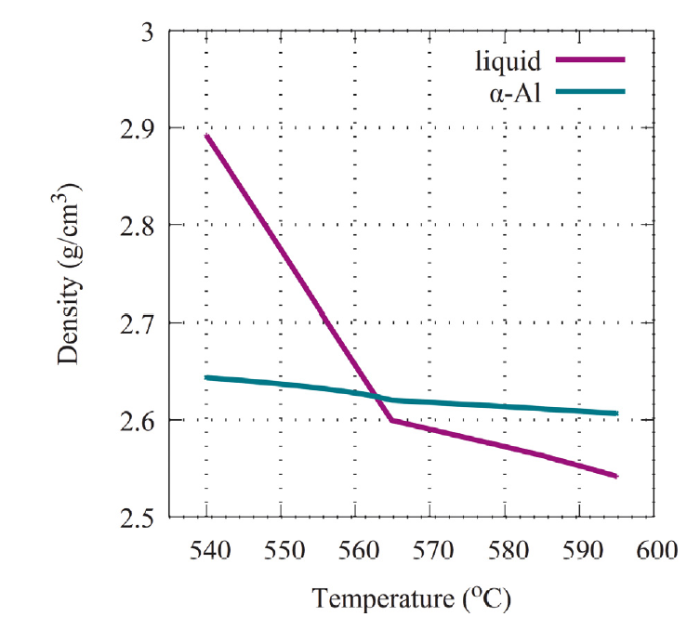
Solidification proceeded in melt during temperature drop before the melt impinged on the non-gate side of the die. At the same time some heavy solute elements (e.g. Cu) were enriched in the liquid phase. Thus the density of liquid increased and exceeded the density of the solid phase, i.e., α-Al grains, As calculated in software JMatPro (see Fig. 13), the density of liquid is greater than that of the solid phase, i.e., α-Al grains when the temperature is below around 562 °C.
Fig. 13. Density of α-Al and liquid in semi-solid temperature interval.
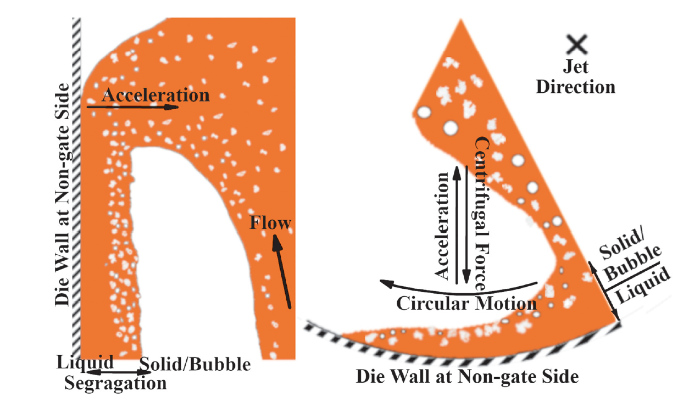
Fig. 14 demonstrates the mechanisms of the solid-liquid segregation. The jet was deflected before it went into the gauge length (see Fig. 11c). Then the horizontal velocity component of the deflected flow in flight vanished at the moment of impingement and depositing on the die wall (see Figs. 11c and 14 a). That sharp deceleration would lead to a solid-liquid segregation due to their density contrast. The horizontal acceleration component pointed to the right side (see Fig. 14a). According to D'Alembert's principle, a virtual body force pointing to the left side was exerted to the semi-solid melt. So the heavier phase, i.e., the solute-rich liquid would go to the left while the lighter phases, e.g., primary α-Al grains and bubbles would float to the right when the thin melt film was adhered to the die wall. Another mechanism for solid-liquid segregation was centripetal acceleration. According to the result of CFD (see Figs. 11e and 12), a small part of melt rushed upward spirally against the die wall. The centripetal acceleration could be 2000-125000 m/s2, according to the tangential velocity and the radius. It was like a micro-centrifuge that segregated solid from the liquid due to the density contrast. After the solid-liquid segregation, the film solidified rapidly with little mixing, as estimated with Eq. (2). Thus the OSL contained more solute (see Fig. 6, Fig. 7) while the ISL contained more α-Al grains and gas pores (see Fig. 3, Fig. 5).
Fig. 14. Mechanisms of the solid-liquid segregation. (a) Impingement and depositing. (b) Centrifugation.
After the backward flow filled the rest cavity, the intensification process began. The backward flow that covered the deposit layer would solidify as the normal surface did. That is why the SSR exhibited a similar segregation feature with the normal surface.
The morphology of the eutectic silicon in hypoeutectic Al-Si alloys is very sensitive to the cooling rate. High cooling rate leads to fibrous eutectic silicon, and decreases blocky or lamellar eutectic silicon [35].
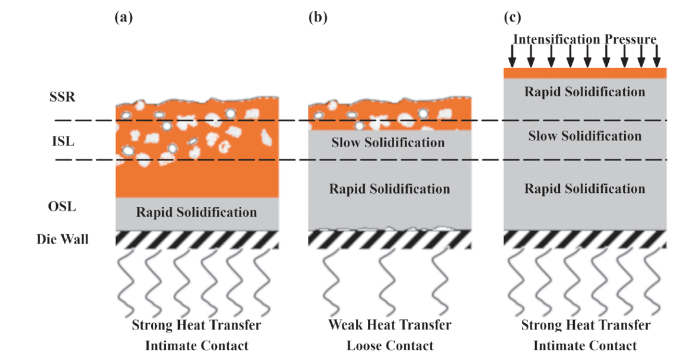
The morphology variation of eutectic silicon (see Fig. 5) reflected different cooling rates during solidification. As discussed, the solid fraction of the thin melt film increased as the distance from the die wall (see Fig. 14). The main solid phase in the deposit melt film was primary α-Al grains. The eutectic phases were very limited at that time. The solute-rich liquid solidified rapidly due to the high interfacial heat transfer coefficient [2] (see Fig. 15a). Accordingly, the eutectic silicon in OSL exhibited a worm-like morphology (see Fig. 5c). However, because of the lack of intensification, the deposit layer could not keep an intimate contact with the die wall after a stable solidified shell was formed (see Fig. 15b). The ISL would solidify at a relatively lower rate due to the weaker heat flux through the thickened shell and the interface. The eutectic silicon in skin layer exhibited a transition to granular or blocky morphology (see Fig. 5d) when it came to the ISL.
Fig. 15. Variation of solidification rate. (a) Rapid solidification in OSL. (b) Slow solidification in ISL. (c) Rapid Solidification in SSR.
Intensification pressure was initiated after the fast filling was completed. The intensification pressure was 79 MPa. While the yield strength of the nearly solidified thin deposit layer was much less than 17 MPa [26]. The tremendous pressure would force the soft shell to recover an intimate contact with the die wall (see Fig. 15c). Some signs of stress and deformation, e.g., the micro-cracks in skin layer as circled in Fig. 5d, were generated at this stage. Then the melt at the SSR would solidify at a high rate due to the improved heat transfer. Accordingly, the eutectic silicon of SSR would grow at a high cooling rate and the eutectic silicon exhibited a worm-like morphology (see Fig. 5b).
The presence of non-interconnected porosity is an important microstructural characteristic frequently associated with spray deposited structures [33]. Besides the gas pores accumulation as demonstrated in Fig. 14, another possible source of gas pore in ISL may be the air entrapment between the deposit layer and the backward flow (see Fig. 11h).
According to Fig. 10 and Table 3, solution treatment experiment demonstrated that the porosity in skin layer was later and less prone to expand. It was different from what was found in literature [24] that the gas pores near the surface were easier to expand. A possible reason is the difference of the gas pressure level inside the pores.
The detected dark band through CT was a combination of shrinkage porosity, micro-cracks and gas pores with various levels of air pressure inside. As mentioned above, the semi-solid flow and micro-drops deposited at the die wall and cooled at a high rate. The unsolidified part of the deposit layer would be flushed away when the backward flow arrived. There was more shrinkage porosity in skin layer, especially the outer sub-layer, due to a lack of intensification during its chilling solidification. The solidified and nearly-solidified parts were left on the die wall at the non-gate side. The pressure intensification began to exert on the left shell after filling process. The local solid fraction affected the pressure upon the bubbles there (see Fig. 16). In SSR, the gas pores surrounded by liquid were compressed by the intensification pressure which was around 790 ambient pressures. Thus the porosity in SSR was mainly gas pore with highest pressure inside. While the bubbles in nearly-solidified ISL would be under a relatively lower pressure. Thus the porosity in ISL was a combination of micro-cracks (see Fig. 5d), shrinkage porosity and gas pores with medium pressure inside. As to the gas pores in the fully-solidified OSL, the exerted pressure was even lower. Thus the porosity in OSL was a combination of shrinkage porosity and gas pores with lowest pressure inside. The gas pores with higher gas pressure inside would expand more when exposed to elevated temperature. Accordingly the expansion times of porosity varied with different regions during solution treatment (see Table 3) and the skin layer expanded later during solution treatment (see Fig. 10).
Fig. 16. The effect of intensification pressure on the gas pressure inside gas pores.
The microstructure, solute segregation and blistering of the skin layer in a die casting were investigated. Efforts were made to reveal the formation mechanisms of the skin layer with the aid of CFD. Accordingly, the following conclusions can be drawn:
1 The skin layer, with a clear boundary, contained more micro-porosity and distinct microstructure from the inner region. The skin layer comprised two sub-layers. The outer sub-layer contained higher concentrations of alloy elements, lower porosity and worm-like eutectic silicon while the inner sub-layer contained lower concentrations of alloy elements, higher porosity and granular/blocky eutectic silicon.
2 Porosity in the skin layer expanded into pore clusters or laminar pores during solution treatment. The gas pores in the skin layer were less prone to expand than the normal surface.
3 The skin layer resulted from the chilling solidification on the die wall during filling process. The flow pattern affected the distribution of the skin layer in the die casting. The solute segregation and the porosity distribution in the skin layer were affected by the impingement on the die at the early stage of the filling process. Different morphologies of eutectic silicon in the skin layer were the result of different cooling rates.
The authors would like to thank the National Natural Science Foundation of China (Grant No. 51775297) for financial support and Mr. Eric Su from Flow Science Software Trading Co., Ltd for the help with CFD.
The authors have declared that no competing interests exist.

 WeChat
/
| 〈 |
|
〉 |


