Search for articles:
Xiao Lu
Corresponding authors:
Received: 2019-02-28
Revised: 2019-04-16
Accepted: 2019-04-24
Online: 2019-09-20
Copyright: 2019 Editorial board of Journal of Materials Science & Technology Copyright reserved, Editorial board of Journal of Materials Science & Technology
More
Abstract
The accelerated corrosion behavior of copper T2 and brass H62 exposed in simulated Nansha marine atmosphere for different periods were investigated by weight loss method, SEM, XRD and potentiodynamic polarization measurements. The results indicate that copper T2 and brass H62 underwent severe corrosion, and the final corrosion rates at 32 days of exposure were 0.24μm/d and 0.10μm/d, respectively. Moreover, the overall corrosion type of copper T2 was uniform and the corrosion products Cu2O and Cu2Cl(OH)3 played a vital role in the corrosion rate of copper. While the dezincification corrosion with zinc preferential dissolution was obvious in brass H62. The predominant phases were the zinc-rich compounds Zn5(OH)8Cl2·H2O, Zn12(SO4)3Cl3(OH)15·5H2O and NaZn4(SO4)Cl(OH)6·6H2O. There existed a large number of copper-rich holes with 20-50μm depth beneath the corrosion product layer.
Keywords:
Nansha Islands are located in the southern waters of the South China Sea with superior geographical location and high strategic value. In response to strategic needs, China needs to speed up construction on islands and reefs, which is conducive to safeguarding sovereignty. Copper and copper alloys are widely employed in outdoor buildings due to their excellent mechanical properties and corrosion resistance, and their better electrical conductivity makes them the most important materials in communications and electronics industries. However, Nansha Islands belongs to marine tropical rainforest climate, which is a typical harsh marine atmosphere environment with high temperature, high humidity and high salt. The average temperature in Nansha Islands is 28.1 °C and the highest temperature can reach about 35 °C, no seasonal change. The average relative humidity is 79%. The average annual rainfall is up to 210 days, with an annual rainfall of 2000 mm. These climate conditions will expose copper and copper alloys to serious atmospheric corrosion risks in the construction of islands and reefs in the South China Sea, which makes the corrosion failure of copper equipment an important concern.
It is well known that atmospheric corrosion is an electrochemical process occurring on a metal surface covered with a thin electrolyte layer [1]. The atmospheric corrosion rate mainly depends on pollutants present in the atmosphere and on the wetting time, i.e., the duration and frequency of wetting to which metal surface are subjected [2], and rate at which dries. The composition, hygroscopicity and degree of crystallization of corrosion products are also functions of these parameters, which play an important role in atmospheric corrosion dynamics [3]. In general, for copper and copper-based alloys exposed at atmospheric conditions, the corrosion products act as a barrier that efficiently reduces the corrosion rate with time [[4], [5], [6]]. Copper will rapidly form a Cu2O protective film on its surface when exposed to atmospheric environment [7,8], so it has a positive corrosion property. However, the corrosion rate of copper was found to increase with time under sheltered coastal conditions, which was due to the corrosion products morphology and degree of crystallization [9]. Kong et al. [10,11] found that deposits on copper in hot and dry atmosphere in Turpan improved its resistance to corrosion, but the protection performance decreased with the increase of temperature. Therefore, it is expected that the high temperature, high humidity and high salt environment in Nansha will have a serious impact on the atmospheric corrosion behavior of copper. In addition, Goidanich et al. [12] observed the corrosion characteristic of brass in different outdoor atmospheric environments in Europe and found that the selective dissolution of zinc was the main corrosion mode of brass in atmospheric environment, and that the corrosion products were composed of copper-rich phase and zinc-rich phase. Kharafi et al. [13] also studied the selective dissolution of brass under various potentials and chloride concentrations and concluded that chloride promotes the dissolution of zinc and also copper. The above findings show that different atmospheres and exposure conditions play an important role in copper and copper alloys corrosion.
Atmospheric corrosion of materials is mainly studied by natural outdoor exposure [[14], [15], [16]] and laboratory accelerated testing [[17], [18], [19]]. Field exposure experiments can provide actual information for atmospheric corrosion of materials, but they are time-consuming [16,20]. Based on this, more laboratory simulation acceleration tests, such as wet-dry cycle experiment, salt spray test and so on, are used by researchers [17,18]. Among these indoor tests, the dry-wet cycle acceleration test can better reproduce the key characteristics of atmospheric environment, including the relative humidity and temperature during the day and/or night [6]. However, in order for this indoor acceleration test to have a better correlation with the outdoor field exposure test, in addition to considering the setting of the relative humidity and temperature, the composition of the simulated atmosphere is crucial.
The atmospheric corrosion behavior of copper and copper alloys exposed in different environments has been extensively studied by a number of researchers [8,16,[21], [22], [23]], whereas no corresponding information about their corrosion in Nansha marine atmospheric environment is available. In view of the different corrosion behaviors of copper and copper alloys in different atmospheric environments, the present work was carried out. In order to simulate the marine atmospheric environment of Nansha Islands more realistically, the solution used in this paper was seawater taken from the waters of Nansha Islands. Therefore, the accelerated corrosion data of copper T2 and brass H62 exposed in simulated Nansha marine atmosphere is of great reference value for the extensive application of materials in the actual environment.
The materials used in the experiment were copper T2 (≥99.70 wt. % Cu) and brass H62 (60.80 wt. % Cu, 38.97 wt. % Zn). There were three parallel specimens for weight loss measurement and one sample for corrosion products analysis per sampling period for each material, which were sectioned into coupons of dimensions 50 mm × 25 mm × 3 mm. In addition, three parallel specimens of 10 mm × 10 mm × 3 mm in size were embedded in epoxy resin for electrochemical measurements. All samples were wet-ground with silicon carbide abrasive paper to 2000 grade, degreased ultrasonically in acetone, thoroughly rinsed with deionized water, dehydrated with alcohol, dried by a blower and weighted by an electronic balance before being stored in a desiccator for 24 h.
In order to simulate the exposure of samples in Nansha marine atmospheric environment, the wet-dry cyclic accelerated test was conducted in a climate test chamber (from Weiss-Voetsch, C4-180 Pro) at 35℃. One wet-dry process consisted of two hours of wet time at 90%RH and one hours of dry time at 60%RH. In addition, the sample surface was wetted with 10 μL/cm2 of seawater every 8 wet-dry cycles, and then the samples were dried in a drying oven to simulate the continuous deposition of sea salt on the sample surface exposed in the outdoor atmospheric environment. Table 1 lists the main composition of seawater in Nansha. The sampling times were 2, 4, 8, 14, 22 and 32 days, respectively.
Table 1 The main composition of seawater in Nansha.
| Ion species | Cl- | SO42- | HCO3- | CO32- | Na+ | K+ | Mg2+ | Ca2+ |
|---|---|---|---|---|---|---|---|---|
| Density(g/L) | 20 | 2.18 | 0.14 | 0.014 | 10 | 5 | 1 | 0.3 |
For weightlessness analysis, the removal of the corrosion products formed on the sample referred to ISO 8407, that is, clean the sample surface with deionized water first, and then remove the remainder corrosion product by immersion in a specific solution (100 mL H2SO4 + 900 mL distilled water) for 1--3 min at 20-25 ℃. Finally the sample was rinsed with deionized water and dried with a blower before being weighed by an electronic balance to determine the mass loss.
The phase compositions and elements distribution of the corrosion products on the surface of the samples exposed for different times were analyzed qualitatively by means of X-ray diffraction analysis (XRD) and energy dispersive spectrometer (EDS), respectively. The surface and cross-sectional morphologies of the exposed specimens were observed by scanning electron microscopy (ESEM XL30 FEG).
Polarization measurements of the corroded samples were conducted by using an electrochemical workstation (PARSTAT 2273) in 0.1 mol/L Na2SO4 aqueous solution. The exposed specimens, a clean platinum foil and a saturated calomel electrode (SCE) were used as the working electrodes, the counter electrode and the reference electrode, respectively. The scanning rate of the potentiodynamic polarization measurements was 20 mV/min, and the scan range was -500 mV (SCE) to 500 mV (SCE) relative to the open circuit potential.
The mass loss measurement is one of the most direct methods to evaluate the corrosion rate of material. In order to facilitate the analysis and comparison, the mass loss was converted into thickness loss to characterize the corrosion degree in this paper. The thickness loss of sample exposed in the simulated Nansha marine atmosphere environment was calculated by using the equation:

where d refers to the thickness loss (μm); m0 and m1 are the mass of sample before and after exposure (g), respectively; ρ is the density of material (g/cm3); S is the exposed area (cm2). The density of copper T2 is 9.001 g/cm3 and that of brass H62 is 8.243 g/cm3. Therefore, the corrosion rates of samples at different exposure periods could be obtained according to the following relationship [24]:

where V is the corrosion rate (μm/d); t is the exposure time (d); n is the period of sampling (n = 1, 2, 3, 4, 5, 6 refer to 2, 4, 8, 14, 22, 32 days of exposure of the samples, respectively).
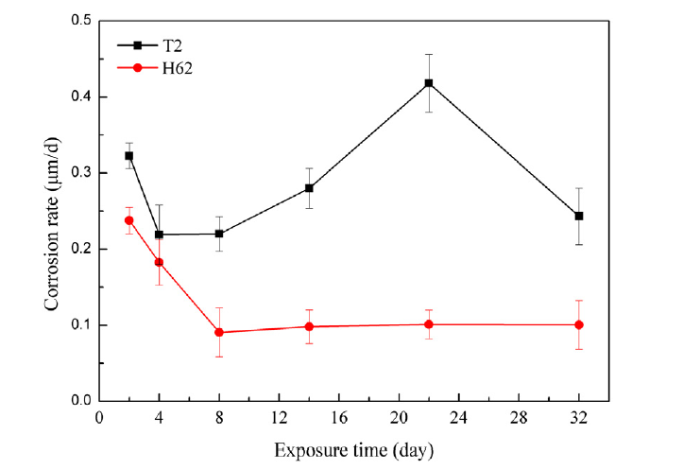
Fig. 1 presents the corrosion rate of copper T2 and brass H62 as a function of the exposure time. It is obvious that the corrosion rate of brass material was slower than that of copper. Furthermore, the variation trends of corrosion rate of the two materials were quite different. The corrosion rate of copper T2 decreased with the extension of exposure time in the first 4 days, then gradually increased with the exposure time prolonged, reaching the maximum at 22 days. When exposed for 32 days, the corrosion rate of copper T2 decreased again. The final corrosion rate of copper T2 was 0.24 μm/d. The variation of corrosion rate of copper T2 was different from the corrosion kinetics of copper in marine atmospheric environment of other regions reported in previous literature [25,26]. Therefore, the corrosion behavior of copper T2 exposed in the simulated Nansha marine atmosphere deserved further analysis.
Fig. 1. Corrosion rate of copper T2 and brass H62 exposed in simulated Nansha marine atmosphere as a function of the exposure time.
The corrosion rate of brass H62 decreased rapidly with the extension of exposure time during the first 8 days, and thereafter remained basically stable with the increase of exposure time. The final corrosion rate of brass H62 was 0.10 μm/d. This implied that the corrosion behavior of brass H62 in simulated Nansha marine atmosphere was a deceleration process, and the corrosion products had a protective effect.
It is well known that the variation of corrosion rate at different exposure times is relevant to the transformation of composition and structure of corrosion product layer during exposure. In order to have a deeper understanding on the cause of corrosion rate changes, it is necessary to analyze the corrosion products generated on copper T2 and brass H62 exposed for different periods.
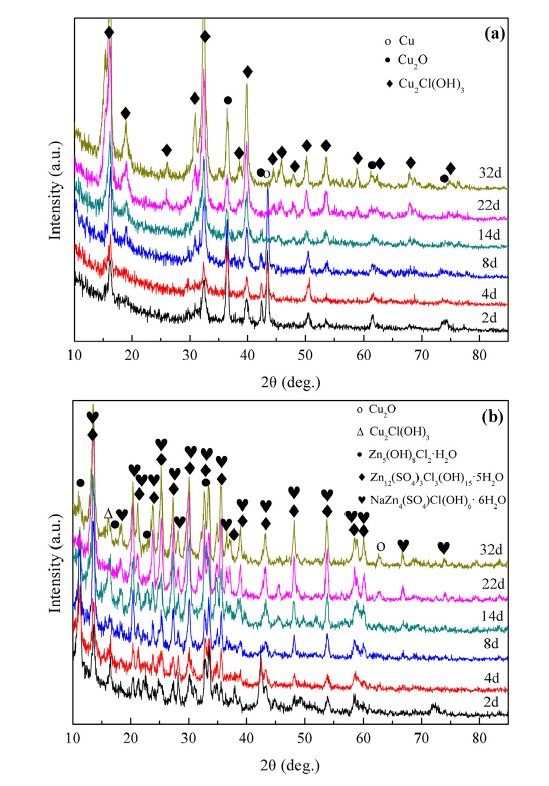
Fig. 2(a) shows the X-ray diffraction results of copper T2 exposed for different times. It is identified that the main phases of the corrosion products were cuprite Cu2O and paratacamite Cu2Cl(OH)3. Moreover, it can be seen that the intensity ratio of Cu2O peak and Cu2Cl(OH)3 peak became smaller and smaller with the extension of exposure time. That is to say, the relative content of Cu2O in corrosion products decreased gradually with prolonged exposure. This indicates that cuprite changed to paratacamite as the corrosion time advanced. It has been reported that cuprite Cu2O layer formed on the copper is a p-type semiconductor with low electronic conductivity and generally affords protection [8,27]. Therefore, the significant decrease of corrosion rate during the first four days was expected that the formation of Cu2O enhanced the protection effect of the corrosion product layer. However, with the continuous transformation of Cu2O into Cu2Cl(OH)3, and the newly generated Cu2Cl(OH)3 on the surface was loose and easy to deliquesce [3,28], therefore the critical relative humidity of the condensation on the copper surface would decrease under a certain amount of Cu2Cl(OH)3, thus prolonging the surface wetting time and keeping the corrosion rate of copper T2 at a high level after 8 days of exposure.
Fig. 2. XRD patterns of copper T2 and brass H62 exposed for different times: (a) copper T2; (b) brass H62.
Fig. 2(b) presents XRD patterns of brass H62 exposed for different periods. The corrosion products of brass H62 were complex, which consisted of a large number of zinc-containing compounds and a small number of copper-containing compounds. As can be seen from the figure, the corrosion products on the surface of brass are basically zinc-containing compounds in the early stage of exposure. Combined with the above results that the corrosion rate of brass H62 decreased rapidly at first and then tended to be stable, the zinc-containing corrosion product layer had a protective effect and reduced the corrosion rate. In addition, a small amount of Cu2O and Cu2Cl(OH)3 were generated at the later stage of exposure. These results reveal that Zn in brass H62 was corroded first and Cu was corroded later, that is, dezincification corrosion with preferential dissolution of zinc occurred in brass H62 exposed in the simulated Nansha atmospheric environment.
3.3.1. Corrosion morphology of copper T2
As a consequence of the evolution of corrosion products formed on copper T2 and brass H62 in the simulated Nansha marine atmosphere, the surface morphology changed gradually with the exposure period. It can be observed with the naked eye that the surface of copper T2 exposed for 2 days developed a reddish brown coloration with few loose powdery bluish green stains. According to the XRD analysis results and previous reports [3,8], a conclusion can be drawn that the reddish brown areas and the bluish green stains were attributed to cuprite Cu2O and the formation of green patina Cu2Cl(OH)3, respectively. After 8 days, the corrosion was aggravated and the bluish green corrosion products stains formed on the copper increased continuously and joined together. When exposed for 32 days, the surface of the sample was completely covered by the bluish green corrosion products.
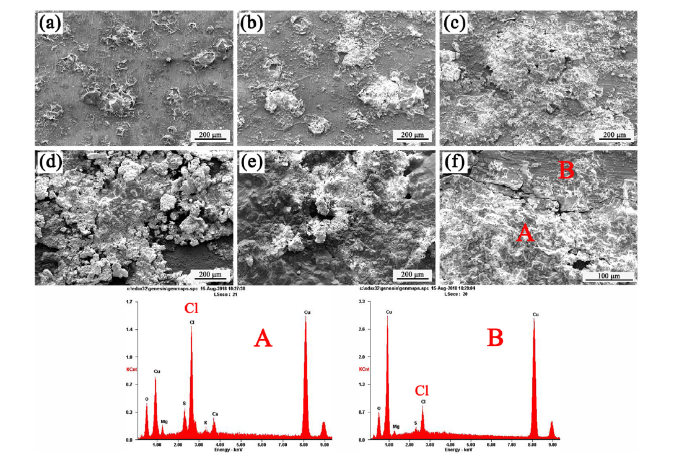
Fig. 3 presents the surface morphology of copper T2 exposed for different times. It can be seen that the corrosion on copper T2 was uneven after 2 days of exposure, and the bluish green stains were mainly patch shaped masses with irregular topography. At 4 days of exposure, the number of bluish green products increased, and the products were expanded outward with the original corrosion product as the center. When exposed for 8 days, it can be observed from the enlarged view (Fig. 3(f)) that there were obvious cracks in the corrosion product layer next to the surface of the matrix. Therefore, it can be inferred that the presence of cracks was another reason why the corrosion rate began to increase after 8 days of exposure. According to the EDS spectra and the corresponding element content in Table 2, the content of Cl in the reddish brown corrosion product layer attached to the matrix could be neglected compared with the element contained in the blue-green corrosion product. The amount of Mg, S, K and Ca detected was very small, which was caused by seawater deposition and could be ignored. These results further verified that the bluish green corrosion products were composed of chlorinated copper compounds and the reddish brown corrosion product layer was mainly Cu2O. When exposed for 14 days and 22 days, the bluish green corrosion product layer was broken into fragments with uneven thickness, covering the relatively compact reddish brown corrosion product film on the matrix surface. While after 32 days of exposure, it is obvious that the corrosion product layer was very dense and completely covered the surface of the matrix. Combined with the result of the corrosion rate decreasing again after 32 days of exposure, it indicates that the density of the corrosion product layer was an important factor affecting the corrosion rate of copper T2.
Fig. 3. Surface morphology and the corresponding EDS spectra of corrosion products formed on copper T2 exposed for different times: (a) 2d, (b) 4d, (c) 8d, (d) 22d, (e) 32d, (f) an enlarged view of figure (c).
Table 2 EDS results of the chemical composition (wt. %) of region A and B on the copper surface exposed for 8d.
| Element | O | Cl | Cu | Mg | S | K | Ca |
|---|---|---|---|---|---|---|---|
| A | 9.21 | 12.36 | 70.76 | 2.29 | 2.9 | 0.65 | 1.92 |
| B | 6.44 | 3.76 | 87.72 | 1.29 | 0.8 | - | - |
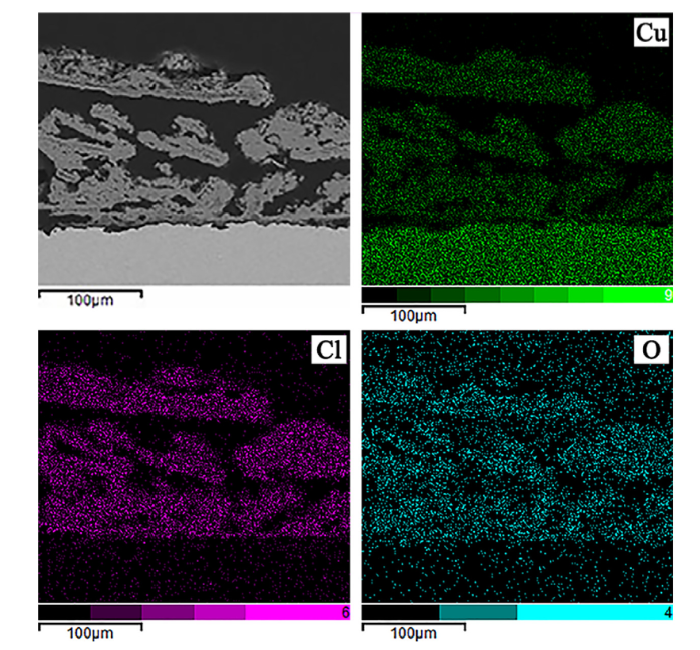
Fig. 4 shows that the cross-section morphology and element distribution maps of copper T2 exposed for 32 days. It is evident that the surface of copper T2 was uniformly corroded on the whole and the corrosion product layer was relatively poor in combination with the matrix. Although the relatively dense corrosion product layer reduced the final corrosion rate of copper T2, its poor binding force with the matrix still kept the corrosion rate of copper T2 at a high level. In addition, it can be seen from element distribution maps that the corrosion products formed on copper T2 were primarily basic copper chloride. However, the Cu2O layer formed next to the matrix was not observed, which was different from the report that Cui et al. [29] observed an obvious Cu2O inner layer. Combined with the XRD results, it can be concluded that the Cu2O generation rate on the surface of copper T2 was lower than the conversion rate from Cu2O to Cu2Cl(OH)3 in the later period of exposure in the simulated Nansha marine atmospheric environment.
Fig. 4. Cross-section morphology and element distribution maps of copper T2 exposed for 32 days.
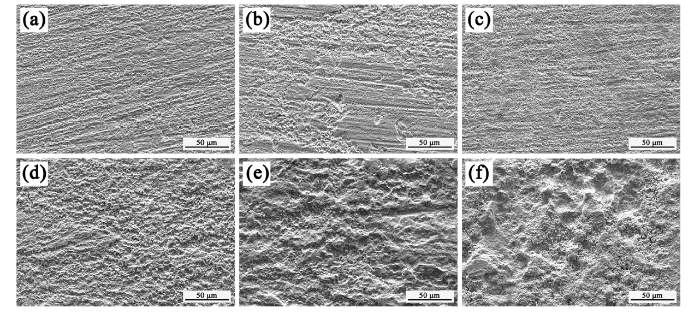
In order to better understand the corrosion characteristic of copper T2 exposed in the simulated Nansha marine atmospheric environment, the evolution of the surface morphology of copper T2 after removing corrosion products were observed, as shown in Fig. 5. The corrosion behavior of copper T2 in the simulated Nansha marine atmosphere could be divided into three stages according to the degree of corrosion: early stage (0-8 d), middle stage (8-22 d) and late stage (22-32 d). In the early stage of exposure, copper T2 mainly presented as local corrosion and the surface still had distinct polished scratches. In the middle stage of exposure, the corrosion intensified and no wear marks were visible on the surface of the sample. At the late exposure stage, the corrosion was very serious and the surface of copper T2 was in the form of rugged hills.
Fig. 5. Surface morphology of copper T2 after removing corrosion products at different exposure times: (a) 2d, (b) 4d, (c) 8d, (d) 14d, (e) 22d, (f) 32d.
3.3.2. Corrosion morphology of brass H62
It can be observed from the surface macroscopic morphologies of brass H62 that local corrosion occurred on the sample at the initial exposure stage. The corrosion product was salmon colored irregular pattern with a few white corrosion spots on it. At 8 days of exposure, the corrosion of the sample was aggravated and the salmon colored corrosion products had basically covered the surface, while the white corrosion products distributed sparsely on the sample surface. As the exposure time increased, the white spots increased and almost covered the whole surface at 32 days of exposure, which was related to the surface enrichment of zinc-rich phase in the corrosion products [29].
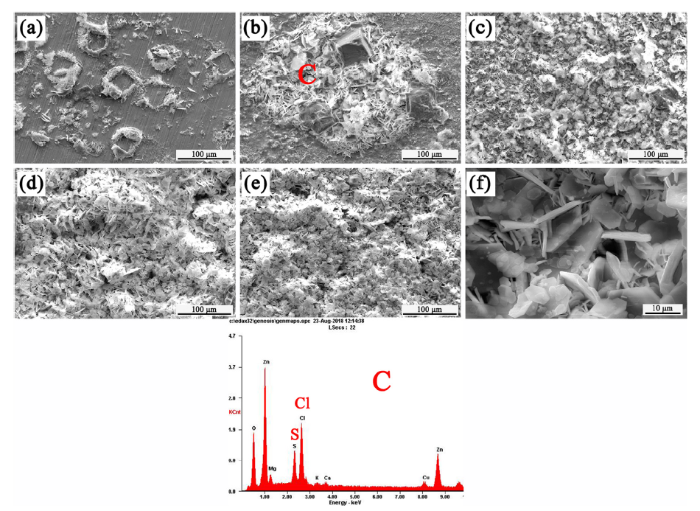
Fig. 6 shows the evolution of corrosion products morphology of brass H62 after different exposure periods in the simulated Nansha marine atmospheric environment. Obviously, local corrosion occurred on the surface of brass H62 after 2 days of exposure and the appearance of the corrosion products was annular. At 4 days of exposure, the morphology of the corrosion products developed into domes. According to the EDS spectrum and the XRD results, the corrosion products were zinc-containing compounds, that is, dezincification corrosion with preferential dissolution of zinc occurred in the corroded area. After 8 days, the corrosion products joined together to form a layer covering the surface of the sample. The surface morphologies of the corroded samples at 14 days and 22 days of exposure were almost the same and the corrosion product layer was thickened. When exposed for 32 days, the corrosion product layer on the substrate was very compact. From the enlarged view (Fig. 6(f)), it can be seen that the corrosion product layer was formed by the irregular cross and close connection between the flake corrosion products, which made the corrosion product layer of brass H62 play a certain protective role and also explained the reason why the corrosion rate of brass H62 gradually stabilized in the later exposure stage.
Fig. 6. Surface morphology and the corresponding EDS spectrum of corrosion products formed on brass H62 exposed for different times: (a) 2d, (b) 4d, (c) 8d, (d) 22d, (e) 32d, (f) a larger version of figure (e).
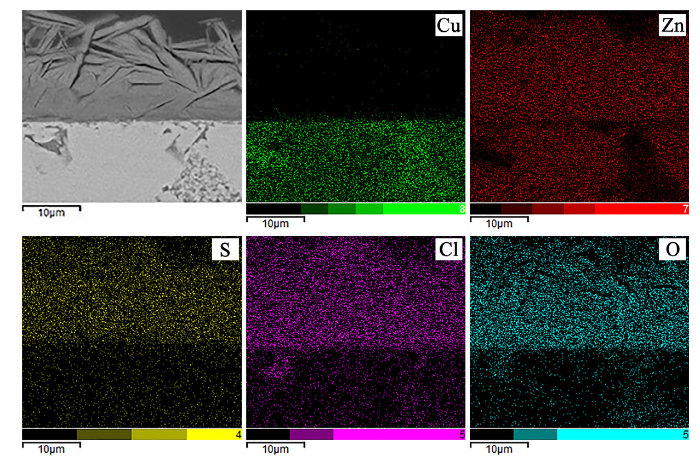
The cross-section morphology and element distribution maps of brass H62 after 32days of exposure are shown in Fig. 7. The corrosion product layer of brass H62 was relatively compact and well combined with the substrate and the thickness of the corrosion product layer was about 10-20 μm. At the same time, the element distribution maps could illustrate that brass H62 in the simulated Nansha marine atmospheric environment had undergone significant dezincification corrosion. The colors of Cu, O and Cl elements obviously deepened at the dezincification areas, but no S element enriched here, indicating that part of the matrix under the corrosion product layer became pure copper and/or a small amount of copper-containing compounds. According to the XRD analysis results, the copper-containing compounds should be Cu2O and Cu2Cl(OH)3. In addition, the measured local dezincification thickness of brass H62 could reach 50 μm, which was much greater depth than the corrosion thickness and would greatly degrade the mechanical properties of the material.
Fig. 7. Cross-section morphology and element distribution maps of brass H62 exposed for 32 days.
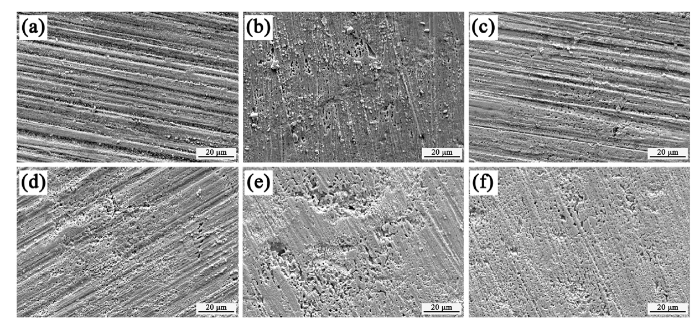
To better verify that brass H62 undergone significant dezincification corrosion in the simulated Nansha marine atmospheric environment, the corrosion morphologies of brass H62 after removing corrosion products were observed, as shown in Fig. 8. Due to the selective dissolution of zinc, the surface of the sample showed obvious irregular corrosion pits after 4 days of exposure. With the extension of exposure time, the surface of the sample was densely distributed with a network of corrosion pits, leaving loose and porous copper matrix. Copper could provide some protection against further corrosion because of its high corrosion potential.
Fig. 8. Surface morphology of brass H62 after removing corrosion products at different exposure times: (a) 2d, (b) 4d, (c) 8d, (d) 14d, (e) 22d, (f) 32d.
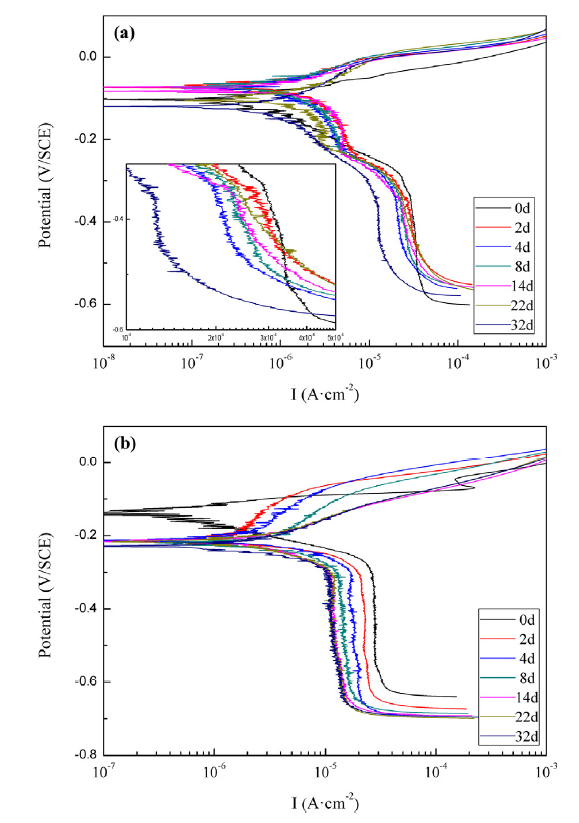
In order to further determine the protective effect of the corrosion product layer formed on the surface of specimens during different exposure periods, polarization measurements were carried out on the corroded samples, as shown in Fig. 9. The polarization curves of each material at different exposure periods presented a similar shape, indicating that the polarization behavior and the corrosion mechanism of each material were of little difference at different exposure times.
Fig. 9. Polarization curves of copper T2 and brass H62 exposed for different time: (a) copper T2; (b) brass H62.
Fig. 9(a) presents the polarization curves of copper T2 exposed for different time. Based on previous studies on the cathodic reduction of oxygen on copper in neutral NaCl solution [30] and the cathodic polarization curves of copper covered with various thicknesses of chloride-containing electrolyte layers [31], oxygen reduction was the primary cathodic reaction on the copper. The limiting current density for dissolved oxygen reduction (ilim,O2) decreased markedly during the first 4 days of exposure, then increased as exposure time extends until 22 days of exposure, whereas decreased again when exposed for 32 days. This result was in good agreement with the measured corrosion rate, which further verified the dynamic law of copper T2 exposed in the simulated Nansha marine atmosphere.
Fig. 9(b) illustrates the polarization curves of brass H62 exposed for different time. Obviously, there was a typical current density plateau for brass in cathodic polarization, which might be attributed to its relatively compact and stable corrosion products [32]. Although the corrosion potential (Ecorr) basically remained constant, the cathodic process controlled by oxygen diffusion was gradually inhibited with the increase of the exposure time. The limiting current density for dissolved oxygen reduction was lowest at 32 days of exposure, indicating that the relatively dense corrosion product layer formed on the surface of brass H62 had a certain hindering effect on the oxygen diffusion and thus had a protective effect on the substrate in aggressive media.
The corrosion reaction of copper T2 in the simulated Nansha marine atmosphere was an electrochemical reaction under a thin liquid film. The corrosion products were mainly Cu2O and Cu2Cl(OH)3. Based on the above discussion and analysis, the corrosion process of copper T2 was roughly as follows: At the early stage of exposure (0-8d), the corrosion type of copper T2 was local corrosion and the corrosion rate decreased dramatically due to the rapid formation of a compact Cu2O protective layer. After 8 days of exposure, as the amount of Cu2Cl(OH)3 formed on the surface kept increasing and cracks appeared in the compact Cu2O corrosion product layer adjacent to the matrix, the corrosion rate of copper T2 gradually increased and the corrosion type began to change to uniform corrosion. When exposed for 32 days, the corrosion product layer dominated by Cu2Cl(OH)3 completely and compactly covered the substrate surface, which reduced the corrosion rate of copper T2 again. However, the poor adhesion force with the matrix made the corrosion velocity of copper T2 still at a high level. In addition, the Cu2O generation rate on the surface of copper T2 was lower than the conversion rate from Cu2O to Cu2Cl(OH)3 in the later stage, so a dense Cu2O layer could not be formed to protect the substrate. Therefore, the corrosion degree of copper T2 exposed in the simulated Nansha marine atmospheric environment was quite serious. After removing the corrosion product, the surface of copper T2 was in the form of rugged hills.
According to the above results, dezincification corrosion with preferential dissolution mechanism occurred in brass H62 exposed in the simulated Nansha marine atmospheric environment, that is, the dezincification first started in the β′ phase with higher Zn content, then Zn would continue to take off from the remaining α phase when the dezincification of the β′ phase was completed [33]. This explains the annular appearance of corrosion products at the initial exposure and, in turn, indicates that the area where the corrosion began was a selective phase. The corrosion products formed on the surface of brass H62 were mainly Zn5(OH)8Cl2·H2O, Zn12(SO4)3Cl3(OH)15·5H2O and NaZn4(SO4)Cl(OH)6·6H2O. In addition, a small amount of Cu2O and Cu2Cl(OH)3 would be generated at the later stage of exposure. The zinc-containing corrosion product layer formed on the surface of brass H62 was very compact and stable, which could protect the substrate to some extent. Therefore, the corrosion rate of brass H62 in the simulated Nansha marine atmospheric environment gradually decreased and tended to be stable with the extension of exposure time.
The corrosion behavior of copper T2 and brass H62 exposed in a simulated Nansha marine atmosphere environment for 2-32 days were studied. The following conclusions can be drawn from the experimental results:
(1)The variation trends of corrosion rate of copper T2 and brass H62 were quite different. The corrosion rate of copper T2 first decreased, then increased, and finally decreased again, whereas that of brass H62 decreased sharply and then stabilized. The final corrosion rates at 32 days of exposure were 0.24 μm/d and 0.10 μm/d, respectively.
(2)The corrosion products of copper T2 were mainly Cu2O and Cu2Cl(OH)3; brass H62 had a distinct dezincification corrosion and the corrosion products were mainly Zn5(OH)8Cl2·H2O, Zn12(SO4)3Cl3(OH)15·5H2O and NaZn4(SO4)Cl(OH)6·6H2O.
(3)According to the later exposure results, the corrosion product layer on the copper T2 had poor adhesion with the matrix and no obvious Cu2O layer was observed; the corrosion product layer of brass H62 had a certain protective effect in the simulated Nansha marine atmosphere environment.
(4)After 32 days of exposure, the surface morphology of copper T2 after removing corrosion products was in the form of rugged hills. In the case of brass H62, there were numerous copper-rich holes with the depth of 20-50 μm (which was much greater depth than the corrosion thickness) under the corrosion product layer due to dezincification process.
This work was supported by the National Natural Science Foundation of China (No. 51671197) and Special Project of Chinese Academy of Sciences (No. XDA130040502).
The authors have declared that no competing interests exist.

 WeChat
/
| 〈 |
|
〉 |