Search for articles:
S.J. Song , W.K. Che, J.B. Zhang, L.K. Huang, S.Y. Duan, F. Liu
Corresponding authors:
Received: 2018-12-1
Revised: 2019-02-1
Accepted: 2019-03-4
Online: 2019-08-05
Copyright: 2019 Editorial board of Journal of Materials Science & Technology Copyright reserved, Editorial board of Journal of Materials Science & Technology
More
Abstract
During the multi-stage processing of advanced high-strength steels, the austenite-to-ferrite transformation, generally as a precursor of the formation of other non-equilibrium or metastable structures, has a severe effect on the subsequent phase transformations. Herein, a more flexible kinetic and microstructural predictive modeling for the key austenite-to-ferrite transformation of Fe-C-Mn-Si steels was developed, in combination with the classical nucleation theory, the general mixed-mode growth model based on Gibbs energy balance, the microstructural path method and the kinetic framework for grain boundary nucleation. Adopting a bounded, extended matrix space corresponding to a single ferrite grain, both soft-impingement and hard-impingement can be naturally included in the current modeling. Accordingly, this model outputs the ferrite volume fraction, the austenite/ferrite interface area per unit volume, and the average grain size of ferrite, which will serve as the input parameters for modeling the subsequent bainite or martensite transformations. Applying the model, this work successfully predicts the experiment measurement of the isothermal austenite-to-ferrite transformation in Fe-0.17C-0.91Mn-1.03Si (wt%) steel at different temperatures and explains why the final-state average grain size of ferrite has a maximum at the moderate annealing temperature. Effectiveness and advantages of the present model are discussed arising from kinetics and thermodynamics accompanied with nucleation, growth and impingement.
Keywords:
Advanced high strength steels (AHSS) are highly desired, especially for light weighting of vehicles, due to the excellent combination of strength and ductility. These steels derive their exceptional properties from a complex, heterogeneous microstructure containing ferrite, bainitic ferrite, martensite, retained austenite and/or carbides [1]. The overall behavior of AHSS is determined by the microstructural features, such as volume fraction of constituent phase, grain size and morphology, and by the properties of these phases themselves [2,3]. However, the presupposed multi-phase configurations are always difficult to create, requiring fundamental insight into their thermodynamic and kinetic characteristics, well-controlled (thermomechanical) processing paths and potentially scarce alloying elements [4].
During the multi-stage processing of AHSS, such as dual-phase (DP) and transformation-induced plasticity (TRIP) steels, the transformation of austenite to ferrite is of particular significance. On the one hand, the amount and the grain size of the ferrite formed are dominant factors, which directly control the final mechanical properties of AHSS [5,6]. On the other hand, the austenite-to-ferrite transformation, generally as a precursor of the formation of other non-equilibrium or metastable structures, has a severe effect on the subsequent bainite or martensite transformation kinetics [[6], [7], [8]]. According to Ref. [7], there are at least three contributory factors after the austenite-to-ferrite transformation: the reduced austenite grain size, the ferrite/austenite interface as well as the associated chemical heterogeneity at the interface, and the enriched carbon in austenite. These resultant characteristic variables will be acted as the input state of the subsequent bainite or martensite transformation kinetics. Therefore, a more flexible microstructural modeling for the key austenite-to-ferrite transformation, which can accurately predict the above characteristic variables, would be highly desirable. This is the motivation for the investigations presented here.
The austenite-to-ferrite transformation is a diffusional nucleation and growth process, in which both of these phenomena contribute to the overall reaction kinetics. However, the vast majority of existing models associated with steels consider that the kinetics of ferrite formation is solely dictated by the ferrite growth regardless of the nucleation. So far, extensive studies have been devoted to migration kinetics of the ferrite/austenite interface, and many physical models or theories have been reviewed over the last decades [9]. In simple cases of the binary system, e.g. Fe-C and Fe-Mn, the diffusion-controlled growth theory due to Zener [10], the interface-controlled growth theory due to Christian [11], and the various mixed-mode growth theories [[12], [13], [14], [15]] all can provide perfect predictions within their respective scope of thermodynamic and/or kinetic constraints. For the modern AHSS typically containing many substitutional elements (e.g. Mn, Si, Al, etc.), the situation will then become more complicated, because both interstitial and substitutional elements can diffuse, and their diffusivities differ substantially [16]. In this case, two classical models, i.e. the ParaEquilibrium (PE) model [17,18] and the Local Equilibrium with Non-Partitioning (LENP) model [[18], [19], [20]], have been proposed to describe the thermodynamic limits of non-partitioned growth. It is evident, however, that even under the conditions with no long range partitioning of substitutional solutes, in some instances the ferrite growth kinetics appears to be slower than the expectations based on the existing models [21,22]. This can be attributed to interactions of the substitutional solutes with the migrating austenite/ferrite interface through a phenomenon termed “solute drag” [23,24] or “diffusional dissipation of Gibbs energy in the interface” [25], which can dramatically modify the growth kinetics of ferrite. The intensity of the above interactions is usually quantified through two critical parameters: the effective binding energy of the substitutional solute to the interface and an effective kinetic transfer coefficient for the solute across the interface [26,27]. Based on the mixed-mode growth model and a modified solute drag theory, assuming the PE condition and the linear temperature relationship for the binding energy, an austenite-to-ferrite transformation model for low-carbon steels has been successfully proposed by Fazeli and Militzer [28,29]. More recently, based on the Gibbs energy balance (GEB) concept and assuming planar interface growth, Chen and van der Zwaag [30] have presented a more general mixed-mode model that can physically describe the austenite-to-ferrite transformation in multi-component steels. As delineated previously, however, the above models only focused on the growing of a single ferrite in an austenite grain disregarding the contribution of nucleation to the overall transformation kinetics.
It is well known, however, that the progress of solid-state phase transformations can generally be subdivided into three overlapping mechanisms: nucleation, growth and impingement. The classical Johnson-Mehl-Avrami-Kolmogorov (JMAK) theory [[31], [32], [33], [34], [35]] and its various variants (e.g. for grain boundary (GB) nucleation [36,37]) or extensions (e.g. to continuous heating/cooling process [[38], [39], [40], [41]]) are widely applied to describe the overall transformation kinetics. Even in solid-state partitioning phase transformations, the JMAK theory shows its versatility as well, where soft-impingement due to the overlapping of composition fields and hard-impingement due to the geometric contact of grains can be naturally included (see, e.g. Refs. [42,43]). Nevertheless, the JMAK approach is focused on the kinetics, which can only provide information about the transformed fraction. Although the mechanisms about nucleation, growth and impingement behavior can be obtained from the evolution of kinetic parameters [44,45], all the microstructural aspects are essentially ignored. To characterize the global feature of the microstructure at any instant of the nucleation and growth type phase transformation, a concept of microstructural path was first proposed by DeHoff [46], and subsequently developed into a fully-fledged analytical methodology, i.e. the microstructural path method (MPM), by Vandermeer et al. [47,48]. As a complementation of the JMAK theory, in addition to the volume fraction, the MPM introduces an additional microstructural descriptor, the interfacial area per unit volume separating the transformed regions from the untransformed matrix. The MPM has been widely applied to the diffusional transformations and recrystallization [[49], [50], [51]], occasionally to analyze the martensite transformation recently by Rios and Guimarães [52].
Besides these analytical approaches, there was a growing interest in the development of simulation methods for modeling the microstructure evolution in steels. Using an N-fold Monte Carlo simulation, Rickman and Gunton [53] obtained the kinetic information and the grain size parameters associated with the first-order phase transformation. Based on three-dimensional (3-D) phase-field simulations presented by Militzer et al. [54], Mecozzi et al. [55] analyzed the impact of nucleation behavior on the overall kinetics and the final grain-size distribution of austenite-to-ferrite transformation in Fe-C-Mn steels. Bos et al. [56] presented a 3-D mixed-mode cellular-automata (CA) model to simulate the microstructure development throughout the annealing stage of DP steels. More recently, based on the topological transformation models and mixed-mode growth model under the PE condition, Fang et al. [57] have developed a 3-D model to predict the average ferrite grain size and grain size distribution for the austenite-to-ferrite transformation during continuous cooling of Fe-C-Mn steels. Although the simulated microstructures can provide the information on grain size distribution and other microstructural characteristics beyond the simple average grain size and volume fraction afforded by the JMAK approach and the MPM, these models are very difficult to merge into the through-process model for microstructure evolution, due to the necessity to consider the effects of prior transformations on subsequent ones, and into the high-throughput computing platform for process-design, due to the intrinsic drawbacks: computationally intensive algorithms and assumption of effective interface mobility without considering the reality of solute drag.
As described earlier, the prior ferrite formation has an important effect on the subsequent bainite and/or martensite transformation through certain microstructural characteristics, e.g. the ferrite/austenite interface. It is evident that both the bainitic ferrite and the martensite form favorably at the ferrite/austenite phase interface due to the higher energy. In the present work, a kinetic and microstructural modeling for the austenite-to-ferrite transformation of Fe-C-Mn-Si steels will be proposed by combination of the classical nucleation theory, the general mixed-mode growth model from the Gibbs energy balance, the microstructural path method and the kinetic framework for GB nucleation. This model is desired to output the ferrite volume fraction, the ferrite/austenite interface area per unit volume, and the average ferrite grain size. Although the overall kinetic framework is of a statistical average feature, this microstructural model can be flexible enough to serve in the through-process model and the high-throughput computing for the microstructure design of AHSS.
The material used here is an Fe-0.17C-0.91Mn-1.03Si (wt%) alloy, which was prepared by induction melting under argon atmosphere and cast into a cylindrical copper mold. As-cast ingot of 10 mm in diameter was hammered down to rod of 8 mm in diameter. Then the rod was sealed in a quartz container under vacuum and annealed at 1200 °C for 100 h in order to achieve a homogeneous distribution of the alloying elements. The alloy compositions were measured using inductively coupled plasma-optical emission spectrometry (ICP-OES, Thermo iCAP 7600). The cold rolled rod was machined into dilatometric specimens with a diameter of 3 mm and length of 10 mm. A LINSEIS L78 RITA dilatometer was used to measure the length change of specimens. The dilatation signal can be transferred into the phase transformation kinetics using the rule of mixtures. Temperature was recorded by a thermocouple welded onto the sample surface. Vacuum and helium were used as the protecting atmosphere and the cooling agent, respectively.
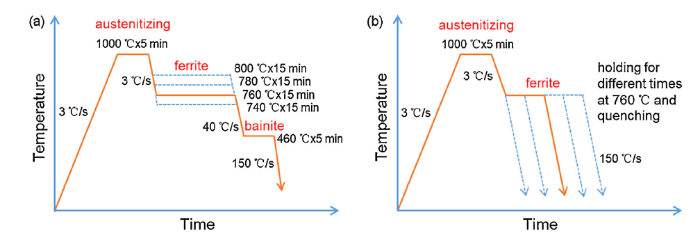
In order to simulate the typical processing path of hot rolled TRIP steels, (i.e. austenitizing + isothermal ferrite transformation + isothermal bainite transformation + quenching to room temperature), the temperature program sketched in Fig. 1(a) was performed. The specimen was heated first from room temperature up to 1000 °C with a heating rate of 3 °C/s and kept at this temperature for 5 min; then it was cooled to one of the four different temperatures (740, 760, 780 and 800 °C) with a cooling rate of 3 °C/s and kept for 15 min; subsequently, it was cooled to 460 °C with a cooling rate of 40 °C/s to hold for 5 min; finally, it was quenched to room temperature with a cooling rate of 150 °C/s.
Fig. 1. Temperature programs employed in the current work: (a) different holding temperatures, (b) various durations at a given temperature for isothermal austenite-to-ferrite transformation.
In order to measure the grain size evolution of ferrite with time, the temperature program (interrupting + quenching) was performed and sketched in Fig. 1(b). The specimen was heated first from room temperature up to 1000 °C with a heating rate of 3 °C/s and kept at this temperature for 5 min; then it was cooled to 760 °C with a cooling rate of 3 °C/s to hold for one of the nine different times (30, 60, 90, 120, 180, 240, 360, 480 and 600 s); subsequently, it was directly quenched to room temperature with a cooling rate of 150 °C/s.
A fresh specimen was used for each measurement. In order to observe the evolution of microstructure, the samples undergoing the temperature program of Fig. 1(a) were polished using the Buehler VibroMet 2 vibratory polisher for scanning electron microscopy (SEM, TESCAN VEGA3); the samples undergoing the temperature program of Fig. 1(b) were mechanically polished and etched in 2% Nital solution for optical microscopy (OM, CARL ZEISS Axio Scope.A1). Finally, the parameters associated with the microstructure evolution, such as the phase volume fraction and the average grain size, are determined using quantitative metallography.
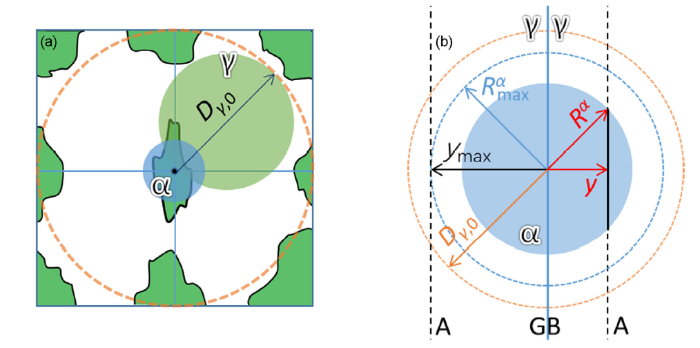
Since nucleation and growth of ferrite usually occurs at the GBs of austenite, for more realistic scenarios, we consider that a spherical ferrite grain nucleated at the GBs of austenite is growing into a fictitious spherical austenite matrix with radius of Dγ,0 as shown in Fig. 2(a). Dγ,0 is the initially average grain diameter of austenite. Following the concept of extended volume in the JMAK theory, actually, Rα should be the radius of a single ferrite grain growing into an extended space in the absence of other growing grains, and the fictitious austenite matrix with radius of Dγ,0 is just the correspondingly maximum extended space of a single ferrite grain. As such, the continuous nucleation process, the soft-impingement and hard-impingement are all naturally included in the overall kinetics. The spherical hypothesis is very often used in these diffusional transformations, for example, the classic work of Vandermeer [58]. Furthermore, the overall kinetic framework is derived from the JMAK theory, which is of a statistical average theory, and thus the spherical hypothesis seems to be reasonable although it is not realistic.
Fig. 2. (a) Schematic depicting that a ferrite grain α nucleated at the GBs of austenite is considered as a sphere growing in a fictitious and concentric austenite matrix γ with radius of Dγ,0, and (b) geometry of the α grain with a probe plane A (parallel to the GB plane) used for the calculation of its extended area or volume.
Classical nucleation theory is used to model the nucleation of allotriomorphic ferrite, with the GB steady-state nucleation rate per unit area given by [59]
Is=Ca$\frac{k_BT}{h}$exp($-\frac{Q_N}{RT}$)exp(-$\frac{\Delta{G^*}}{k_BT}$) (1)
where h is the Planck constant, kB the Boltzmann constant, Ca the adjustable constant involving the number density of potential nucleation sites with the unit m-2, R the universal gas constant, T the temperature in kelvin and QN the constant activation energy representing the barrier to the transfer of atom across the interface. The energy barrier for nucleation ΔG* considering the spherical precipitate can be expressed as [60]
ΔG*=$\frac{16π}{3}\frac{σ^3}{(ΔG_{Nmax}-ΔG_S)^2}$ (2)
where σ represents the interface energy per unit area for ferrite nucleation, ΔGS is the misfit strain energy per unit volume due to the volume difference between ferrite and austenite, and ΔGNmax is the maximum chemical free energy change per unit volume available for nucleation which can be calculated by the parallel tangents method. In the present work, ΔGNmax is calculated using the TQ-interface subroutine TQGDF2 of Thermo-Calc with TCFE8 thermodynamic database under para-equilibrium conditions.
It should be noted that, however, the spherical hypothesis is not always valid. Herein, a particle shape factor gα, defined as the surface area ratio of the anisotropic shaped ferrite grains over the spherical particles with the same volume, is introduced as,
ΔG*=$\frac{16π}{3}g_α^3\frac{σ^3}{(ΔG_{Nmax}-ΔG_S)^2}$ (3)
Assuming the shape-preserved grains, the constant shape factor gα of ferrite is always greater than or equal to one, because the surface area of sphere is the smallest in all particles of the same volume but different shapes. In fact, the value of gα reflects the difference between the shape of ferrite grain and the sphere. The value approaches one indicating that the grain shape is close to the sphere; on the contrary, it deviates farther from one indicating that the extent of the grain shape deviating from the sphere is greater, i.e. the stronger anisotropy.
A general mixed-mode model based on the principle of Gibbs Energy Balance (GEB) at the migration interface proposed by Chen and van der Zwaag [30] is utilized to describe the growth kinetics of ferrite in the present work. The main assumption of the GEB approach is that the available chemical driving force for interface migration, $ΔG_m^{chem}$, has to be balanced by the Gibbs energy dissipation due to the diffusion of substitutional solutes inside the interface, $ΔG_m^{diff}$, and the interface friction by the lattice structural change, $ΔG_m^friction$, as follows
$ΔG_m^{chem}=ΔG_m^{diff}+ΔG_m^{friction}$ (4)
During the austenite-to-ferrite transformations of multi-component steels, the substitutional alloying elements, such as Mn, Si, etc., tend to segregate into the migrating interfaces, as there are potential wells of these components inside the interface. Following Ref. [30], the triangular potential well configuration proposed by Purdy and Bréchet [23] is adopted here. The degree of solute segregation depends on the depth of the respective potential well, which is associated with the binding energy E0 of substitutional solutes to the interface1(1 It should be noted that E0 is the effective binding energy due to the effect of solute/solute interaction on the solute/interface interaction [26,27].), the chemical potential $μ_α^0$ and $μ_γ^0$ of the solute in ferrite and austenite, and the interface velocity v. Therein, ΔE is half of the solute chemical potential difference between austenite and ferrite, i.e. $ΔE=(μ_γ^0-μ_α^0)/2$, and its magnitude depends on the partition coefficient of solutes and the temperature.
The governing equation for solute diffusion inside an interface migrating with a quasi-steady velocity v is written as [23]
$\frac{∂}{∂x}[D\frac{∂X}{∂x}+\frac{DX}{RT}\frac{∂E}{∂x}+vX]$=0 (5)
where X is the concentration of substitutional solutes, x the distance, D the diffusion coefficient of substitutional alloying elements inside the ferrite/austenite interface, and E the free energy of interaction of the solute with the migrating interface. Based on the above governing equation for the diffusion and the potential well, an analytical solution for the substitutional solute profile inside the interface at a given velocity can be obtained. As such, the dissipation of Gibbs energy due to the solute diffusion inside the interface, $ΔG_m^{diff}$, can be calculated using Cahn's theory as follows [23]
$ΔG_m^{diff}=PV_m=-∫_{-δ}^{+δ}(X-X_0)(dE/dx)dx$ (6)
where P is the solute drag force arising from the asymmetric solute distribution inside the interface, Vm the molar volume, δ the half thickness of the migrating interface, and X0 the bulk concentration of substitutional solutes in the alloys.
The energy dissipation due to the interface migration or the interface friction is given by
$ΔG_m^{friction}=vV_m/M_{int}$ (7)
where Mint is the intrinsic interface mobility.
The chemical driving force, $ΔG_m^{chem}$, acting on the migrating interface during the austenite-to-ferrite transformation, is essentially determined by the concentrations of alloy elements on both sides of the interface, and can be generally described as
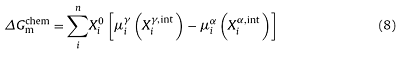
where $X_i^0$ is the composition of the element transferred over the interface, when there is no diffusion in α, $X_i^0$=$X_i^{α,int}$, i represents the ith component in the alloys, n is the number of elements, $X_i^{α,int}$ and $X_i^{γ,int}$ are the mole fractions of component i in the vicinity of interface on ferrite and austenite sides, respectively. Following Ref. [30], when i represents the substitutional solute, $X_i^{γ,int}$ is chosen to be the concentration at the root of its diffusion spike, i.e. the bulk concentration, so as to include the spike in the calculations. $μ_i^α$ and $μ_i^γ$ are the chemical potential of component i in ferrite and austenite, respectively.
As far as the diffusion process is concerned, the theoretical analyses of particle growth have to deal with the troublesome problem of resolving the diffusion equation in combination with the concentration flux balance at the moving interface. Meanwhile, the competition between the neighboring particles through the overlap of diffusion fields, i.e. soft-impingement, has to be taken into account. Instead of solving the diffusion equation, for the sake of simplicity, the solute diffusion profile has been approximated to be linear, exponential or polynomial for different levels of accuracy [61,62]. As such, the ferrite growth process is artificially divided into two stages, i.e. the non-overlapping and overlapping stages of carbon diffusion fields. Since the present contribution is devoted to studying the overall kinetics of austenite-to-ferrite transformation and its microstructural aspects, in combination with the spherical geometry depicted in Fig. 2(a), the linearized gradient approximation is adopted here for the sole purpose of obtaining a convenient and concise formal approach to elucidate this issue.
For the non-overlapping stage of diffusion fields during the spherical growth of ferrite, the concentration profile of C in front of the interface XC(r), the diffusion length L, and the interface migrating velocity v can be derived as
$X_C(r)=X_C^0+(X_C^{γ,int}-X_C^0)(1-\frac{r-R^α}{L})$ (9)
$(\frac{L}{R^α})^3+4(\frac{L}{R^α})^2+6\frac{L}{R^α}=\frac{4(X_C^0-X_C^{α,int})}{X_C^{γ,int}-X_C^0}$ (10)
$v=\frac{dR^α}{dt}=\frac{D_C^γ(X_C^{γ,int}-X_C^0)}{L(X_C^{γ,int}-X_C^{α,int})}$ (11)
where $D_C^γ$ is the diffusion coefficient of C in the austenite, Rα the radius of a single ferrite particle growing into an extended matrix space as depicted in Fig. 2(a), r the distance away from the interface in austenite, $X_C^0$ the nominal composition of C, and $X_C^{α,int}$ and $X_C^{γ,int}$ the mole fractions of C at the interface on the austenite and ferrite sides, respectively.
For the overlapping stage of diffusion fields, XC(r) can be written as
$X_C(r)=X_C^m+(X_C^{γ,int}-X_C^m)(1-\frac{r-R^α}{L′})$ (12)
where L′ is the diffusion length subjected to the space constraint given by
L′=$D_{γ,0}-R^α$ (13)
and $X_C^m$ is the composition of C at the boundary of the extended matrix, i.e. $X_C(r)=X_C^m$ when r = Dγ,0, after soft impingement, which abides by the following rule of global solute conservation,
$\frac{4}{3}πR_α^3(X_C^0-X_C^{α,int})=∫_{R^α}^{D_{γ,0}}4πr^2(X_C(r)-X_C^0)dr$ (14)
At last, the interface velocity can be derived from
$v=\frac{dR^α}{dt}=\frac{D_C^γ(X_C^{γ,int}-X_C^m)}{L′(X_C^{γ,int}-X_C^{α,int})}$ (15)
According to Ref. [14], the chemical potential of C across the γ/α interface should be continuous, i.e. $μ_C^γ(X_C^{γ,int})=μ_C^α(X_C^{α,int})$. For simplicity, however, $X_C^{α,int}$ is assumed to be an insignificant value because of the negligible solubility of C in the ferrite. Then, it can be from Eqs. (11) and (15) found that the interface velocity v is a function of $X_C^{γ,int}$ and Rα. Therefore, the chemical driving force $ΔG_m^{chem}$ can be according to Eq. (8) calculated as a function of v and Rα. Following Eqs. (6) and (7), the dissipation of Gibbs energy can also be calculated as a function of v. For a given Rα, the required v and its corresponding $ΔG_m^{chem}$ can be obtained from the evolution of chemical driving force and energy dissipation with v and the balanced relationship (i.e. Eq. (4)), c.f. Fig. 8(a, b). Subsequently, the corresponding time t associated with the evolution of Rα and the obtained v can be calculated by integrating the following equation,
dt=dRα/v (16)
In the present work, all of the chemical potentials mentioned above are calculated by invoking the TQ-interface subroutine TQGMU of Thermo-Calc with TCFE8 database.
The classical JMAK theory is the first to deal with the impingement by employing the concept of extended space, in which nucleation can continue in the already-transformed as well as the untransformed regions and further each of these nuclei is allowed to grow without the interference of other (growing) particles [[31], [32], [33], [34], [35]]. It should be emphasized that the JMAK theory holds on the assumptions of spatially random nucleation and isotropic growth. For this case, the real volume fraction transformed, fV, can be related to the extended volume fraction, fVex, according to
fV=1-exp(-fVex) (17)
However, the ferrite prefers to nucleate at the GBs of austenite, and the assumption of randomness is violated. A model of treating impingement due to the GB nucleation was developed by Cahn [36]. Following Cahn's approach, the GBs of austenite are approximated as planes that are randomly distributed in space; the nucleation occurs randomly on these planes, and the growth is isotropic. The impingement question is thus simplified into a combination of two separate impingement processes: first, the (lateral) impingement of ferrite grains originating from the same GB plane of austenite, and second, impingement of ferrite grains growing from different GBs of austenite [36,37].
For the first impingement, as illustrated in Fig. 2(b), consider a planar GB of austenite having a specific nucleation rate Is as Eq. (1), and a probe plane A parallel to the GB plane at a distance y from it. At time t, the radius of a ferrite grain nucleated at time τ, i.e. Rα(t, τ), can be calculated according to Section 3.2. During the time interval between τ and τ+dτ, the number of ferrite grains nucleated on a unit area of GB is Isdτ; at time t, the extended intersection area fraction of these ferrite grains with the probe plane A, i.e. dYe, can be written as
dYe=πIsdτ[Rα(τ,t)2-y2]only if Rα(τ,t)≥y (18)
Due to randomly dispersed nuclei on the GB, the transformed area fraction Y on the plane A can be obtained by applying Eq. (17) as
Y=1-exp($-∫_0^tπI_s[R^α(τ,t)^2-y^2]dτ$) (19)
The total volume of all ferrite grains from the unit area of austenite GB is given by
Vs=$2∫_0^{ymax}Ydy$ (20)
Different from Cahn's work, as shown in Fig. 2(b), the distance y has a maximum value ymax, which corresponds to $R_{max}^α$, since the extended space available for the growth of a single ferrite grain has a maximum corresponding to a fictitious austenite matrix with radius of Dγ,0. Considering soft-impingement effect, ymax can be thus obtained as
$y_{max}=R_{max}^α=\sqrt[3]{\int^{eq}}D_{γ,0}$ (21)
where $\int^{eq}$ is the equilibrium ferrite volume fraction. In practice, $R_{max}^α$ can be determined directly from the GEB approach, and then $\int^{eq}=(R_{max}^α/D_{γ,0})^3$.
For the second impingement, its extended volume fraction fVex is just the volume of all the ferrite grains nucleated on one GB Vs multiplied by the GB area per unit volume Sγ/γ,0 as follows
fVex=VsSγ/γ,0 (22)
when t≫0, the volume of ferrite grains nucleated on a united area of GB can be written as
Vs max=2ymax=2$\sqrt[3]{\int^{eq}}D_{γ,0}$ (23)
Applying Eq. (17) again, the real volume fraction of the ferrite transformed is normalized as
$f_V^α=\int^{eq}\frac{1-exp(\int_{Vex})}{1-exp(-2\sqrt[3]{\int^{eq}}D_{γ,0}S_{γ/γ,0})}$ (24)
As a complementation of the JMAK theory, the concept of microstructural path was introduced to characterize the sequence of the instantaneous microstructural states that a system can go through during the microstructure evolution [47,48]. Thus, for a phase transformation where fV and SV are the microstructural state variables, the microstructural path can be described by the following equation [47]
SV=Ψ(fV) (25)
where SV is the area of phase interface per unit volume.
Analogous to the JMAK theory, the MPM developed by Vandermeer et al. [47] is about modeling the transformation in the extended space, thus avoiding dealing with the complicated issue of impingement. Once the extended space quantities are obtained, they can be transformed into the real, measurable quantities using, e.g. Eq. (17) and
SV=(1-fV)SVex (26)
where SVex is the extended area of phase interface per unit volume.
From the geometrical consideration as shown in Fig. 2(b), analogous to the treatment of GB nucleation in Section 3.3, the number of ferrite grains nucleated on a unit area of GB between τ and τ+dτ is Isdτ; at time t, from y to y+dy, the extended incremental interfacial area for these ferrite grains (considering a pair mirror-symmetric parallel planes) can be written as [48]
dσex=$∫_0^t4πI_sR^α(τ,t)dτdy only if R^α(τ,t)≥y$ (27)
Applying Eq. (26), the real interfacial area increment can be thus given by
dσ=(1-Y)$∫_0^t4πI_sR^α(τ,t)dτdy$ (28)
where Y is a function of the distance y according to Eq. (19).
And then, the extended area of austenite/ferrite interface per unit volume, $S_{Vex}^{γ/α}$, can be derived analogous to Eq. (22) as
$S_{Vex}^{γ/α}=S_{γ/γ,0}∫_0^ymax(1-Y)∫_0^t4πI_sR^α(τ,t)dτxdy$ (29)
Finally, the real area of austenite/ferrite interface per unit volume, $S_{V}^{γ/α}$, can be calculated by combining Eq. (26) with Eq. (29).
In addition to $S_{V}^{γ/α}$, there is another potentially useful descriptor, i.e. the interfacial area density between two transformed grains $S_V^{α/α}$, which is the impinged boundary area of ferrite grains per unit volume. Thus, it is necessary to introduce a supplementary microstructural descriptor Cα/α
$C^{α/α}=\frac{2S_V^{α/α}}{2S_V^{α/α}+S_V^{γ/α}}=F(\int_V^α)$ (30)
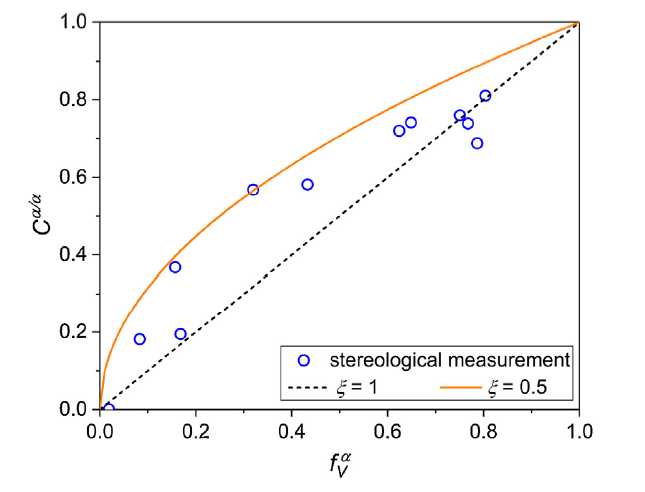
which is termed as contiguity ratio [49,50], i.e. the fraction of total GB area of newly formed ferrite grains shared by other ferrite grains, where $2S_V^{α/α}+S_V^{γ/α}$ is the total GB area density associated with the ferrite grains, $S_V^{T,α}$. The ratio Cα/α varies from zero at the initiated transformation to a value no greater than one at the completed transformation. According to Refs. [49,50], it is believed that for the transformation system, in which the new grains are randomly distributed, the contiguity ratio should be equal to the volume fraction transformed, i.e. Cα/α≈$\int_V^α$. By adopting the stereological measurements, the evolution of contiguity ratio Cα/α with $\int_V^α$ for the isothermal decomposition of austenite to ferrite in a hypo-eutectoid steel (in which the nucleation takes place at the austenite GBs) was evaluated by Vandermeer [49], and the data points are collected in present Fig. 3 from Ref. [49]. It clearly shows a strong positive deviation from the uniform impingement in the early stage of transformation. Accordingly, by introducing an impingement correction factor ξ (0<ξ<1), Eq. (30) will have a concise form as Cα/α=$(\int_V^α)^ξ$ , and in the present work, the value of ξ is selected to be 0.5 as shown in Fig. 3. Finally, SVα/α can be obtained according to Eq. (30)2 (2 Actually, in case of random distribution of product phase grains, $S_V^{α/α}$ can be obtained using the model proposed by Gokhale [63].).
Fig. 3. Contiguity ratio Cα/α as a function of the volume fraction transformed $\int_V^α$ for isothermal decomposition of austenite to ferrite in a hypo-eutectoid steel, the open circles denoting stereological measurement from Ref. [
Due to the statistically average features of the overall kinetics and the MPM, for both ferrite and austenite in a unit volume of transformation system, at any instant, there are always four microstructural state variables: the grain number N, the average grain size <D>, the total volume of all grains fV, and the total boundary area of all grains SVT. According to the transformation geometry, there are only two independent variables among the four instantaneous state variables; as long as two of these variables can be identified, the other variables can be determined naturally. In the present work, the ferrite grain is assumed to be a spherical particle of the same volume for modeling, while the extent to which the ferrite grain shape deviates from the sphere is interpreted by using the shape factor gα, c.f. Section 3.1. That is to say, the anisotropic ferrite grains have the same volume as the assumed spherical grains, but the surface area differs by a factor of gα. Accordingly, in a unit volume of transforming system, the relationships of $\int_V^α$ and $\int_V^{T, α}$ with Nα and <Dα> can be written as
$N^α\frac{π}{6}$<Dα>3=$\int_V^α$ (31a)
$N^αg_απ$<Dα>2=$2S_V^{α/α}+S_V^{γ/α}$ (31b)
Since $\int_V^α$ and $\int_V^{T, α}$ can be obtained from Section 3.3 and Section 3.4, respectively, the average grain size of ferrite <Dα> can be derived by
<Dα>=$\frac{6g_α\int_V^α}{2S_V^{α/α}+S_V^{γ/α}}$ (32)
with gα as the particle shape factor.
At last, it is necessary to mention that, although both Cahn's approach and the MPM are in principle able to deal with nucleation on grain edges and grain corners, the present work is only concerned with nucleation on the grain boundary plane.
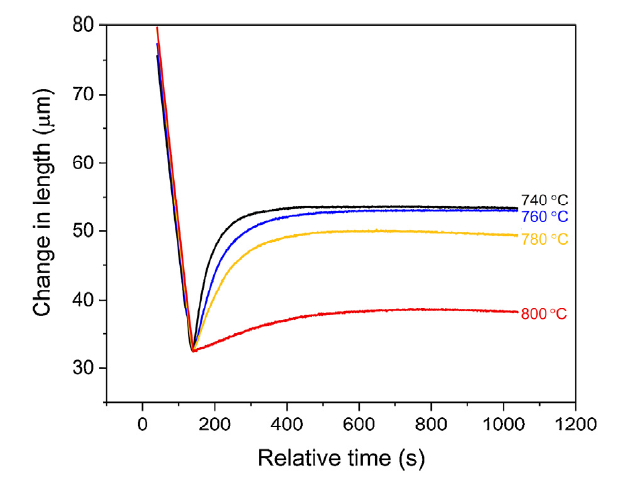
With the help of the line-intercept method [64] and the original austenite GBs etched by saturated picric acid solution, the average grain size of austenite in the Fe-0.17C-0.91Mn-1.03Si alloy after holding at T = 1000 °C for 5 min, i.e. Dγ,0, is determined as 110 μm. Applying the LINSEIS L78 RITA dilatometer, the measured relative length changes, for the isothermal austenite-to-ferrite transformations of Fe-0.17C-0.91Mn-1.03Si alloy at four different temperatures (740, 760, 780 and 800 °C; see Fig.1(a)) are shown as functions of the relative time in Fig. 4, where, all the dilatation curves are translated into the same onset of phase transformation. Upon increasing the holding temperature, distinctly, the amount of expansion due to the ferrite formation decreases, indicating the decreased ferrite fraction at the final state.
Fig. 4. Measured relative length change by dilatometer as a function of the relative time during the different isothermal holding (Tγ→α = 740, 760, 780 and 800 °C) of Fe-0.17C-0.91Mn-1.03Si alloy as sketched in
Typical microstructures of Fe-0.17C-0.91Mn-1.03Si alloy after going through the temperature paths sketched in Fig. 1(a) (i.e. 740, 760, 780 and 800 °C for the ferrite transformation but with the same temperature for the isothermal bainite transformation), are respectively shown in Fig. 5(a-d). All the microstructures are composed of two phases, the polygonal ferrite and the bainite, and almost no austenite (i.e. face-centered cubic phase) can be found according to the X-ray diffraction analysis. Using the software of Image-Pro Plus [65], the volume fraction of ferrite for the Fe-C-Mn-Si alloy after isothermal annealing at 740, 760, 780 and 800 °C can be determined as 57.4%, 51.9%, 35.9% and 13.8%, respectively. The decreased volume fraction with increasing temperature is consistent with the dilatation measurement of Fig. 4, which is also clearly reflected in the microstructure evolution of Fig. 5. Using the rule of mixtures (e.g. in Ref. [66]) and the final-state volume fraction, kinetics curves for the isothermal ferrite transformations at the four temperatures can be transferred from Fig. 4 (see Section 4.2.3 below). Furthermore, the average grain size of ferrite in the final-state of isothermal annealing can be determined as 35, 40, 45 and 25 μm corresponding to 740, 760, 780 and 800 °C, respectively. With increasing the holding temperature, the average grain size increases first and then decreases, and the maximum average grain size occurs at T = 780 °C (see Section 4.2.3 below).
Fig. 5. SEM micrograph of Fe-0.17C-0.91Mn-1.03Si alloy after going through the temperature paths sketched in
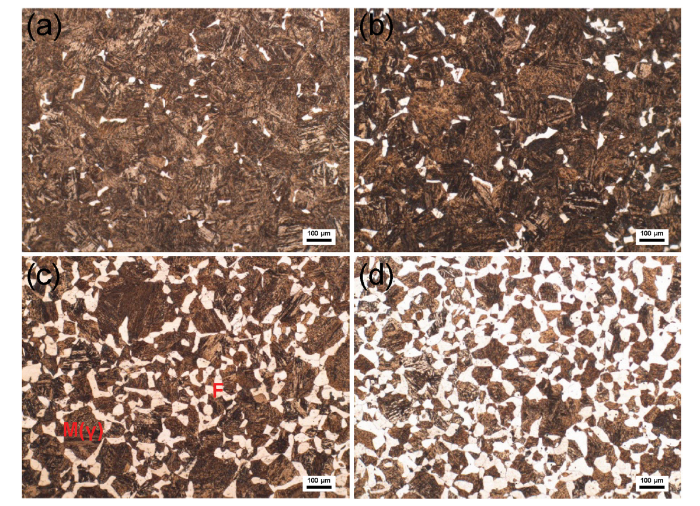
Typical microstructures of Fe-0.17C-0.91Mn-1.03Si alloy after going through the interrupting and quenching program sketched in Fig. 1(b) (i.e. four selected isothermal durations (60, 120, 360 and 600 s) at T = 760 °C) are respectively shown in Fig. 6(a-d), where the final-state microstructure is composed of the allotriomorphic ferrite and the martensite transformed from the untransformed austenite during quenching. This implies that, the ferrite should be mainly formed at the austenite GBs, and moreover, the ferrite nucleation must play a significant role in the overall transformation kinetics (see also Section 5.1). Using the quantitative metallography through Image-Pro Plus, the average grain size of ferrite evolving with the nine programmed durations (30, 60, 90, 120, 180, 240, 360, 480 and 600 s) for this isothermal austenite-to-ferrite transformation can be determined, as shown in Section 4.2.2.
Fig. 6. Optical micrograph of Fe-0.17C-0.91Mn-1.03Si alloy after going through the temperature program sketched in
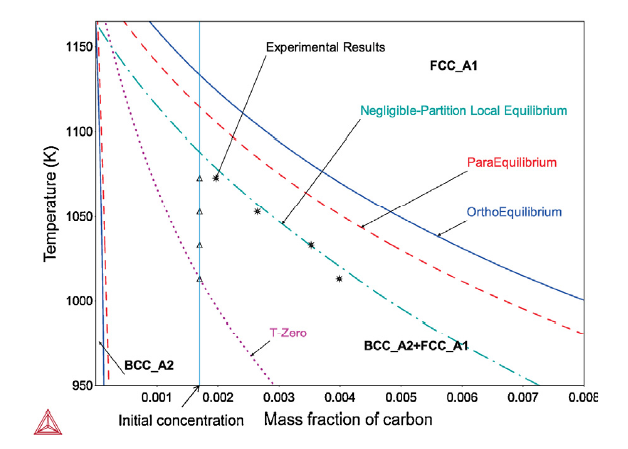
Fig. 7 shows a calculated isopleth section in terms of temperature vs mass fraction of C for Fe-C-0.91Mn-1.03Si (wt%) alloy using Thermo-Calc with TCFE8 thermodynamic database. In addition to the boundaries of Ortho-Equilibrium, the T-zero line and the boundaries for the PE and the LENP are also included. Corresponding to the four holding temperatures 740, 760, 780 and 800 °C, the final C concentration in the untransformed austenite after the ferrite transformation is according to the lever rule calculated from the volume fraction of ferrite at the final state and the initial C concentration (see the asterisks in Fig. 7). For the initial C concentration 0.17 wt%, the four selected temperatures are just above the T-zero line, and the isothermal austenite-to-ferrite transformations of the Fe-0.17C-0.91Mn-1.03Si alloy at these temperatures almost all meet the thermodynamic constraints of the LENP (see Fig. 7).
Fig. 7. Isopleth section of phase diagram for Fe-C-0.91Mn-1.03Si alloy calculated by Thermo-Calc with TCFE8 database. The initial concentration and the experimental results are also included.
4.2.1. Growth kinetics of single ferrite grain at T = 760 °C
As depicted in Section 3.2, the Gibbs energy balance (GEB) approach is applied to describe the growth kinetics of a single ferrite grain with radius of Rα into a fictitious austenite matrix (i.e. the correspondingly bounded, extended space) with a radius of Dγ,0. In this section, the isothermal growth of ferrite at T = 760 °C will be taken as a typical example to show the GEB approach.
Starting from Refs. [30,67,68], the thickness of the austenite/ferrite interface 2δ is set as 0.5 nm, the interface mobility Mint is assumed to be infinite and the diffusion coefficients of M (i.e. substitutional element, e.g. Mn or Si in the present investigation) inside the interface $D_M^{int}$ is assumed to be the geometric average of the diffusion coefficient of M in the austenite $D_M^{γ}$, in the ferrite $D_M^{α}$ and in the ferrite GBs $D_M^{GB}$ . Values of $D_M^{γ}$, $D_M^{α}$ and the diffusion coefficient of C in austenite $D_C^{γ}$ can be calculated using Thermo-Calc with MOBFE3 mobility database, while the value of $D_M^{GB}$ is calculated from Ref. [69], as demonstrated in Refs. [30,67,68]. Values of the binding energy of Mn and Si to the migrating interface, as often used in Refs. [30,68], are selected as $E _0^{Mn}$E0=9.9kJ/mol and $E _0^{Si}$=12.3kJ/mol respectively.
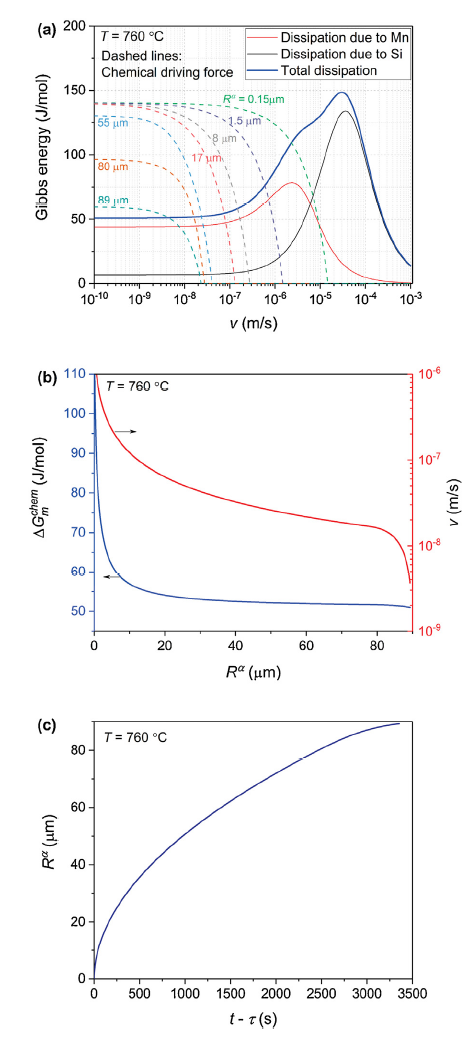
Fig. 8(a) shows the calculated Gibbs energy dissipation together with the available chemical driving force for different Rα as functions of the interface velocity, where the total dissipation is the simple sum of dissipation due to Mn and Si. As Rα increases, $ΔG_m^{chem}$ decreases due to the increased carbon concentration in the untransformed austenite. According to the GEB concept (i.e. Eq. (4)), since $ΔG_m^{chem}$ has to be balanced by the total dissipation, the intersection between the curves of $ΔG_m^{chem}$ and of the total dissipation should be the solution of the required interface velocity v and its corresponding $ΔG_m^{chem}$ for the given Rα.
Fig. 8. (a) Calculated Gibbs energy dissipation and the available chemical driving force $ΔG_m^{chem}$ for different Rα as functions of the interface (or growth) velocity v, (b) the calculated $ΔG_m^{chem}$ and v as functions of the corresponding Rα, and (c) Rα as a function of t-τ, for the growth of single ferrite grain in austenite matrix at 760 °C in the Fe-0.17C-0.91Mn-1.03Si alloy.
Derived from the intersections in Fig. 8(a), the results of ΔGmchem and v as functions of the corresponding Rα are shown in Fig. 8(b), where both ΔGmchem and v decrease with the increased Rα. Then the corresponding time associated with the evolution of Rα and v can be according to Eq. (16) obtained, see the evolution of Rα with time in Fig. 8(c). Since the growth kinetics of a single ferrite grain in the absence of other grains is immutable and independent of its nucleation time τ, the time in Fig. 8(c) should be relative with respect to τ written as t-τ. As such, the obtained numerical relationship of Rα with t-τ can be directly substituted into the overall transformation kinetic framework (see sections 3.3 and 3.4).
4.2.2. Isothermal austenite-to-ferrite transformation of Fe-C-Mn-Si steel at 760 ℃
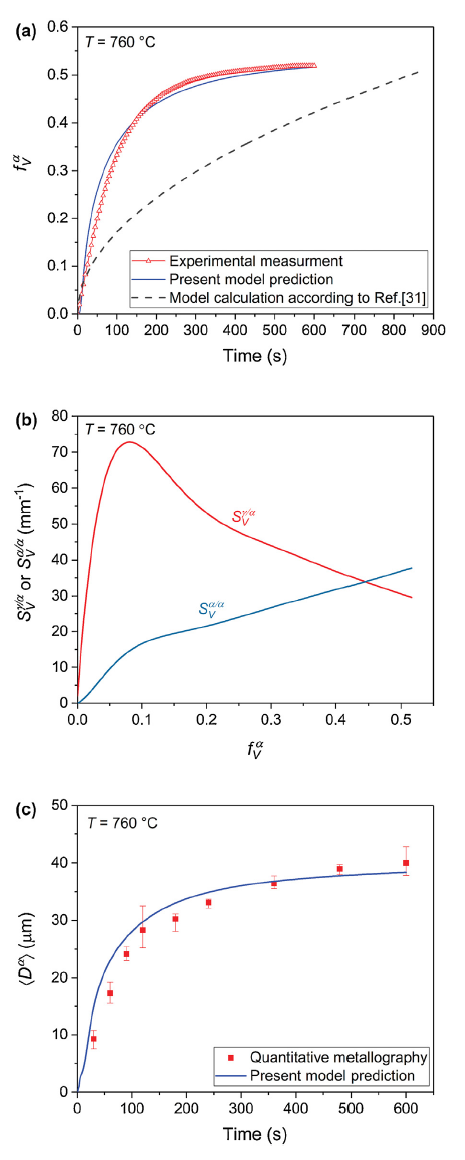
According to Cahn's classical work [36], if considering the equally larger tetrakaidecahedral grains with the most close-packed arrangement, the GB area of austenite per unit volume can be expressed as Sγ/γ,0 = 3.35/Dγ,0. From the nucleation rate of ferrite per unit area of austenite GBs Is (see Section 3.1 for the number density of potential nucleation sites per unit GB area Ca and the shape factor gα) and the numerical relationship between Rα of a single ferrite and t-τ obtained in Section 4.2.1, the overall kinetic framework for the GB nucleation in Section 3.3 can be used to calculate the instant volume fraction of ferrite $\int_V^α$, assuming QN = 200 kJ/mol, σ = 0.01 J/m2 [59] and ignoring ΔGS, with Ca∼1012m-2 [59] and gα = 1.36. For ease of viewing, these parameters used in the model predictions is summarized in Table 1. The calculated $\int_V^α$ associated with the experimental measurement is illustrated in Fig. 9(a), which shows that the present model prediction agrees well with the experimental result. Then, substituting Is and Rα(t-τ) into the microstructural path method in Section 3.4 gives the instant phase interface area per unit volume $S_V^{γ/α}$ and the interfacial area between two ferrite grains per unit volume $S_V^{α/α}$. The evolution of $S_V^{γ/α}$ and $S_V^{α/α}$ with $\int_V^α$ is shown in Fig. 9(b), where, as $\int_V^α$ increases, $S_V^{γ/α}$ first increases rapidly to a maximum value when $\int_V^α$∼0.08 and then decreases, while $S_V^{α/α}$ always increases monotonically.
Table 1 Summary of parameters used in the model predictions.
| Steel composition: Fe-0.17C-0.91Mn-1.03Si (wt%) |
|---|
| Initial microstructure data of austenite: |
| Average grain size Dγ,0 = 110 μm |
| Grain boundary area per unit volume Sγ/γ,0 = 3.35/Dγ,0 [36] |
| Nucleation parameters: |
| Activation energy QN = 200 kJ/mol [59] |
| Interface energy σ = 0.01 J/m2 [59] |
| Strain energy ΔGS is ignored |
| Adjustable constant Ca $\widetilde{1}$012 /m2 [59] |
| Shape factor gα is temperature-dependent in Fig. 10(b) |
| Growth parameters: |
| Thickness of austenite/ferrite interface 2δ = 0.5 nm |
| Binding energy of Mn to interface $E_0^{Mn}$ =9.9kJ/mol [30,68] |
| Binding energy of Si to interface $E_0^{Si}$ =12.3kJ/mol [30,68] |
| Diffusion coefficient $ D_{Mn}^γ$ , $ D_{Si}^γ$ , $ D_{Mn}^α$ , $ D_{Si}^α$ , $ D_{C}^γ$ from Thermo-Calc with MOBFE3 mobility database |
| Grain boundary diffusion coefficient $ D_{Mn}^{GB}$ , $ D_{Si}^{GB}$ from Ref. [69] |
| Intrinsic interface mobility Mint is assumed to be infinite |
Fig. 9. (a) $\int_V^α$ from the present model prediction (solid line), from the model calculation assuming plane interface growth regardless of nucleation [
Once $\int_V^α$, $S_V^{γ/α}$ and $S_V^{α/α}$ are determined, the instantly average grain size of ferrite <Dα> can be calculated using Eq. (32). Combining gα = 1.36 with Fig. 8(a) and (b), Fig. 9(c) shows the calculated Dα associated with the quantitative metallography for the ferrite transformation of Fe-0.17C-0.91Mn-1.03Si alloy at T = 760 °C. The present model predicts the evolution of ferrite grain size well.
4.2.3. Isothermal austenite-to-ferrite transformation at different holding temperatures
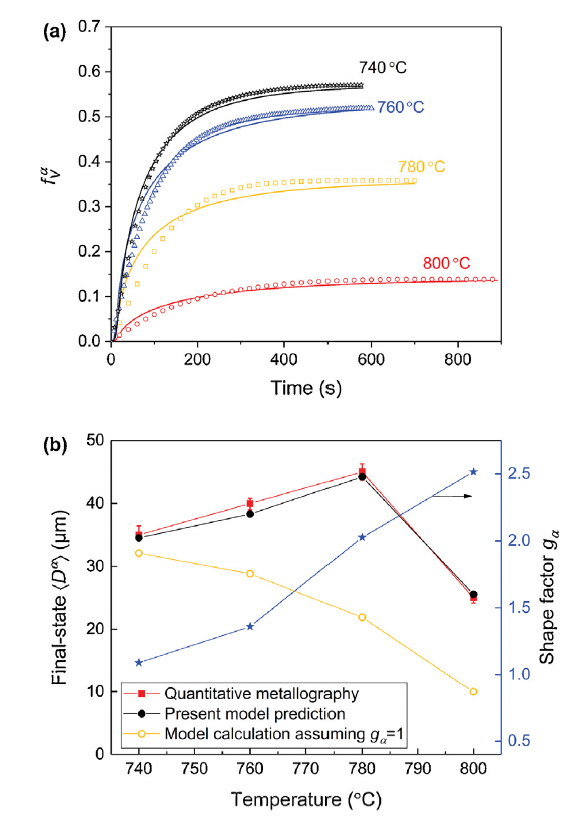
Analogously, for the ferrite transformation of Fe-0.17C-0.91Mn-1.03Si alloy at T = 740, 760, 780 and 800 °C, the calculated $\int_V^α$ using the present model associated with the experimental results obtained from the dilatation measurement of Fig. 4 is shown in Fig. 10(a). It turns out the validity of present model in predicting the overall kinetics of ferrite transformation in Fe-C-Mn-Si steels. Fig. 10(b) shows the present model calculation with regard to the final-state average grain size of ferrite in the isothermal annealing of Fe-0.17C-0.91Mn-1.03Si alloy at T = 740, 760, 780 and 800 °C associated with the quantitative metallography from Fig. 5. Meanwhile, the corresponding shape factor gα and the results from model calculations with the same parameters but gα = 1 are included in Fig. 10(b) as well; a good model prediction with the quantitative metallography can be shown. With increasing the annealing temperature, as can be seen from Fig. 10(b), the value of gα, representing the extent to which the ferrite grains deviate from the sphere, increases and gets farther away from one, which means that the ferrite grain shape is gradually changing from the strong anisotropy at high annealing temperature to the rough sphere at low temperature. This is also verified in Fig. 5, where at T = 800 °C, the allotriomorphic ferrite grain exhibits strong anisotropic shape, but as the annealing temperature decreases, the ferrite grains gradually become equiaxed. Also from Fig. 10(b), the average grain size obtained by the model calculation with gα = 1 (i.e. assuming spherical ferrite grains) decreases monotonically, which is totally different from the experimental observation.
Fig. 10. (a) $\int_V^α$ from the dilatation measurement of
The phase transformations involved in the processing of AHSS, like most solid-state transformations, consist of nucleation, growth and impingement, which are accompanied with, assisted, and even initiated by thermodynamics and kinetics. In other words, the nucleation and growth type transformations belong to the kinetic processes controlled by the thermodynamics.
Nucleation is still an extensive issue in materials science [70]. Most of the previous models focus on the interface kinetics and the effect of alloy elements on interface migration, particularly, for instance, the decarburization experiments [22,26,27] and the cyclic phase transformation of austenite↔ferrite [71,72] are carefully designed to exclude the influence of nucleation. During the practical processing, however, the nucleation process is inevitable. In the present modeling, the universally accepted classical nucleation theory is adopted, which includes two adjustable parameters: the number density of potential nucleation sites Ca and the particle shape factor gα.
Applying the same parameters as used in Section 4.2.2, the $\int_V^α$ for isothermal ferrite transformation of Fe-0.17C-0.91Mn-1.03Si alloy at T = 760 °C calculated by the general mixed-mode model [30] (assuming plane interface growth and ignoring nucleation) is illustrated as dashed line in Fig. 9(a). It can be shown that the general mixed-mode model predicts the volume fraction in the final state well, but not for the entire kinetic curve. Actually, the good prediction of the final-state volume fraction arises from the constraints of thermodynamic equilibrium, regardless of whether or not the nucleation is considered. Instead, the deviation of the kinetic curve happens to imply the neglect of the kinetic role of nucleation behavior. The present model describes both the final fraction and the kinetic process accurately, which suggests strongly that the continuous nucleation associated with the critical nucleation work is indispensable in the prediction of kinetic process. The essentially kinetic role of nucleation can be also reflected by the parameter gα, which is introduced in the present model to change the critical nucleation work ΔG* (i.e. reflected as the changed kinetic energy barrier), by minimizing the effect due to the interfacial energy through adjusting the shape of nuclei naturally.
For multi-component steels, the GEB method is becoming more and more prevalent in modeling the interface migration. There are two important physical parameters: the binding energy E0 and the chemical potential difference ΔE for the partitioning of substitutional elements inside the interphase. The effect arising from changing E0 and ΔE on the dissipations of Gibbs energy and the transition between PE and NPLE has already been fully discussed in Ref. [30]. In the present model predictions, the specific value of binding energy for Mn and Si and the ΔE directly calculated from Thermo-Calc are used, and an infinite interface mobility is assumed for the austenite-to-ferrite transformation of Fe-C-Mn-Si steels, since the intrinsic interface mobility only leads to energy dissipation at the very high interface velocity [30]. Moreover, the total dissipation is defined as the simple sum of respective dissipation due to the interaction of Mn and Si with migrating interface (see Fig. 8(a)). However, the segregation of Mn to the interface may influence the segregation of Si through the solute-solute interaction, i.e. the coupled solute drag effect. Since an attractive interaction occurs between Mn and Si, namely, that the presence of one may enhance the segregation levels of the other, the total solute drag effect may be greater than the sum of solute drags expected from each element alone [26,27]. In addition, since the value of intrinsic interface mobility is quite controversial, it still requires a lot of work to verify its effect on the energy dissipation and then the model predictions. One way out of this predicament would be to introduce an effective interface mobility Meff to capture all the effects of solute drag as usually used in Refs. [[73], [74], [75], [76]].
According to Christian's work [11], the interface rate v can be described as the product of the interface mobility and the driving force for interface migration, and the (effective) interface mobility Meff is generally assumed to follow an Arrhenius temperature dependence of the form [77],
Meff≡M0exp($-\frac{Q_{Meff}}{RT}$)=$\frac{v}{ΔG_m^{chem}}$ (33)
where M0 is the pre-exponential factor of effective mobility, assumed as its intrinsic value, and QMeff is defined as the transformation-dependent effective activation energy, which are totally different from the previous works [[73], [74], [75], [76]]. Taking the value of M0 suggested by Hillert and Hoglund [74], the evolution of QMeff with the normalized driving force ΔGchem/$ΔG_{chem}^{initial}$ for T = 740, 760, 780, 800 °C is according to the GEB method (Section 3.2 and Fig. 8(b)) calculated and illustrated in Fig. 11, where a trade-off evolution law between QMeff andΔGchem/$ΔG_{chem}^{initial}$ can be found. It should be noted that the contribution of interface friction is neglected during the present calculation of interface migration due to the infinite mobility, whereas the value selection of M0 does not affect the trade-off correlation of QMeff andΔGchem/$ΔG_{chem}^{initial}$. As described in the works of Liu's group [[78], [79], [80]], thermodynamics reflects the driving force, which promotes transformation; whereas kinetics, controlled by the energy barrier (or activation energy), actually inhibits transformation. Thermodynamics is closely intertwined with kinetics, and there should be an explicit relationship between the thermodynamic driving force and the kinetic barrier during the phase transformation. The thermo-kinetic correlation defined therein, as a universal law, can be drawn as: the increased thermodynamic driving force is always accompanied with the decreased kinetic energy barrier and vice versa [[78], [79], [80]].
Fig. 11. Calculated QMeff as a function of the normalized driving forceΔGchem/$ΔG_{chem}^{initial}$ for interface migration (or growth) during the isothermal austenite-to-ferrite transformation of Fe-0.17C-0.91Mn-1.03Si alloy.
As for the interaction of solute components with migrating interface, the evolution path of the four different theoretical approaches, i.e. the solute drag force [23,24], the Gibbs energy dissipation [25], the effective interface mobility [[73], [74], [75], [76]] and the present effective activation energy, does highlight that the effects of solute-interface and solute-solute interaction on retarding the transformation are all implicitly incorporated in the evolution of QMeff withΔGchem/$ΔG_{chem}^{initial}$, i.e. the thermo-kinetic correlation in the present case. Since the thermo-kinetic correlation embodies the scenarios of these interactions3(3 For the overall transformation process, it should be noted that, the kinetic energy barrier should not be a local quantity pertaining to one moving interface, but rather a cumulative or overall effective variable describing the threshold value for the transformation onset and advancement on the systems evolution.), the retarding effects can be easily solved, provided if the correlation can be determined, e.g. by the big-data based machine learning.
In order to acquire more information on the evolution of grain size, using the quantitative metallography, the grain-size distributions of ferrite in the final state of isothermal annealing corresponding to T = 740, 760, 780 and 800 °C are shown in Fig. 12. All the grain-size distributions are fitted with a lognormal distribution defined by the following equation [55]:
$\int(dα)=\frac{1}{\sqrt{2π}ωd_α}exp[-\frac{(lnd_α-m)^2}{2ω^2}]$ (34)
where m and ω are the median value and standard deviation, respectively, of the variable ln dα. The expectation and the standard deviation of dα, $μ_{d_α}$ and $σ_{d_α}$, respectively, are given by $μ_{d_α}$=em+ω2/2 and $σ_{d_α}=\sqrt{e^{2m+ω^2}(e^{ω^2}-1)}$ . The calculated values $μ_{d_α}$ and $μ_{d_α}$ are listed for T = 740, 760, 780 and 800 °C in Table 2. It can be found from Fig. 12 that the grain-size distributions obtained from the experiment essentially satisfy the lognormal distribution, which can reflect the nucleation behavior in nature, while all the values of standard deviation are large indicating that the grain size in the final state is not concentrated. In the early stage of isothermal ferrite transformation, since the nucleation behavior of the shape-preserved ferrite grains is uniform, the grain-size distributions should be similar and independent of the annealing temperatures. In the later stage of transformation, the grain-size distributions seem obviously different depending on the annealing temperatures, which is apparently caused by the different behaviors of growth and impingement with different ferrite grain shapes. As described earlier, the ferrite is mainly nucleated at the austenite GBs, so the evolution of ferrite grain-size distribution (Fig. 12) or the evolution of average ferrite grain size (Fig. 10(b)) with the annealing temperatures should be dependent on the average value of initial austenite grain size and its distribution as well. The austenite grain size may play an important role in the nucleation, growth and impingement of ferrite. Since the present work only focuses on the model development and application, discussions on the effect of the initial microstructure state of austenite and the alloy compositions on the results will be present in our future work.
Fig. 12. Ferrite grain-size distributions (bars) of Fe-0.17C-0.91Mn-1.03Si alloy in the final state of isothermal annealing. Lines show the lognormal fit according to Eq. (34).
Table 2 Mean value and standard deviation of the ferrite grain-size distributions calculated by fitting lognormal distributions.
| Temperature | $μ_{d_α}$(μm) | $μ_{d_α}$(μm) |
|---|---|---|
| 740 °C | 40.9 | 34.1 |
| 760 °C | 60.7 | 67.1 |
| 780 °C | 62.0 | 65.6 |
| 800 °C | 16.8 | 18.9 |
Accurately predicting the kinetics and the microstructural evolution of the modern multi-component high-strength steels is still a huge challenge. Sietsma [81] has indicated that the microstructural modeling during materials processing should go beyond the classical JMAK-like theories considering only the average characteristic quantities. Indeed, it is evident that, besides of the volume fraction and the average grain size, information on grain-size distributions, morphology, spatial distribution of grains and phases and so forth can also play more important role in building the processing-microstructure-property relationship. As depicted in the introduction, the 3-D phase-field simulation and the mixed-mode CA model for the austenite-to-ferrite transformation can provide the microstructural information mentioned above. However, the evolution of these listed microstructural characteristics during transformation process is very difficultly accessible in experimental measurements; moreover, the simulations of complex microstructures require the very long computation times. Therefore, at the current stage, the average microstructural characteristics still have important practical significance, e.g. in the high-throughput computing for the processing design of AHSS, due to their simplicities for theoretical modeling and experimental characterization.
Compared with the 3D topological model of Fang et al. [57] which uses mixed-mode model with effective interface mobility under PE condition, the present modeling adopts the general mixed-mode growth model based on the GEB principle and the overall kinetics framework based on the grain boundary nucleation theory and the microstructural path method. Although it cannot output the grain-size distributions as the 3D geometric topological simulation, the present model has a concise analytical form and good prediction abilities for the ferrite volume fraction and the average grain size (see Fig. 9, Fig. 10). Unlike other JMAK-like models which estimate the average grain size of product phase by assuming the pre-existed nuclei or by utilizing the phenomenological nucleation rate in untransformed matrix (eliminating the phantom nuclei) [31], the main advantage of present model is to accurately calculate the instant average grain size of ferrite during the transformation through the real ferrite/austenite interface area density and the impinged boundary area density of ferrite grains (see Fig. 9(b)). It is very useful for the case of non-random nucleation under which the real nucleation rate is almost unable to estimate by the phenomenological treatment due to the break of random feature of JMAK theory. In addition, the ferrite/austenite interface area density will be the key input parameter in the subsequent bainite and/or martensite transformation kinetics [6,7]. The present modeling is flexible enough to be a paradigm, which can be expected to use for a wide range of phase transformations, such as the inverse austenite transformation, the bainitic ferrite transformation and the martensite transformation. Meanwhile, it should be mentioned that the current theoretical framework is independent of the heat-treatment path of austenite-to-ferrite transformation, so it could be applied to the non-isothermal phase transformation processes by simple revisions (mainly including the numerical integration of temperature).
There are two main drawbacks with regard to the present model. As seen from Fig. 12, the ferrite grain-size distributions spread a wide range from a few microns to tens of microns. Just similar to JMAK theory, the present model cannot predict the ferrite grain-size distributions. Furthermore, the mixed-mode growth model based on the GEB principle in present work only considers the bulk diffusion of C without the partitioning of substitutional elements, so the present model is still under the thermodynamic limits of non-partitioned growth. It means that the model is not suitable for long-time holding transformation controlled by the bulk diffusion of substitutional elements.
In the present work, a flexible kinetic and microstructural predictive model for isothermal austenite-to-ferrite transformation was derived. This model can output the ferrite volume fraction, the austenite/ferrite interface area per unit volume, and the average grain size of ferrite, which can serve as the input parameters for modeling the subsequent bainite or martensite transformations. Application of the present model to the experiment measurement of Fe-0.17C-0.91Mn-1.03Si (wt%) at different temperature demonstrates its good effectiveness. In terms of the model predictions, a thermo-kinetic correlation between the chemical driving force of the interface migration and the corresponding kinetics barrier was illustrated, through which all the effects of solute-interface interaction and solute-solute interaction on retarding transformation could be included.
This work was financially supported by the National Key R&D Program of China (Nos. 2017YFB0703001 and 2017YFB0305100), the National Natural Science Foundation of China (Nos. 51134011, 51431008, 51790483 and 51801157), the Fundamental Research Funds for the Central Universities (No. 3102017zy064), the Research Fund of the State Key Laboratory of Solidification Processing (Nos. 117-TZ-2015, 159-QP-2016). Thank the Analytical & Testing Center of Northwestern Polytechnical University for Equipment Support. S.J. Song also acknowledges financial support from the Top International University Visiting Program for Outstanding Young Scholars of Northwestern Polytechnical University and the China Scholarship Council (CSC) Scholarship.
The authors have declared that no competing interests exist.

 WeChat
/
| 〈 |
|
〉 |


