Search for articles:
Bozhou Chen , Jiafeng Zhou
Corresponding authors:
Received: 2018-09-20
Revised: 2018-11-16
Accepted: 2018-11-26
Online: 2019-06-20
Copyright: 2019 Editorial board of Journal of Materials Science & Technology Copyright reserved, Editorial board of Journal of Materials Science & Technology
More
Abstract
A couple of layered Li-rich cathode materials Li1.2Mn0.54Ni0.13Co0.13O2 without any carbon modification are successfully synthesized by solvothermal and hydrothermal methods followed by a calcination process. The sample synthesized by the solvothermal method (S-NCM) possesses more homogenous microstructure, lower cation mixing degree and more oxygen vacancies on the surface, compared to the sample prepared by the hydrothermal method (H-NCM). The S-NCM sample exhibits much better cycling performance, higher discharge capacity and more excellent rate performance than H-NCM. At 0.2 C rate, the S-NCM sample delivers a much higher initial discharge capacity of 292.3 mAh g-1 and the capacity maintains 235 mAh g-1 after 150 cycles (80.4% retention), whereas the corresponding capacity values are only 269.2 and 108.5 mAh g-1 (40.3% retention) for the H-NCM sample. The S-NCM sample also shows the higher rate performance with discharge capacity of 118.3 mAh g-1 even at a high rate of 10 C, superior to that (46.5 mAh g-1) of the H-NCM sample. The superior electrochemical performance of the S-NCM sample can be ascribed to its well-ordered structure, much larger specific surface area and much more oxygen vacancies located on the surface.
Keywords:
With increasing environmental issues and the massive consumption of fossil fuel, the environment-friendly and high-energy density lithium ion batteries (LIBs) have been considered to be a promising electric storage technology for electric vehicles and renewable energy power stations [1], [2], [3]. However, the limitation in energy density of the present LIBs cannot satisfy application requirements due to the insufficient specific capacity of cathode materials. Layered oxide materials, especially the Li-rich layered materials, have rapidly attracted attention recently due to their high specific capacities compared to the conventional cathode materials. However, these layered oxide materials also suffer several deficiencies, including low initial coulombic efficiency, poor cycling performance, poor rate capability, and gradual voltage decay during cycling, all of which hinder their practical applications [4], [5], [6].
Many efforts such as, element doping [7], preparation nanosized materials and surface modification [8] have been devoted to improve the electrochemical properties of these Li-rich layered oxide materials. The initial coulombic efficiency of layered oxide materials can be increased by coating carbon materials or metal oxides [9,10], which can keep the electrode materials from direct contact with the electrolyte. The rate performance of layered oxide materials can be enhanced through preparing nanostructure or porous structure, which could provide the shorter diffusion length for Li ions. However, there still exist some limitations in these methods and the electrochemical performance needs to be improved further [11,12]. Since the electrochemical performance of electrode materials primarily depends on the synthetic route, which has a significant impact on morphology, particle size, phase purity, crystallinity, and oxygen activity [11,13]. So the optimization of synthesis route is essential to obtain the Li-rich layered materials with superior electrochemical performance. In the previous studies, the Li-rich layered oxide materials have been synthesized through various methods, such as, sol-gel method [13], co-precipitation method [14], solid state reaction method and so on. These conventional methods often synthesize the undesirable materials with irregular morphology and impure structure, causing the materials to have a relatively poor electrochemical performance [13,15]. Compared to these conventional material synthesis methods, the solvothermal and hydrothermal methods are promising in crystal growth process. Such two methods bring to the productions possessing the ideal morphologies and the lager specific surface area with much more oxygen vacancies, which possibly enhance electrochemical properties [16]. Hydrothermal synthesis method of Li-rich layered materials has been usually used to obtain high-performance cathode materials in LIBs recently. However, how to improve the electrochemical performance of Li-rich layered oxide materials through the solvothermal synthesis route is still lacking at present. To explore the effect of the synthesis method on the electrochemical performance of layered oxide materials, the Li-rich layered materials Li1.2Mn0.56Ni0.13Co0.13O2 (LMNCO) were synthesized through both the solvothermal and hydrothermal method using ethanol and water as the solvents, respectively. In above material preparation process, no additional carbon modification is designedly added. So, it is beneficial to study the effect of synthesis process itself on the electrochemical performance of Li-rich layered materials. The reason for choosing the LMNCO material is its much larger discharge capacity over 250 mAh g-1, the higher operating voltage (>3.5 V vs. Li/Li+), the lower cost, the less toxicity, and the higher safety [6,14,17]. And we found that a proper solvent can play an important role in determining the electrochemical performance of LMNCO. The LMNCO sample prepared using the ethanol solution has a much larger discharge capacity, the higher cycle stability and rate capability compared to the LMNCO sample prepared by the hydrothermal method.
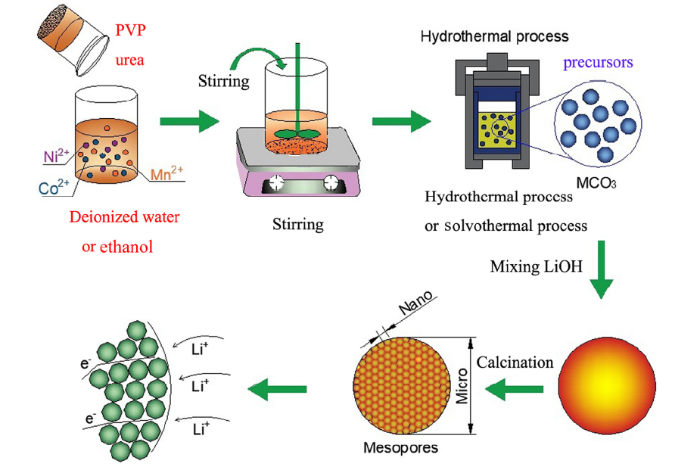
Two morphological Li1.2Mn0.54Ni0.13Co0.13O2 (LMNCO) cathode materials were prepared by solvothermal and hydrothermal synthesis methods. In a typical solvothermal synthesis process, stoichiometric amounts of Ni(CH3COOH)2•4H2O (99%, Sinopharm Chemical Reagent), Co(CH3COO)2•4H2O (99%, Sinopharm Chemical Reagent) and Mn(CH3COO)2•4H2O (99%, Sinopharm Chemical Reagent) were chosen as the starting materials. Polyvinyl pyrrolidone (PVP, 99%, Sinopharm Chemical Reagent) and urea (99%, Sinopharm Chemical Reagent) were used as the additives and ethanol was used as the solvent. Both the starting materials and the additives were dissolved in 80 mL ethanol and stirred for 5 h to obtain a homogeneous brown solution. The solution was removed into a 100 mL Teflon-lined stainless steel autoclave and heated at 180 °C for 10 h, and then cooled down to room temperature. The obtained precursors were filtered, washed and dried at 80 °C for 24 h in a vacuum oven. The dried precursors were mixed with LiOH•H2O (99%, Sinopharm Chemical Reagent) in a molar ration of 1:1.26 (5% atomic excess of lithium was added to compensate possible evaporative losses of lithium during the calcination at high temperature). Then the as-prepared mixture was heated at 450 °C for 6 h and 900 °C for 12 h in air to obtain the final LMNCO powders. For comparison, the LMNCO powders were also synthesized by a hydrothermal method using deionized water as the solvent. The sample preparation process is similar to that of the solvothermal method as aforementioned. Hereafter, the LMNCO materials synthesized by the solvothermal and hydrothermal methods are abbreviated as S-NCM and H-NCM, respectively. The synthesis steps for both the S-NCM and H-NCM materials are schematically illustrated in Fig. 1.
Fig. 1. Schematic diagram of preparation process of S-NCM and H-NCM materials.
The structure and phase purity of the as-prepared samples were characterized by the powder X-ray diffraction (XRD) with CuKα radiation. The XRD spectra were collected in the 2θ range of 10°-80° at a scanning rate of 1°/min and a step size of 0.02°. Rietveld refinement was performed on the XRD data to obtain the lattice parameters. X-ray photoelectron spectroscopy (XPS; VGESCA-LABMK II) was used to determine the ion valence states in the metal oxide. The morphologies of the as-synthesized samples were examined by a field-emission scanning electron microscopy (FE-SEM, SU 8020, HITACHI). Transmission electron microscopy (TEM) was performed on a Hitachi H-7650 to examine the microstructure of S-NCM and H-NCM powders. The specific surface area was measured by the Bruauer-Emmett-Teller (BET, Oishop 100CX, Coulter). Raman spectra were measured with the 514.5 nm line of an argon ion laser (Spectra-Physics 2017) at 300 K.
The electrochemical properties of the S-NCM and H-NCM samples were tested using 2032 coin-type cells with a lithium metal anode. For fabrication of the cathodes, the prepared active materials, acetylene black and polyvinylidene fluoride (PVDF) with the weight ratio of 8:1:1 were mixed in N-methyl-2-pyrrolidone (NMP) solution. And then the slurry was coated onto a polished Al foil and dried at 80 °C for 12 h under vacuum. The electrolyte was composed of 1 mol/L LiPF6 solution in ethylene carbonate (EC) and dimethyl carbonate (DMC) mixture solution with a volume ratio of 1:1. The Galvanostatic charge and discharge tests were carried out in a potential range of 2-4.8 V (vs. Li/Li+) at room temperature using a Land battery testing instrument (Wuhan, China). Electrochemical impedance spectroscopies (EIS) of all samples were measured in the frequency range of 0.01 Hz to 100 kHz.
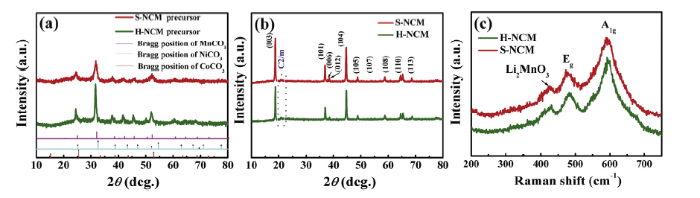
Fig. 2 (a) and (b) shows the XRD patterns of LMNCO powders and the precursors. As a reference, the position and the relative intensity of the standard diffraction peaks of MnCO3, CoCO3 and NiCO3 are shown in the bottom of Fig. 2(b). From the figure, we can see that the XRD patterns of both the precursors match well with those of the standard carbonate references [18]. However, the peak intensity of the two precursors is quite different. The S-NCM precursor has a rather weaker XRD peaks than that of the H-NCM sample, indicating a well-crystallized H-NCM precursor. Such a crystalline difference of the precursors plays an important role on the primary particle size of the LMNCO powders. The H-NCM precursor is apt to form much larger primary particles than that of S-NCM due to the higher nucleation rate shown in the SEM images. For the S-NCM and H-NCM powders, Fig. 2(a) shows that both the samples exhibit typical XRD patterns corresponding to α-NaFeO2 hexagonal type structure with a space group of R-3 m [19,20]. No any impurity phase peaks appear in both the XRD patterns, indicating high purity of the as-prepared materials. The weak supper lattice reflections around 2θ = 20°-25° indicates the presence of Li2MnO3 phase with a space group of C2/m, ascribed to the short-range ordering of Li and Mn atoms in the transition-metal layers [13,21]. Moreover, there also exists an obvious splitting phenomenon in the XRD patterns between the adjacent peaks of (006)/(012) and (108)/(110), confirming that both the S-NCM and H-NCM samples have a well-organized layered structure [22].
Fig. 2. XRD patterns of (a) Li1.2Mn0.54Ni0.13Co0.13O2 precursors, (b) Li1.2Mn0.54Ni0.13Co0.13O2 powders, and (c) Raman spectra of S-NCM and H-NCM materials.
To deeply understand the structural and crystalline information of the S-NCM and H-NCM materials, the rietveld refinement was performed on the XRD spectra and the results are shown in Fig. S1(a) and (b) in supplementary material, respectively. From the fitting results, the lattice parameters can be calculated and exhibited in Table 1. The c/a ratios of H-NCM and S-NCM samples are 4.91 and 4.98, respectively. They are greater than the crucial lattice constant of 4.899, indicating the presence of high cation ordering in the lattice. Moreover, S-NCM has a much larger c/a ratio value than that of H-NCM, showing much higher cation ordering in S-NCM. In general, peak intensity ratio of the (003) and (004) diffraction peaks I(003)/I(104) is considered to be an important parameter to reveal the cation mixing between Ni2+ and Li+ ions due to their similar ionic radii. The value of I(003)/I(104)<1.2 is an indication of the undesirable cation mixing occurred in the lattice [22,23]. The I(003)/I(104) ratio of the S-NCM and H-NCM samples are calculated to be 1.47 and 1.31, respectively, as shown in Table 1. Both the I(003)/I(104) ratio value are larger than 1.2, implying a much lower degree of cation mixing, which is favorable to the enhancement of electrochemical cycling stability. Moreover, the S-NCM sample has a much larger I(003)/I(104) ratio value, indicating that the S-NCM sample has the lower cation mixing degree and the more well-ordered structure than that of H-NCM, leading to the improved electrochemical performance as discussed below.
Table 1 Structure and morphology parameters of S-NCM and H-NCM samples.
| Sample | a (Å) | c (Å) | c/a | I(003)/I(104) | Surface area (m² g-1) | Pore volume (cc g-1) |
|---|---|---|---|---|---|---|
| H-NCM | 2.9134 | 14.3109 | 4.912 | 1.31 | 4.606 | 0.007 |
| S-NCM | 2.8729 | 14.3201 | 4.985 | 1.47 | 6.39 | 0.015 |
Raman spectroscopy was used to further verify the structure of the samples and the results are shown in Fig. 2(c). Raman spectra data were recorded from 200 to 750 cm-1. As shown in Fig. 2(c), both two samples present three Raman bands around 425, 474 and 593 cm-1, consistent with the theoretical prediction for the hexagonal and monoclinic crystals [24]. The sharp Raman peaks around 593 and 474 cm-1 are corresponding to the A1g vibrations with symmetrical stretching of M-O (M=Ni, Co, Mn) and the Eg vibrations with symmetrical deformation, respectively. The result shows that both the studied samples have a perfect layered structure with a R-3 m symmetry [25].
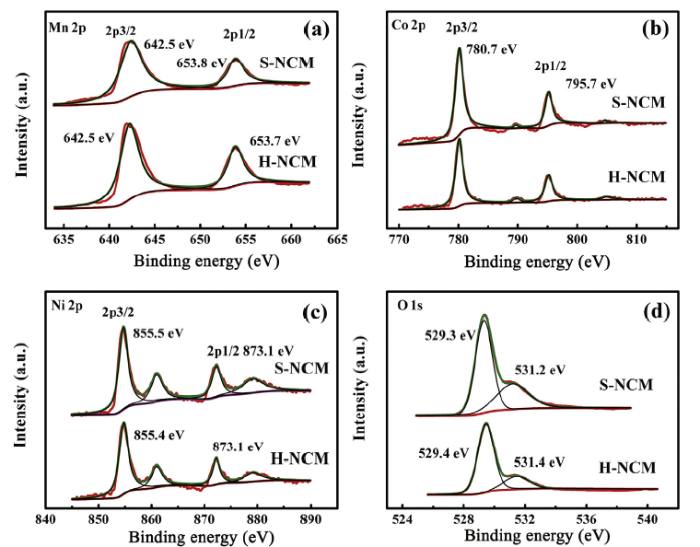
XPS measurement is carried out to determine the oxidation states of Mn, Ni, Co and O elements in the S-NCM and H-NCM samples, the results are shown in Fig. 3. In the Mn 2p spectra, the major Mn 2p3/2 and Mn 2p1/2 peaks are located at 642.5 and 653.8 eV, respectively, which are agree well with the literature data on MnO2, demonstrating that the oxidation state of Mn is +4 in the studied materials [6,12]. In the Ni 2p spectra, the main Ni 2p3/2 and Ni 2p1/2 peaks are observed at 855.5 and 873.1 eV, indicating the presence of Ni2+ state. The Co 2p3/2 and Co 2p1/2 peaks are observed at 780.7 and 795.7 eV, respectively, indicating that most of cobalt ions are formatted in the state of Co3+ [9,14]. In the O 1 s spectra, the peak located at 529.3 eV can be assigned to the lattice oxygen in the Li-rich material. It should be noted that there also exists an obvious peak at 531.4 eV position, which matches well with the CO32- binding energy [13]. The result shows that some lattice oxygen is extracted through the form of CO2, resulting into the formation of oxygen vacancies on the material surface. Besides, from the XPS fitting, the real content of the oxygen vacancies in the S-NCM and H-NCM materials are 36.5% and 18.2%, respectively. The content of oxygen vacancies in the S-NCM sample is nearly twice larger than that of the H-NCM sample. The existence of a certain amount of oxygen vacancies in a Li-rich material may play a useful role in its electrochemical properties due to the following reasons: (1) The oxygen vacancies on material surface can hinder the highly reactive oxygen radicals from generating during the charge/discharge process; (2) The resistance of Li-ion migration can be reduced by oxygen vacancies, and make the trapped Li ions have more opportunities to escape from the tetrahedral sites and form the better diffusion process; (3) The oxygen vacancies can enhance the electronic conductivity of the materials and resulting in the less electrode polarization [13,26].
Fig. 3. XPS spectra of (a) Mn 2p, (b) Co 2p, (c) Ni 2p and (d) O 1 s for S-NCM and H-NCM materials.
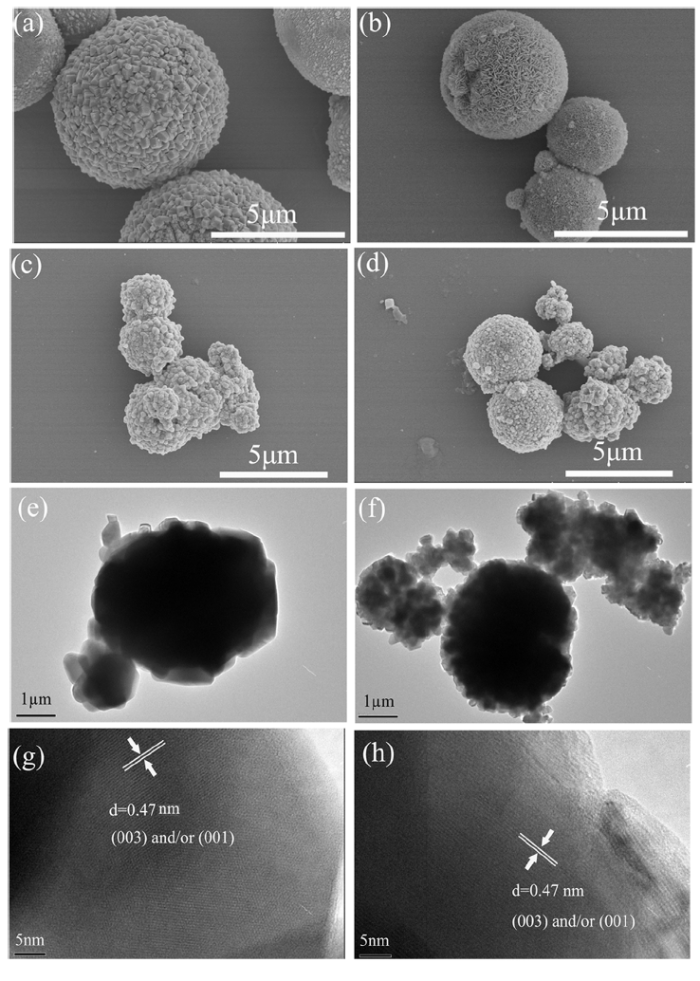
Fig. 4(a)-(d) shows the SEM images of the H-NCM and S-NCM powders and their precursors. Both the H-NCM and S-NCM powders are composed of the primary nanoparticles with several hundred of nanometers in sizes and the secondary particles with the sizes of 3-5 μm. And the primary nanoparticles and the secondary micro particles are in the form of a spherical-like shape. There still exist remarkable differences between the morphologies of the H-NCM and S-NCM powders as well as their precursors, which can be summarized as follows: (i) The precursor of the H-NCM sample has a uniform spherical morphology in the sizes of 3-5 μm, which is assembled by the primary polyhedral particles with the sizes of 200-300 nm. However, the spherical particle (3 μm in diameter) of the S-NCM precursor is composed of the thin interconnected nanoplates with an average thickness of 25 nm. That is to say, the S-NCM precursor material has a 3D porous hierarchical microstructure. Such a microstructure is favorable to the formation of uniform and stable structure in the subsequent calcination. (ii) As the precursor is mixed with LiOH•H2O and sintered at high temperatures, the spherical-like second particles of the S-NCM powder maintain completeness and uniformity. However, most second particles of the H-NCM powder exhibit an imperfect spherical morphology. (iii) The size of the primary particles for the S-NCM sample is about 100 nm, which is smaller than that (200-300 nm) of the H-NCM sample. And the values of pore volume and porosity for the S-NCM sample are bigger than that of H-NCM as shown in Fig. S2, where the N2 adsorption and desorption isotherms, the corresponding Barret-Joyner-Halenda (BJH) pore-size and surface area distribution of the H-NCM and S-NCM samples are plotted. As a result, the specific surface area of the materials increases undoubtedly as shown in Fig. S2 and Table 1. The S-NCM sample shows much larger Brunner-Emmet-Teller (BET) specific surface area (6.390 m² g-1) than that of the H-NCM sample (4.606 m² g-1). Such a large specific surface area can provide more Li-ion transport pathways and more active sites for high-efficiency electrochemical reactions, and then obtain the excellent rate and cyclic performance [2,18]. The obvious morphological differences of two studied samples are closely related to the solvent used in the material synthesis process. It is generally considered that the properties of solvents, such as, redox, acidity, polarity, viscosity and adsorbability in the low-temperature liquid synthesis technology play an important effect in determining the formation of phase, size and morphology of particles [16]. In the present solvothermal synthesis process, alcohol acts as not only a solvent to dissolve metal ions, but also a surface modifier to promote the growth of surface particles and the formation of oxygen vacancies, resulting into the more ideal second particles with the well-regulated morphology and the more oxygen vacancies on the surface of the materials. However, the role of water used in the hydrothermal synthesis process is just a solvent to dissolve the raw materials, no such a surface-modifying role in the material growth process [13,18].
Fig. 4. SEM images of (a) H-NCM precursors, (b) S-NCM precursors, (c) H-NCM powders, (d) S-NCM powders, (e, f) TEM and (g, h) HRTEM images of (e, g) H-NCM and (f, h) S-NCM samples (d: lattice fringe spacing).
To further explore the morphology and the microstructure of the S-NCM and H-NCM particles, TEM and HRTEM measurements were performed and the images are shown in Fig. 4(e)-(h). The morphology of the S-NCM and H-NCM microspheres is in accordance with the SEM images. As shown in the TEM images, the second particles of the S-NCM sample were composed of much more nanoparticles than that of the H-NCM sample, showing a well-defined crystallographic structure. The bright area shown in Fig. 4(e) and (f) is an indication of the existence of a porous structure, which can provide the more active surface area for electrolyte penetration to the inner nanoparticles and high-efficiency electrochemical reaction. Obviously, the bright area in the TEM images of the S-NCM sample is much larger than that of the H-NCM material, implying the much more porous structures exist in the S-NCM sample. Furthermore, HRTEM images of two samples show a well-ordered atomic columns and the atomic columns are separated by a distance of 0.47 nm, which is well indexed to the (003)Hex plane of LiMnO2 and/or the (001)Mon plane of Li2MnO3 [22,24,27], as shown in Fig. 4(g) and (h).
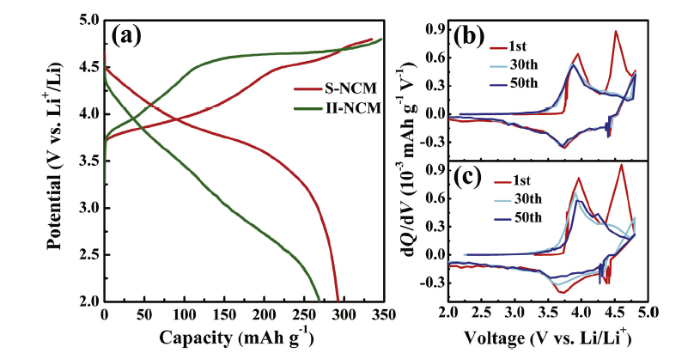
The initial charge and discharge curves of the S-NCM and H-NCM electrodes at 0.2 C (1 C = 250 mA g-1) in the potential range of 2.0 to 4.8 V are shown in Fig. 5(a). Both the initial charge curves have two potential plateaus: one is located at 3.5-4.5 V and the other is at about 4.5 V. The first plateau below 4.5 V is corresponding to the oxidation-reduction reactions of Ni2+/4+ and Co3+/4+. The second plateau at about 4.5 V is related to the activation of Li2MnO3, including the extraction of Li+ from lithium and transition metal layers along with extraction of oxygen atoms from lithium layers [28], [29], [30]. It can be seen from Fig. 5(a), the initial charge curve of the S-NCM electrode lies below that of the H-NCM electrode, while the discharge curve of the S-NCM electrode is above that of the H-NCM one. The result shows that the S-NCM electrode has much lower polarization compared to the H-NCM electrode [21]. The decreased polarization of the S-NCM electrode may originate from the enhanced electronic conductivity as aforementioned. Furthermore, the S-NCM electrode also delivers much higher initial discharge capacity than that of the H-NCM electrode. The initial discharge capacities of the S-NCM and H-NCM electrodes are 292.3 and 269.2 mA h g-1, respectively. The initial discharge capacity of the S-NCM electrode is close to the theoretical discharge capacity of the material.
Fig. 5. (a) Initial charge and discharge profiles for S-NCM and H-NCM electrodes, dQ/dV plots of (b) S-NCM and (c) H-NCM samples at 0.2 C rate between 2.0 and 4.8 V.
The differential capacity vs. voltage plots (dQ/dV plots; Q: specific capacity of electrode material; V: potential of electrode material) of the S-NCM and H-NCM electrodes for the 1 st, 30th and 50th cycles at current density of 0.2 C in the potential range of 2.0-4.8 V are shown in Fig. 5(b) and (c), respectively. The dQ/dV plots are calculated from the data of the charge/discharge profiles. From Fig. 5(b) and (c), two main anodic peaks located at about 4.0 and 4.5 V can be obviously observed in the initial charging curves for both the S-NCM and H-NCM electrodes. The initial anodic peaks at $\widetilde{4}$.0 V should correspond to the oxidation process of Ni2+ and Co3+ to Ni4+ and Co4+, and the 4.5 V peak can be attributed to the activation process of Li2MnO3 [31], [32], [33]. After the first cycle, the anodic peaks at $\widetilde{4}$.0 V gradually move to the lower potential position, and the 4.5 V peak almost disappeared. There are two broad peaks located at about 3.7 and 4.4 V can be observed in the discharge curves. The 4.4 V peak in the reduction process can be ascribed as Li occupation within the Li2MnO3 lattice, and the 3.7 V peak corresponds to the reaction process of Ni4+ and Co4+ in the layered structure [14,33]. From Fig. 5(b) and (c), we can see that both the 3.7 and 4.4 V peaks of the H-NCM electrode move to the lower potential position rapidly and the intensity of peak at $\widetilde{3}$.7 V decreases considerably from the 1 st cycle to the 30th or 50th cycle. However, the cathodic peaks of the S-NCM electrode almost keep unchanged from the 1 st cycle to the 50th cycle, showing the more stable structure and then the excellent electrochemical reversibility as aforementioned.
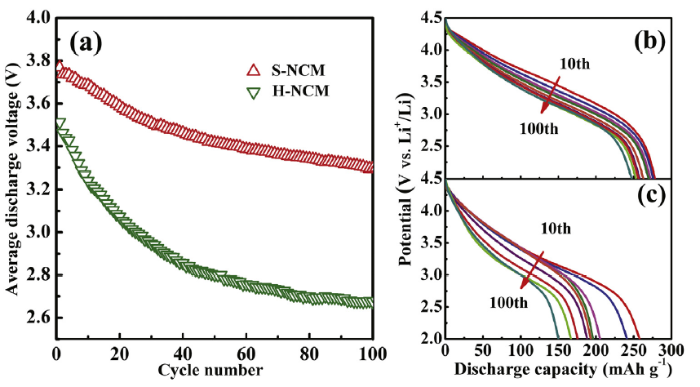
After the first cycle, the discharge curves appear a continuous drift of the potential to the lower voltages on cycling, as showed in Fig. 6(b) and (c). And the discharge curve of the H-NCM sample moves quickly to the lower potential than of S-NCM, indicating that the S-NCM sample with well-regulated morphology and well-ordered structure can effectively maintain their structural integrality during cycling processes [1,3]. Fig. 6(a) shows the average discharge voltages of the S-NCM and H-NCM electrodes during the first 100 cycles. From the figure, we can see the S-NCM sample exhibits the higher average discharge voltages and the slower rate decline than the H-NCM sample. As shown in Fig. 6(a), the average discharge voltage value of S-NCM decreases from 3.77 V to 3.30 V, whereas the corresponding values of the H-NCM samples are from 3.51 V to 2.68 V. These results indicate that the S-NCM sample can maintain the higher average discharge voltages of lithium ion batteries than the H-NCM sample during cycling. And the phenomenon of voltage decay is the result of the undesired structure transformation in Li-rich layered materials [3,6].
Fig. 6. (a) Average discharge voltage, discharge voltage profiles from galvanostatic cycling of (b) S-NCM and (c) H-NCM.
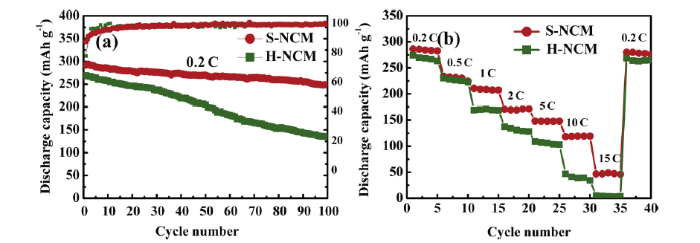
Fig. 7(a) shows the cycling performance and coulombic efficiency of the S-NCM and H-NCM electrodes at 0.2 C rate during 150 cycles. The initial coulombic efficiencies of the S-NCM and H-NCM electrodes are 87.5% and 77.8%, which are smaller than 90%, suggesting a large capacity lost during the initial cycle. The low initial columbic efficiency in these lithium-rich layered cathode materials is mainly related to the irreversible extraction of lithium ions and oxygen atoms from Li2MnO3 in the first charge process, only a part of lithium ions can insert in the material again in the first discharge process. The above reaction processes can be described in Eq. (1), (2), (3):
xLi2MnO3 · (1-x)LiMO2 → xLi2MnO3· (1-x)MO2 + (1-x)Li+ (1)
xLi2MnO3 · (1-x)MO2 → xMnO2 · (1-x)MO2 + xLi2O (2)
xMnO2 · (1-x)MO2 + Li+ → xLiMnO2 · (1-x)LiMO2 (3)
Fig. 7. (a) Cycling stability at 0.2 C rate and (b) rate performances of S-NCM and H-NCM electrodes.
Moreover, the low initial columbic efficiency may also originate from the side reactions with the electrolyte and the formation of the solid electrolyte interface film [17,34,35].
For the H-NCM electrode, in the first charge process, when the charge voltage is higher than 4.5 V, the main reaction should relate to the lithium and oxygen extraction process (Li2MnO3 →MnO2 + 2Li+ + O + e-). However, in the S-NCM sample, large amount of oxygen vacancies have already formed on the surface of the material, the irreversible reaction related to the oxygen extraction in the first charge process is reduced, resulting into the much higher initial columbic efficiency of S-NCM sample. The discharge capacity of the H-NCM electrode fades rapidly to 108.5 mA h g-1 after 150 cycles, showing a quite low capacity retention of 40.3%. Compared to the H-NCM electrode, the cycling stability of the S-NCM electrode is more excellent. The S-NCM electrode can still deliver a quite larger discharge capacity of 235 mA h g-1 after 150 cycles, which is about 80.4% of the initial discharge capacity. To further prove that the S-NCM sample has a desired cycling stability at high rate. We provide the discharge capacity vs. cycling number at 2 C rate and the capacity retention of the S-NCM electrode is 71.6%, as shown in Fig. S3. It is seen that the cycling performance is improved obviously by the solvothermal method. The excellent cycling stability of the S-NCM electrode should originate from much lower cation mixing in the lattice, much more oxygen vacancies and the better morphology compared to the H-NCM material.
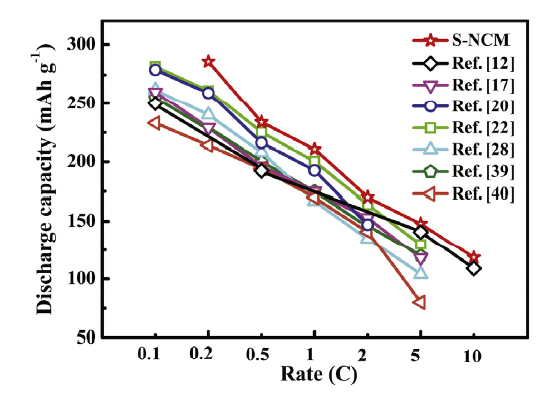
The rate capability of the S-NCM and H-NCM electrodes and the variations of discharge capacity with rate current are shown in Fig. 7(b). Both the cells have been cycled from 0.2 C to 15 C rate (1 C = 250 mAh g-1) in the potential range of 2.0-4.8 V, and then recovered back to 0.2 C rate. As can be seen that the S-NCM electrode displays the higher discharge capacities at different rates than that of the H-NCM one, and the difference in the capacities between two electrodes increases quickly with increasing rate value. However, such an increase of the capacity difference decreases a little as the discharge rate increases from 10 to 15 C. The discharge capacities of the S-NCM electrode are 286.4, 233.8, 210.7, 170.1, 147.9, 118.3, and 46.1 mA h g-1 at 0.2, 0.5, 1.0, 2.0, 5.0, 10, and 15 C rate, respectively. However, the corresponding discharge capacities of the H-NCM electrode are only 274.2, 230.3, 168.9, 136.8, 108.7, 46.5, and 5.4 mA h g-1, respectively. The S-NCM electrode presents the superior rate capability than that of the H-NCM one, especially the high-rate capacities. The rate capability difference between the two electrodes should be related to the particle uniformity, specific surface area, and cation mixing in the Li-layers [16]. The S-NCM sample has the relatively more uniform particles, much larger specific surface area, and the weaker cation mixing than that of H-NCM. The much more uniform particles and the larger specific surface area can shorten the distances of lithium diffusion and then enhance the rate performance of the material. Moreover, the smaller degree of cation (Li+/Ni2+) disorder in the S-NCM electrode material indicates that the less nickel ions disperse in lithium-ion layer, which can promote the electrochemical reactivity and lead to the higher capacity and the better rate ability [36]. Compared to the previous reported Li-rich layered oxide Li1.2Mn0.54Ni0.13Co0.13O2 cathode materials, the capacity and the rate performance of the present studied S-NCM electrode are quite high as shown in Fig. 8.
Fig. 8. Electrochemical performance of S-NCM electrode compared to LMNCO samples [
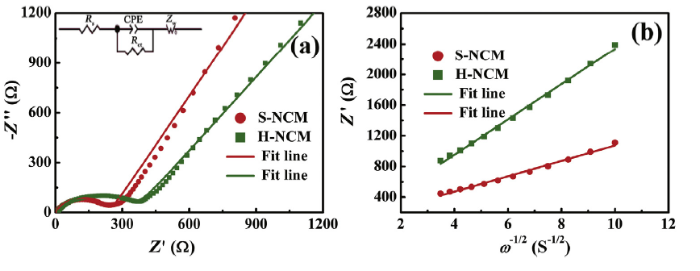
To get deep insight into the original difference of the electrochemical performance between the S-NCM and H-NCM electrodes, EIS measurement is applied to identify the charge transfer resistance and the evolution of electrode/electrolyte interface. All the EIS measurements are performed on the fresh electrodes without any electrochemical cycling testing and the EIS profiles are shown Fig. 9. From the figure, we can see that both the Nyquist plots consist of a semicircle at high frequencies and a straight line at low frequencies. The crossover point of semicircle and lateral axis represents the ohmic resistance (Rs). The high frequency semicircle is related to the charge transfer resistance (Rct) and the low frequency straight line is attributed to the Warburg diffusion of Li ions (Zw) in the material [36], [37], [38]. A possible equivalent circuit is presented in the inset of Fig. 9(a). To quantitatively describe the difference of the electrochemical parameters between two electrodes, we fit the EIS curves using Zsimpwin software and the obtained parameters Rs, Rct, and Zw are summarized in Table 2. As can be seen that the difference of Rs between the S-NCM and H-NCM electrodes is negligible. The S-NCM electrode has a much smaller Rct value of 243.3 Ω than that of the H-NCM one (345.8 Ω), suggesting that the Faraday charge-transfer kinetics on the electrode/electrolyte interface of the S-NCM electrode is much better than that of the H-NCM one.
Fig. 9. (a) Electrochemical impedance spectroscopy and (b) relationship between Z’ and ω-1/2 for S-NCM and H-NCM electrodes (Z’: real part of the impendence; Z’’ imaginary part of the impendence; CPE: double layer capacitance; Zw: Warburg impendence; ω: frequency).
Table 2 Electrochemical parameters obtained from RIS fitting (Cich/Cidch: initial charge/discharge capacities; Cirl: irreversible capacity loss; Qi: initial coulomb efficiency).
| Sample | Cich(mAh g-1) | Cidh(mAh g-1) | Cirl(mAh g-1) | Qi (%) | Rs(Ω) | Rct(Ω) | σ | DLi+(cm2 s-1) |
|---|---|---|---|---|---|---|---|---|
| H-NCM | 346 | 269.2 | 76.8 | 87.5 | 1.92 | 345.8 | 100.3 | 2.48 × 10⁻¹⁶ |
| S-NCM | 334 | 292.3 | 41.7 | 77.8 | 4.51 | 243.3 | 230.7 | 1.32 × 10⁻¹⁵ |
In general, Li+ migration in a material can be reflected by the lithium diffusion coefficient ($D_{Li^{+}}$), which can be calculated from the Warburg diffusion supported by the low-frequency region using the following equations:
$D_{Li^{+}}$=$\frac{R^{2}T^{2}}{2n^{4}F^{4}C^{2}σ^{2}A^{2}}$ (4)
Z'=Rs+Rct+σω-1/2 (5)
where R is the gas constant, T is the absolute temperature, n is the number of electrons per molecule during the charge/discharge process, C is the concentration of Li+ ions in a unit cell, A is the surface area of the electrode, F denotes the Faraday constant, Z′ is the real part of the impendence, σ is the Warburg factor, and ω is the frequency. Fig. 9(b) shows the plots of Z′ vs ω-1/2 and the obtained σ and DLi+ values are listed in Table 2. The Li ion diffusion coefficients for the S-NCM and H-NCM electrodes are 1.32 × 10⁻¹⁵ and 2.48 × 10⁻¹⁶ cm2 s-1, respectively. The S-NCM electrode has a much higher $D_{Li^{+}}$ value than that of H-NCM, confirming the much faster lithium ion diffusion in the S-NCM electrode.
In summary, the morphology and electrochemical properties of two Li-rich layered oxides Li1.2Mn0.54Ni0.13Co0.13O2 without any carbon modification synthesized by the solvothermal and hydrothermal methods have been studied comparatively. It is found that the solvent used in the synthetic process plays an important role on the microstructure, morphology and the formation of oxygen vacancies for the materials. Compared to the H-NCM sample, the S-NCM sample possesses the more homogenous microstructure, much lower cation mixing, and much more oxygen vacancies on the surface. The S-NCM samples also exhibit much higher initial discharge capacity, the better cycle ability, and the more excellent rate capability. At 0.2 C rate, the initial discharge capacity of the S-NCM electrodes is as high as 292.3 mA h g-1 and the capacity can maintain 235 mA h g-1 even after 150 cycles, showing a good retention performance of 80.4%. The electrodes also display a high rate capability of 118.3 mA h g-1 at the larger rate of 10 C. The excellent electrochemical performance of the S-NCM electrodes should attribute to the well-ordered structure, the much larger specific surface area and the much more oxygen vacancies located on the material surface. The current work can provide a facile and applicable way to obtain high performance Li-rich layered oxide cathode material for lithium-ion batteries.
This work is supported financially by the National Key Research and Development Program (No. 2017YFA0402800) and the National Natural Science Foundation of China (Nos. U1732160 and 11504380).
The authors have declared that no competing interests exist.

 WeChat
/
| 〈 |
|
〉 |