Search for articles:
Hongmei Zhang , Lixia Xi
Corresponding authors:
Received: 2018-08-21
Revised: 2018-10-31
Accepted: 2018-12-23
Online: 2019-06-20
Copyright: 2019 Editorial board of Journal of Materials Science & Technology Copyright reserved, Editorial board of Journal of Materials Science & Technology
More
Abstract
Electrochemical measurements on three planes of TiC/Inconel 718 composites fabricated by selective laser melting (SLM) were performed to study the corrosion property. The results showed that the YZ-plane with dense and fine columnar structures possessed high microhardness and superior corrosion resistance in 3.5 wt% NaCl solution. For the XZ-plane, a decreased anti-corrosion property was observed owing to its inhomogeneous microstructures. While the XY-plane with large irregular pores and clustered ring-like structures was more susceptible to corrosion compared with the other two planes. Comparative analysis suggested that the anisotropic corrosion behaviors were significantly dependent on the surface defects, microstructure characteristics and added reinforcements.
Keywords:
Selective laser melting (SLM), as an important emerging additive manufacturing technique, experienced rapid development in the past decades. In view of the layer-wise additive nature of this process, SLM enables fabricating three-dimensional components with complex geometries and preparing hard-to-machine metallic materials [1]. In comparison to traditional casting and forging techniques, SLM can reduce the operator error and provide greater production precision without time-consuming mold design. Besides, the metallurgical mechanism during rapidly melted and solidified powder of SLM brings about non-equilibrium phases with tailored microstructures and superior properties. All of these advantages make it attractive in aerospace, automotive, biomedical and other industries [2,3]. As previously reported in the literature, stainless steel [4], Al- [5], Ti- [6], and Ni-alloys [7] have been successfully prepared by SLM.
High performance Ni-based superalloys are in increasing demand for applications like aircraft turbines, jet engines, and reactor core in nuclear power plant [8]. Inconel 718 is one of the most commonly used Ni-based superalloys used up to a temperature of 650 °C, which is primarily strengthened by Ni3Nb and Ni3(Al, Ti) precipitates. Nevertheless, its wear and corrosion resistance still cannot satisfy high requirements of industrial production [9,10]. It has been recently reported that the mechanical properties of Ni-based superalloys can be improved by addition of reinforcing ceramic particles such as Al2O3, SiC, and TiC to form Nickel-based matrix composites (NMCs). Specifically, TiC has high hardness, good corrosion resistance, chemical stability and superior deformation resistance at high temperature. Besides, TiC ceramic particles possess high wettability with Ni liquid so that it is beneficial to incorporating TiC reinforcements into Inconel 718 [11,12]. On the other hand, it is cost-consuming to prepare NMCs by traditional techniques due to excessive tool wear and removal rate. Moreover, the traditional preparation techniques would produce large grains and solidification defects, which result in inhomogeneous surface quality and degrade of mechanical properties [13,14].
Several research groups have investigated NMCs prepared by SLM. Wang et al. [15] fabricated Inconel 718 incorporated with two levels of graphene nanoplatelets (GNPs) (0.25 and 1 wt%) by SLM process and found that the obtained composite possessed significantly enhanced tensile strength. Rong et al. [16] investigated the effects of gradient interface formed at different laser processing parameters on wear properties of SLM-processed WC/Inconel 718 composites. So far, the previous work mainly focused on the effects of laser processing parameters and additions on densification, microstructure evolution and mechanical properties of NMCs. The corrosion resistance is a crucial factor of NMCs when they are applied in marine environment and more corrosive chemical solutions. Dai et al. [17] ascribed the different corrosion property of Ti-6Al-4 V at different planes to the amount of α’ phase and β-Ti phase in microstructure. Chen et al. [18] found that an apparent distinction in corrosion resistance of Al-12Si at different planes was attributed to the different structures of Si shells. Due to the layer-wise and track-wise characteristics of SLM, it is reasonable to believe that the different planes of SLM-processed composites (e.g. parallel and perpendicular to building direction) exhibit various microstructures, which leads to variations in mechanical and corrosion properties correspondingly. Although the influence of microstructures on corrosion resistance has been investigated, limited attention to the role of defects and reinforcements has been paid. Considering the corrosion mechanism of defects and multiphase system, it is, therefore, essential to investigate the corrosion resistance of SLM processed Ni-based composites at different planes.
In this study, open circuit potential (OCP), potentiodynamic polarization and electrochemical impedance spectroscopy (EIS) measurements were performed on three planes (the vertical direction: YZ-, XZ-planes, the horizontal direction: XY-plane) in 3.5 wt% NaCl solution to study the anisotropic corrosion resistance of SLM-processed TiC/Inconel 718 composites. The corrosion mechanism of SLM-processed composites was studied to establish the relationship between dense surface, micro-morphologies, grain size and reinforcements. This work can provide better understanding of the corrosion anisotropy of SLM-processed Ni-based composites.
Gas atomized spherical Inconel 718 powder with a size of 10-50 μm and polygonal TiC powder with a size of about 50 nm were used in this study. The composite powders containing 20 wt% TiC and Inconel 718 were homogenously mixed by ball milling in Pulverisette 6 planetary mono-mill (Fritsch GmbH, Germany) for 4 h at a rotation speed of 200 rpm.
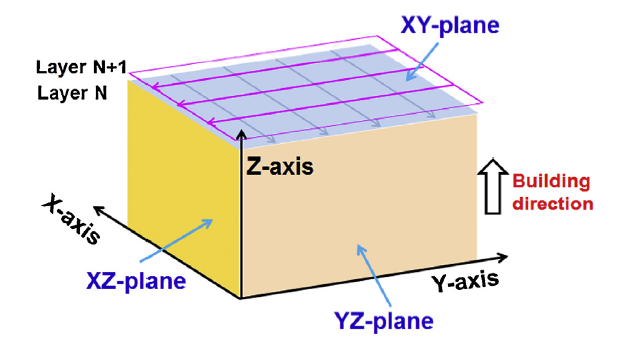
The TiC/Inconel 718 composites were fabricated with SLM process in a SLM-150 device, which contains an YLR-500 ytterbium fiber laser with a laser power of ~500 W and a spot size of 70 μm, an automatic powder spreading system, an inert argon gas protection system and a computer system for process control. The SLM-processed part was carried out by a laser power of 240 W, laser scan speed of 800 mm/s, layer thickness of 50 μm and hatching space of 50 μm. The layers were scanned by a bidirectional mode, which was alternated by 90° between each layer. Fig. 1 schematically presents the three-dimension diagram of SLM-processed sample and three planes (XY-, XZ- and YZ-planes) were used in this study. The chemical composition of 20 wt% TiC/Inconel 718 composite is listed in Table 1.
Fig. 1. Three-dimensional diagram of SLM-processed Ni-based composite sample and three different studied planes.
Table 1 The chemical compositions of 20 wt% TiC/Inconel 718 composites.
| Element | Fe | Cr | Nb | Mo | Ti | C | Al | O | Ni |
|---|---|---|---|---|---|---|---|---|---|
| wt.% | 17.44 | 19.32 | 5.12 | 3.99 | 2.99 | 3.66 | 0.67 | 0.63 | Balance |
Three planes of TiC/Inconel 718 composite and Inconel 718 were polished with SiC paper down to 3000 grit, cleaned with deionized water and ethanol via ultrasonication, and then dried in air. Electrochemical measurements were performed on an electrochemical workstation in 3.5 wt% NaCl aqueous solution with a three-electrode system at room temperature. A platinum foil as the counter electrode, a saturated calomel electrode (SCE) as the reference electrode, and the samples with an exposed area of 0.28 cm2 as the working electrode were used in the measurement. Before testing, open circuit potential (OCP) was measured and recorded from beginning of working electrode putting into the electrolyte. After reaching a stable OCP, the electrochemical impedance spectroscopy (EIS) was measured at the OCP potentiostatically running over the frequency range of 10-2 to105 Hz with amplitude of 10 mV. Finally, the potentiodynamic polarization curves were done at a scanning rate of 2 mV/s from -0.6 V to 0.6 V. For each test, three times were performed to ensure the reproducibility.
The immersion test was examined to investigate the stability of TiC/Inconel 718 composites. Firstly, the surface was polished, cleaned and dried as same as the electrochemical experiments. Then a testing plane was exposed in air while the other planes were sealed with epoxy resin. The processed sample was weighted in the beginning and then immersed in 3.5 wt% NaCl solution for 100 h. With an interval off 25 h, the sample was taken out, rinsed with distilled water, ultrasonically cleaned in ethanol and deionized water to remove corrosion products. Finally the sample was weighted for calculating the weight loss. After immersion for 100 h, the electrochemical experiment was conducted. The corrosion rate was determined by:
v=$\frac{K×W}{ A×T×D }$ (1)
where K is constant (8.76 × 10⁴), W is the weight loss of specimen after immersion tests, A is the exposed area of sample, T is the immersion time and D is the density in g/cm3.
The microstructures of TiC/Inconel 718 composites and Inconel 718 were characterized by optical microscopy (OM) and field emission scanning electron microscopy (FE-SEM, Hitachi, Japan) after the planes were etched in solution containing 10 ml HCl, 5 ml H2O2 and 5 ml distilled water for 3 s. The surface chemical composition of the tested plane was determined by X-ray photo electron spectroscopy (XPS) using a 250XI instrument. The microhardness distribution of three planes of composites was measured by using an HV-1000 Vickers digital microhardness tester (AMETEK, China), with a load of 200 g and a dwell time of 20 s.
Fig. 2 shows 3D optical microstructure of SLM-processed TiC/Inconel 718 composites taken from YZ-, XZ-, and XY-planes. The results exhibited that the YZ-plane was relatively dense without any apparent pores, and TiC particles were uniformly distributed in the matrix. As seen from the YZ-plane in Fig. 2(b), a good metallurgical bonding between neighboring tracks was achieved. The width of molten pool varied from 100 to 120 μm, suggesting that the applied energy density could produce a stable molten pool. It was observed that some small pores appeared at the boundary of XZ-plane (side view of Fig. 2(a)). These slight pores might be related to shrinkage and gas trapped within the molten pool during consolidation [19]. While a number of irregular and large pores were found on the XY-plane, demonstrating poor densification (top view of Fig. 2(a)). As proposed by Dai et al. [20], residual pores could be eliminated by thermal-capillary convection during re-melting process to increase the relative density. It has been mentioned that limited re-melting process occurred on the top surface, which finally increased the pores on the horizontal XY-plane.
Fig. 2. 3D optical metallographic images of (a) polished surface and (b) etched surface of SLM-processed composites at three different planes.
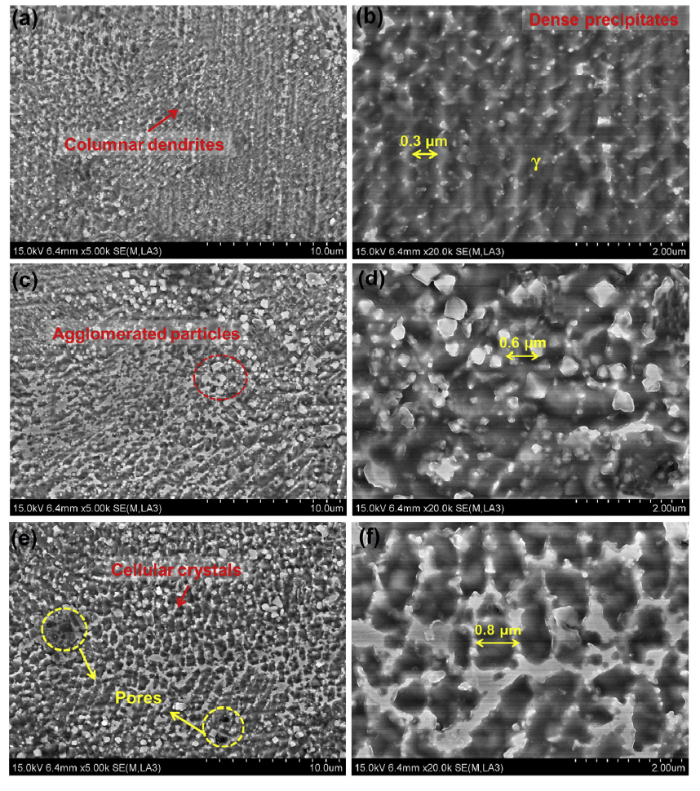
The microstructures of SLM-processed composites for three planes are shown in Fig. 3. Generally, distinct columnar dendrites parallel to the building direction were formed on the YZ-plane (Fig. 3(a)), which was determined by crystal preferred orientation and heat transfer direction along the Z-axis. The magnified image showed that the dendrite arm spacing (DAS) was finer (~0.3 μm) compared with traditional solidified microstructures owing to large temperature gradient and rapid solidification rate during SLM process. The γ matrix phase was located in dendritic trunks, while the TiC reinforcements were uniformly distributed at the grain boundaries (Fig. 3(b)). Fig. 3(c) and (d) shows insufficiently developed dendrites with an average coarsened DAS of ~0.6 μm, and TiC reinforcements illustrated obvious agglomeration on the XZ-plane. It was noticed that the difference in microstructure orientations of two vertical planes might be related to the different position and photographs taken from. Fig. 3(e) revealed that cellular structures with irregular pores appeared on the XY-plane. The average size of cellular crystals exhibited the mean diameter about 0.8 μm (Fig. 3(f)). The TiC reinforcements were clustered and developed into discontinuous ring-like structures with thickness about 0.4 μm. The discontinuous cellular zone resulted from the epitaxial columnar grains at the top edge of the molten pool. Those cell-wall structures might separate the continuity of reinforcements and matrix, which would degrade the mechanical and corrosion properties [21].
Fig. 3. SEM images showing microstructures of etched SLM-processed composites: (a, b) YZ-plane, (c, d) XZ-plane, (e, f) XY-plane.
According to the fast solidification theory, the microstructure is mainly dependent on the constitutional undercooling, which is related to the ratio of G/R, where G is the temperature gradient and R is the solidification rate [22]. The G/R can be expressed [23]:
where K is the thermal conductivity of the material, T is the liquids temperature of the alloy, T0 is the heated temperature of the substrate, Vs is the laser scanning speed, θ is the angle between Vs and R, η is the laser absorption coefficient, and P is the laser power. As to surfaces in vertical direction, the manufactured layer can be regarded as a heat source to decrease the G, which contributes to a lower G/R and resultant formation of columnar dendrites. In horizontal direction, the TiC particles were ejected and accumulated along the cell boundaries driven by the surface tension, which in turn increased the G/R and ultimately accelerated the formation of cellular structures. This explains the formation mechanism of different microstructures in vertical and horizontal directions.
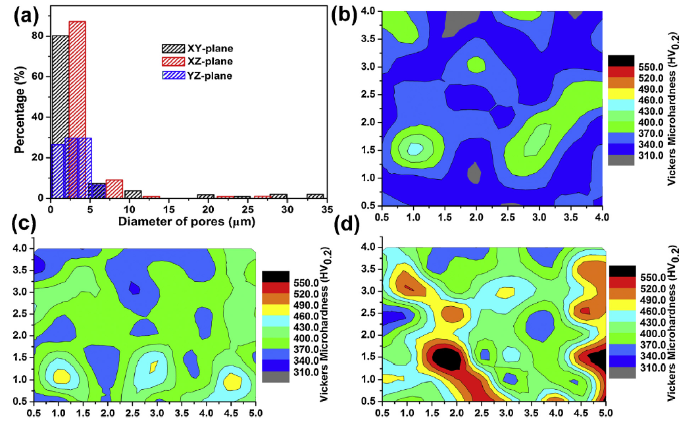
The diameter of pores and microhardness distribution of three planes are shown in Fig. 4. As well seen from Fig. 4(a), three planes exhibited micron sized pores. The XY-plane presented a higher distribution of large pores with maximum diameter of about 35 μm due to lack of remelting, thus exhibiting the average microhardness of ~339.69 HV0.2 (Fig. 4(b)). While an average pore diameter of ~3.5 μm and ~2 μm was obtained for the XZ- and YZ-planes, respectively. It is expected that the respective hardness was ~387.41 HV0.2 and ~435.66 HV0.2 for the XZ- and YZ-planes (Fig. 4(c) and (d)), much higher than that obtained from the XY-plane. The dramatically increased hardness of YZ-plane might be attributed to the decreased pores and the refined grains. As observed in Fig. 2, the YZ-plane possessed relatively dense surface that could stand large loads during hardness test. On the other hand, the grain refinement strengthening could also increase the hardness according to the Hall-Petch relationship.
Fig. 4. (a) Histogram plot displaying distribution of pore diameters on the three planes, Hardness profile on the three planes of SLM-processed composites: (b) XY-plane, (c) XZ-plane, (d) YZ-plane.
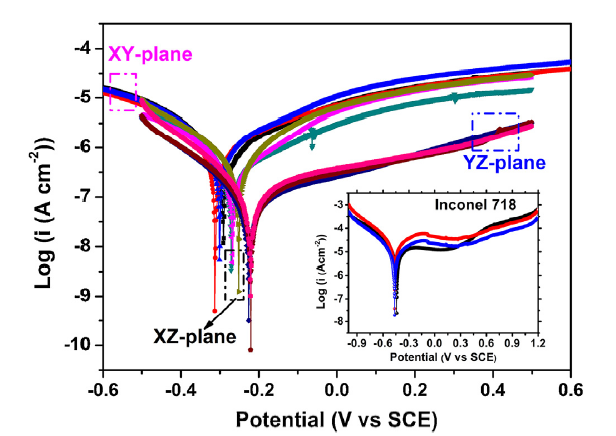
The potentiodynamic polarization curves measured on the three planes of SLM-processed TiC/Inconel 718 composites in 3.5 wt% NaCl solution are shown in Fig. 5. The corrosion parameters such as corrosion potential (Ecorr) and corrosion current density (Icorr) are given in Table 2. As seen in Fig. 5, there was no distinct difference in the curve shapes of three planes, while the value of Ecorr and Icorr showed a significant difference. It was observed that the Ecorr of YZ-plane shifted to a positive direction and corrosion current density decreased, reaching the maximum Ecorr of about -221 mV and minimum Icorr of about 4.03 × 10⁻⁷ A cm-2 and showing a superior corrosion resistance. The Ecorr of XZ-plane decreased to about -264 mV and Icorr increased to ~2.99 × 10⁻⁵ A cm-2, indicating a slightly higher corrosion rate than that of YZ-plane. The Ecorr of XY-plane was about -302 mV accompanied with the Icorr of ~3.37 × 10⁻⁵ A cm-2, decreasing by 20% compared with that of YZ-plane. Accordingly, there exists anisotropy of corrosion resistance on the vertical and horizontal planes of SLM-processed composites. While as seen the illustration of Fig. 5, the potentiodynamic polarization curves of SLM-processed Inconel 718 demonstrated a decreased Ecorr of about -441 mV and increased Icorr of ~1.27 × 10⁻⁵ Acm-2, decreasing about twice of TiC/Inconel 718 composites.
Fig. 5. Potentiodynamic polarization curves for the XY-, XZ- and YZ-planes of SLM-processed composites in 3.5 wt% NaCl solution. The inserted was potentiodynamic polarization curves of Inconel 718 alloy.
Table 2 Electrochemical parameters of the polarization curves for three planes of SLM-processed composites.
| SLM-ed Planes | Ecorr (mV vs SCE) | Icorr (A cm-2) |
|---|---|---|
| XY | -302 ± 15 | (3.37 ± 0.17)×10-5 |
| XZ | -264 ± 13 | (2.99 ± 0.15)×10-5 |
| YZ | -221 ± 10 | (4.03 ± 0.20)×10-7 |
Fig. 6 depicts typical EIS measurements in the form of Nyquist and Bode plots to investigate the surface condition in 3.5 wt% NaCl solution. The equivalent circuit used for fitting the EIS data is inserted in Fig. 6(a). The Nyquist plots for all three planes exhibited a single unfinished semicircle in the frequency ranging from 0.01 Hz to 10 KHz, characteristic for capacitive loops without Warburg impedance. It was noticed that the obtained semicircles comparatively differ in size of different planes. And the radius of the YZ-plane was greater than the other two planes. This suggested that the YZ-plane had a more resistive and larger polarization resistance capability, since a larger semicircle diameter contributed to better corrosion resistance [24]. Fig. 6(b) shows the Bode plots corresponding to the impedance spectrum in Fig. 6(a). It could be seen that there was no apparent difference among three planes, but the corresponding phase angle exhibited a gradual reduction in the order of YZ-, XZ-, and XY- planes. It is worth noting that the increase of the maximum phase and the broadening phase angle of YZ-plane suggested an improvement in anti-corrosion behavior. As the Bode plots show a plateau in a range of wide frequency, an equivalent circuit with two time constants was used. In this model, Rs and Rct represent the solution resistance and charge transfer resistance. Rf is the polarization resistance of the passive film, which is inversely proportional to the corrosion rate. The usage of CPE is attributed to a distribution of the relaxation time as a result of different degrees of inhomogeneous micro and macro scales. Therefore, CPE1 and CPE2 correspond to non-ideal capacitance of the passive film and double charge layer. The impedance CPE can be given [25]:
ZCPE=$\frac{1}{Y_{0}(jw)^{n}}$ (3)
where Y0 is the pseudo capacitance of the system (S sn cm-2), j is the imaginary number and j2 =-1, w is the angular frequency (w = 2πf) in rad s-1, f is the frequency, n is a factor accounting for the shift from ideal capacitive behavior owing to the surface roughness and heterogeneities. As referenced to [26], when n = 1, ZCPE=C (capacitance); n = 0.5, ZCPE=W (Warburg impedance); n = 0, ZCPE= R(resistance). That is, the behavior of the passive film can be recognized as an ideal capacitor when n is close to 1. Table 3 lists the fitted results of EIS measurement by Zsimpwin software to interpret the EIS data. The chi-square (χ2) that was used to evaluate the consistency of the fit was in the order of 10-3 in all case, suggesting a good fitting quality. As seen in Table 3, the Rs were very similar, while there were significant differences in Rf among three planes. The YZ-plane displayed the highest value of Rf (~16.2 kΩ cm2), XZ and XY-planes exhibited significantly lower value (Rf-XZ ≈ 3.4 kΩ cm2, Rf-XY ≈ 2.9 kΩ cm2). Moreover, the n1 of the YZ-plane increased, which was probably due to a more compact oxide film formed on the surface [27]. The fitted results has confirmed that a distinction in corrosion resistance between the vertical and horizontal directions of composites. Fig. 7 shows the corrosion performance of SLM-processed Inconel 718. Fig. 7(a) illustrated the significantly reduced semicircle diameter with the Rf about 1.2 kΩ cm2. After electrochemical test, large pores with diameter of 2-50 μm became ambiguous and the dendrite microstructure appeared to coincide with preferential corrosion on the polished surface (Fig. 7(c)), which suggested that the addition of TiC improved the corrosion resistance of Inconel 718.
Fig. 6. EIS measurements for the XY-, XZ- and YZ-planes of SLM-processed composites in 3.5 wt% NaCl solution: (a) Nyquist plots, (b) Bode plots. The inserted figure in (a) was an equivalent circuit.
Table 3 Equivalent circuit parameters for three planes of composites in 3.5 wt% NaCl solution.
| SLM-ed Planes | Rs (Ω cm2) | CPE1,Y0 (×10-5 S sn cm-2) | n1 | Rf (kΩ cm2) | CPE2,Y0 (×10-5 S sn cm-2) | n2 | Rct (kΩ cm2) | χ2 (×10-3) |
|---|---|---|---|---|---|---|---|---|
| XY | 7.88 ± 0.39 | 16.58 ± 0.82 | 0.67 ± 0.03 | 2.91 ± 0.15 | 10.80 ± 0.54 | 0.68 ± 0.03 | 39.68 ± 1.98 | 2.28 ± 0.11 |
| XZ | 7.51 ± 0.37 | 10.92 ± 0.55 | 0.73 ± 0.04 | 3.42 ± 0.17 | 18.80 ± 0.94 | 0.73 ± 0.02 | 96.23 ± 4.81 | 2.02 ± 0.10 |
| YZ | 7.43 ± 0.35 | 4.39 ± 0.22 | 0.75 ± 0.01 | 16.22 ± 0.81 | 4.43 ± 0.22 | 0.75 ± 0.04 | 169.60 ± 6.48 | 2.38 ± 0.12 |
Fig. 7. (a) Nyquist plots, (b) Bode plots of polished Inconel 718, (c, d) SEM images of surface morphology of Inconel 718 after electrochemical test in 3.5 wt% NaCl solution.
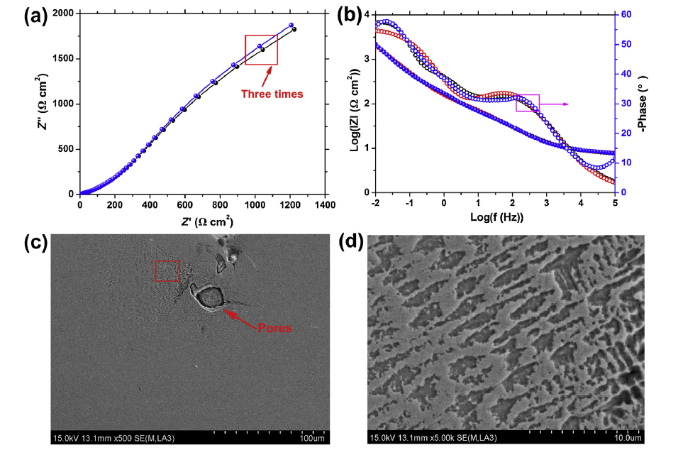
In order to investigate the long-term anti-corrosion of the YZ-plane, the corrosion rate, Tafel plots and EIS measurements were obtained after the plane immersed in 3.5 wt% NaCl solution for 100 h. As shown in Fig. 8(a), the corrosion rate decreased with the increase of immersion time and the corrosion rate went through two characteristic stages during 100 h exposure. In the first 70 h, the corrosion rate decreased sharply from 0.09 to 0.01 mg/(cm2 h) (specified as stage I, sharp-down stage). Afterwards, the corrosion rate reached a stable state in the rest of 30 h (specified as stage II, quasi-steady stage). Some small pores with diameter of 5 μm were observed on the surface of immersed sample, as illustrated in the inset of Fig. 8(a). It was obvious that after immersion for 100 h, the Ecorr presented negative movement from about -221 mV to -241 mV, while Icorr showed positive movement from 4.03 × 10⁻⁷ A cm-2 to 1.35 × 10⁻⁵ A cm-2, respectively (Fig. 8(b)). The semicircle diameters in Nyquist plot became smaller with the increased immersion time (Fig. 8(c)). This phenomenon suggested that the corrosive liquid had gradually infiltrated into the interior with increasing soaked time. Consequently, the Rf decreased to 422 Ω cm2. In the Bode plots, the log(|Z|0.01Hz) remained at ~2.6 Ω cm2 with a medium phase angles of ~36° (Fig. 8(d)). These obtained results clearly showed that the corrosion resistance of the YZ-plane decreased during the long-term immersion.
Fig. 8. (a) The corrosion rate of the YZ-plane immersed in 3.5 wt% NaCl solution, (b) Potentiodynamic curve, (c) Nyquist plot, (d) Bode plots after the YZ-plane immersed in 3.5 wt% NaCl solution for 100 h.
Fig. 9 shows the Cr 2p, Ni 2p3/2, Fe 2p3/2 and Mo 3d XPS spectra taken from the YZ-plane after electrochemical test. The XPS was separated into different oxidation states when background was removed according to Shirley. Detail of high resolution XPS spectra for Cr 2p orbit resolved into three main peaks was displayed in Fig. 9(a). The peak at 574.5 eV corresponded to the metal chromium. The peaks at 576.7 eV and 577.9 eV could be assigned to Cr2O3 and Cr(OH)3, respectively. Moreover, a Ni peak at 853.1 eV, a NiO peak at 854.7 eV, a Ni(OH)2 peak at 856.2 eV and a satellite peak at 861.8 eV could fit the nickel spectra well (Fig. 9(b)). The weak peaks at binding energies of 709.7 eV, 711.3 eV and 712.9 eV were FeO, Fe2O3 and FeOOH (Fig. 9(c)). When analyzing the XPS molybdenum region, the metallic molybdenum peak, MoO2 and MoO3 peaks were observed at 228.2 eV, 229.2 eV and 232.3 eV, respectively (Fig. 9(d)). The results showed that the main constituent of the passive film formed on the YZ-plane was Cr-oxide. Among them, Cr2O3 was the most stable compared with Cr(OH)3 and had properties between network forming (Cr-O-Cr) and modifying oxide. Although Fe and Mo took participate in the corrosion, the peak intensity of the Fe2O3 and FeO spectra were so weak that Fe-oxides could be neglected. The molybdenum did not significantly change the composition of the film. Mo-oxide created oxygen abundance in the inner of the passive layer facilitating the formation of stable Cr2O3 protective oxide [28]. Previous studies have also confirmed that for nickel-based alloys, Fe and Mo made no contribution to corrosion resistance, but Nb and Cr could improve mechanical properties and resistance to pitting and crevice corrosion, respectively [29]. The reactions of the process are described as follows [30]:
Fig. 9. Fitted XPS spectra of (a) Cr 2p, (b) Ni 2p3/2, (c) Fe 2p3/2 and (d) Mo 3d obtained for the YZ-plane after electrochemical tests.
Stage I: Preferential dissolution of Cr and release Cr3+ ions into solution. The anodic and cathodic reactions are shown in Eqs. (4) and (5), respectively.
Cr→Cr3++3e- (4)
O2+2H2O+4e-→4OH- (5)
Stage II: The Cr-enriched passive film (Cr-oxides) formed on the surface due to its high negative value of △G, and the final productions obtained as follows:
Cr3++3OH-→CrOH3 (6)
2Cr(OH3)→Cr2O3+3H2O (7)
Stage III: As the corrosion goes on, NaCl is decomposed into Na+ and aggressive Cl- ions released into the solution. The Cl- penetrates into the substrate and then the oxychlorination reaction takes place, which enhanced the destruction of the protective film and resulted in the formation of pitting:
Cr2O3+6Cl-+3H2O→2CrCl3+6OH- (8)
Therefore, the alloyed chromium plays a key role in the passivity of SLM-processed Ni-based composites.
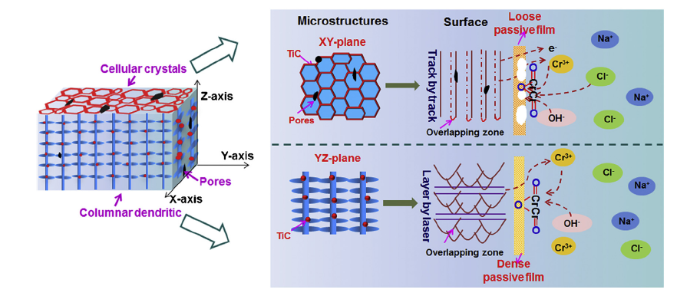
According to the electrochemical experiments, the corrosion resistance for three planes of TiC/Inconel 718 composites is ranked by the following order: YZ-plane > XZ-plane > XY-plane (Table 2). It is believed that the corrosion susceptibility of the sample is influenced by the densification, microstructures, composition of the passive films and reinforcements. A possible corrosion mechanism is proposed and schematically shown in Fig. 10. From the observation in Fig. 2, the YZ-plane showed a dense surface, while XY-plane had irregular large pores. As reported by Schaller et al. [31] pore features directly affected the passivity of the metals. Kong et al. [32] also confirmed that the pores in SLM 316 L were preferential sites for corrosion inducing in solutions with chloride, which brought about more corrosion attack. Therefore, the long and narrow pores on XY-plane would become corrosion sources, acting as occluded areas that deplete in oxygen and become acidified during the initial stage of corrosion. Those pores become more conductive for corrosion attack and demonstrate inferior corrosion resistance. In contrast, the small spherical pores on the YZ-plane lacked the crevices to drive the occluded cell corrosion and thus showed superior anti-corrosion property, as shown in Fig. 5. Tailoring processing parameters to reduce surface porosity is an effective strategy to decrease corrosion susceptibility.
Fig. 10. Schematic diagram of corrosion mechanism of SLM-processed TiC/Inconel 718 composites.
Microstructure formation is another factor accounting for the different corrosion behaviors. The surface energy can be regarded as the same for YZ- and XZ-planes, while the columnar dendrites and uniform distribution of secondary phase on YZ-plane decrease the diffusion coefficient of metal atoms. It is expected that the current density at the YZ-plane (4.03 × 10⁻⁷A cm-2) is less than that at the XZ-plane (2.99 × 10⁻⁵A cm-2). For the XY-plane, the precipitated carbides are prone to contact with Cr, thereby decreasing the Cr content and forming Cr-depleted areas at boundaries. Additional, the discontinuous interface between the matrix and the secondary phases produced micro-batteries, which acted as preferential initiation sites for the breakdown of the passive film [33]. Hence, such a microstructure of XY-plane naturally increases susceptibility to micro-galvanic corrosion. Also, grain size plays an important role in the corrosion resistance. The atoms along grain boundaries dissolved faster, while the polarization resistance was Rs-XY < Rs-XZ < Rs-YZ (Table 3). TiC particles were homogeneously distributed along the grain boundaries of YZ plane so that TiC could move to the defects, which reduced the segregation elements for intergranular corrosion. On the other hand, some elements are easy to promote the absorption of Cl- ions. The finer grains increase the diffusion rate of Cr to form the passive films. While for the NMCs, Cr may have a higher possibility to form a chemical bond with Cl- if the grain is large. Hence, the Cl- will occupy the position of O2- that does not locate in interstitial position of grain as the ions radium of Cl- (1.81 Å) is bigger than O2- (1.32 Å). The replacement of Cl-decreases the negative charge of original O2- position, which increases the amount of anion vacancies (V0). The increasing vacancies made the passive film change from p-type to n-type semiconductor. The n-type semiconductor has large amount of oxygen vacancies, which can assist Cl- in oxide film and ultimately increase the corrosion rate [34]. Therefore, it can be concluded that smaller grain size promotes uniform element distribution and decreases the absorption of Cl- on the surface, which is beneficial to the formation of passive film and ultimately enhances the corrosion resistance.
In addition, it is worth noting that the reinforcements have an effect on the corrosion resistance of TiC/Inconel 718 composites. The micro-batteries were formed on the electrode surface between γ and TiC, and accelerated the dissolution of γ during corrosion process. As seen in Fig. 2, TiC particles were uniformly distributed on the YZ plane, and thus a stable Cr2O3 oxide passivation film would be formed at the matrix to prohibit the corrosion process. For XY-plane, TiC particles agglomerated into clusters with some irregular pores, which led to formation of unstable and thicker oxide film, accelerating the corrosion process [35]. Moreover, Ti and Nb had strong affinity with C to form TiC and NbC, which decreased the amount of carbon and thus avoided the Cr-lean regions in the matrix. Meanwhile, TiC reinforcements controlled the occurrence of cracks and other defects, which increased the densification of samples and enhanced performance. Therefore, the corrosion resistance of TiC/Inconel 718 composites was improved compared with the unreinforced Inconel 718.
Corrosion behaviors were performed on three planes (YZ-, XZ- and XY-planes) of SLM-processed TiC/Inconel 718 composites. The main conclusions can be drawn as follows:
(1) The microstructures of SLM-processed TiC/Inconel 718 composites were different in vertical and horizontal directions, significantly depending on the temperature gradient (G). In vertical direction, the dense YZ-plane was characteristic of fine columnar dendrite with TiC particles homogeneously dispersed at the grain boundaries. While the XZ-plane exhibited insufficiently developed dendrites and agglomeration of TiC reinforcements. In the horizontal direction of XY-plane, high G during SLM resulted in discontinuous coarsened cellular structures with irregular large pores, leading to discontinuity of the matrix.
(2) For the electrochemical measurements, the YZ-plane showed higher corrosion potential (Ecorr ≈ -221 mV), lower corrosion current density (Icorr ≈ 4.03 × 10⁻⁷ A cm-2) and higher polarization resistance (16.2 × 10³ Ω cm2) with respect to the other two planes. After immersing in 3.5 wt% NaCl solution for 100 h, a passive film of Cr-oxide was formed on the YZ-Plane. The XZ-plane had a moderate corrosion rate ascribed to a higher diffusion coefficient of metal atoms. A poor corrosion resistance of the XY-plane (Ecorr ≈ -302 mV, Icorr ≈ 3.37 × 10⁻⁵ A cm-2) was due to large pores and inhomogeneous microstructures. Consequently, there existed electrochemical anisotropy of the cuboid TiC/Inconel 718 composites fabricated by SLM.
(3) The Inconel 718 without reinforcements showed large pores with maximum diameter of ~50 μm, and exhibited poor corrosion resistance (Ecorr ≈ -441 mV, Icorr ≈ 1.27 × 10⁻⁵ A cm-2) compared with TiC/Inconel 718 composites. The improved anti-corrosion performance of SLM-processed composites was attributed to the surface densification, microstructures, reinforcements and decreased Cr-lean regions in the matrix.
This work was financially supported by the National Natural Science Foundation of China (Nos. 51735005 and 51575267) and the National Key Research and Development Program “Additive Manufacturing and Laser Manufacturing” (No. 2016YFB1100101).
The authors have declared that no competing interests exist.

 WeChat
/
| 〈 |
|
〉 |


