Search for articles:
Linggen Kong , Inna Karatchevtseva, Hanliang Zhu, Meng Jun Qin, Zaynab Aly
Corresponding authors:
Received: 2018-10-29
Revised: 2018-12-7
Accepted: 2019-01-26
Online: 2019-09-20
Copyright: 2019 Editorial board of Journal of Materials Science & Technology Copyright reserved, Editorial board of Journal of Materials Science & Technology
More
Abstract
Oxide powders of Zr1-xTixO2 (x = 0-1) solid solutions with micron-sized particles were synthesized via a solution combustion method. The synthesis process and Zr/Ti molar ratio were optimized to produce powders with the tetragonal crystal structure. X-ray diffraction, Raman spectroscopy and transmission electron spectroscopy results confirm that a full crystallization microstructure with the single tetragonal phase is obtained after calcination at 600 °C while maintaining the crystallite size <30 nm. Zr/Ti oxide mixtures with Zr ≥ 67 mol% exhibit a tetragonal crystal structure and the embedding Ti in ZrO2 improves the structure stability. The nitrogen sorption results indicate that the powders possess mesoporous morphology with medium specific surface areas ($\widetilde{1}$0-50 m2/g). Chemical stability tests show that these powders are relatively stable with negligible removal of titanium and zirconium after elution by 0.5 mol/L HCl. Density functional theory was used to calculate the most stable structure with low energy for the selected composition.
Keywords:
Zirconium dioxide (ZrO2) is an important ceramic material due to its superior properties including high chemical stability, melting point, hardness and toughness, etc [[1], [2], [3], [4], [5]]. ZrO2 exhibits three crystallographic phases with increasing temperature at normal atmospheric pressure: the monoclinic (m-) (P21/c), from room temperature to 1175 °C; the tetragonal (t-) (P42/nmc), from 1175 to 2370 °C; and the cubic (c-) (Fm$\bar{3}$m), from 2370 to 2750 °C (melting point) [3,5]. In general the t- and c-ZrO2 are preferred over m-ZrO2, and therefore, a stabilization of the t- or c-ZrO2 at room temperature is a challenging issue. Doping cations such as rare earth elements can partially or fully stabilize t- or c-ZrO2, while another way is to limit the crystallite below a certain size. The occurrence of the metastable t-ZrO2 is due to the so-called “critical crystallite size” thus low surface free energy of the particles. When the crystallite size is between 10 and 50 nm, the tetragonal zirconia may be stable at room temperature without dopants and does not lead to the monoclinic phase [5]. Titanium dioxide (TiO2) is another important ceramic oxide because of its promising electrochemical properties, high chemical stability and non-toxic, among others [[6], [7], [8]]. The most often studied crystal structures include tetragonal anatase (I41/amd) and tetragonal rutile (P42/mnm).
Titanium zirconate solid solution (Zr0.5Ti0.5O2) has attracted significant attention in recent years because it exhibits high surface area, better thermal stability, profound surface acidity properties and strong mechanical strength, in regard to its end member ceramics, ZrO2 and TiO2. The Zr0.5Ti0.5O2 composites have been used as catalysts and catalyst supports. It has been confirmed that one component dispersed in mixed metal oxides produces superior catalysts to the single metal oxide for some reactions [[9], [10], [11]].
The traditional method to prepare Zr0.5Ti0.5O2 is via solid-state reaction between the TiO2 and ZrO2 powders at high temperatures (>1350 °C) [12], combining with high-energy ball milling [13]. In order to improve the homogeneity of the product and avoid consuming excess energy, several wet-chemistry routes have been investigated at the ultimate mixing of the reactant precursors at the molecular level. In addition, soft chemical routes normally lead to lower calcination temperature which is essential for a specific structural phase. ZrO2 (including low Ti-doped ZrO2) possesses tetragonal structure at low calcination temperature whereas high temperature treatment leads to the formation of the monoclinic phase, which will be discussed in the present work.
Within all wet-chemistry methods for the preparation of titanium zirconates, the sol-gel processing [[14], [15], [16], [17], [18], [19], [20], [21], [22], [23], [24], [25], [26]] is commonly pursued using conventional transition metal alkoxides. Other wet-chemistry methods include the hydro/solvo-thermal synthesis [[27], [28], [29], [30]], coprecipitation [[31], [32], [33], [34]], combustion [35], emulsion polymerization method [36] and electrospin-thermal process [37]. There are many publications for small doping between Zr and Ti, which are not the focus of this study.
A suitable fuel employed in a soft chemisty route is not only functionlized as a linking/affiliation agent for metal cations, but also normally leads to the formation of ‘soft’ agglomerates for the product. In addition, the oxygen partial pressure is roughly same within the product due to the presence of the geometric pores of the porous powder, thus forming the same type of crystals for the solid state phase. For synthesizing zirconia nanoparticles, many organic fuels have been used including sucrose [38], agarose [39], glucose and fructose [40], glycine [41], cellulose [42], oleic acid and carbon nano-powder [43].
In this study, titania, zirconia, and titanium zirconates (Zr1-xTixO2, x = 0-1) were prepared by a solution combustion method employing glucose as a reaction fuel. The aim of this study is to develop a simple method to fabricate the Zr1-xTixO2 (x = 0-1) solid solutions with the tetragonal crystal structure. The particle size of the product is in the micron range, which is suitable for column packing for potential solid-liquid adsorption application. In addition, it is required that the particles possess reasonable high specific surface area and high chemical stability. The experimental techniques are coupled with advanced theoretical calculations using density functional theory (DFT) for crystal structure analyses. The computational results allow an accurate description of the geometrical and electronic properties of the investigated materials.
Tyzor® LA, titanium(IV) bis(ammonium lactato)dihydroxide solution (50 wt% in water), D-(+)-glucose (99.5+%), and Ultra-pure HCl were purchased from Sigma-Aldrich. Zirconium(IV) nitrate pentahydrate [Zr(NO3)45H2O] (98+%) was purchased from Fluka. The Zr and Ti contents in the raw materials were quantitatively determined by gravimetric analyses. All chemicals were used as received. Milli-Q grade water was used in all the experimental procedures.
For zirconia synthesis, 100 mmol zirconium(IV) nitrate pentahydrate and 50 mmol D-(+)-glucose were dissolved in 200 mL water to produce clear solution upon stirring. The mixture was dried overnight in an oven at 80 °C, and then calcined for 4 h at selected temperatures with increments of 1 °C/min. For titania synthesis, 100 mmol Tyzor® LA and 50 mmol D-(+)-glucose were used. For producing the mixture of the Zr and Ti products, the zirconium(IV) nitrate pentahydrate and Tyzor® LA were used as starting materials, and the procedure was the same as that of the zirconia synthesis. Samples with the composition formulation including Zr0.83Ti0.17O2, Zr0.75Ti0.25O2, Zr0.67Ti0.33O2, Zr0.5Ti0.5O2, and Zr0.25Ti0.75O2 were synthesized.
XRD patterns were collected to investigate the crystal structure using a PANalytical X’Pert Pro diffractometer (Almelo, the Netherlands) using Cu Kα radiation (λ = 1.54187 Å) at 45 kV and 40 mA. The data were recorded over an angular range of 10-80° (2θ) with a step size of 0.03° and an acquisition time of 2 s per step. The average crystallite size (L) was estimated from the line broadening of the most intense XRD peak (101) using the Scherrer formula.
Raman spectra were used to investigate the structural evolution of the calcined materials using a Renishaw inVia Raman spectrometer equipped with the Argon ion laser (532 nm) and a Peltier cooled CCD detector (Renishaw plc, Old Town, Gloucestershire, UK). Stokes shifted Raman spectra were collected in the static mode in the range of 200-800 cm-1 with a spectral resolution of 1.7 cm-1 for the 1800 l/mm grating. On average 20 spectra were collected for each sample. The spot size was approximately 1.5 μm for 50x magnification.
TEM, selected area electron diffraction (SAED) pattern and high resolution transmission electron microscope (HRTEM) analyses were performed to obtain more detailed information about the crystal structure of the powder particles. Energy dispersive X-ray spectroscopy (EDS) was used to determine the chemical composition of the sample. Samples for TEM analyses were prepared by suspending powder in ethanol followed by depositing onto carbon coated 200-mesh copper grids. TEM, SAED, HRTEM and EDS examinations were carried out using a JEM 2200FS (JEOL Ltd., Akishima, Tokyo, Japan) TEM device operating at 200 kV.
Scanning electron microscopy (SEM) was used to monitor the particle morphology and the microstructure of the powders. The calcined powder samples were examined by a Zeiss Ultra SEM (Carl Zeiss NTS GmbH, Oberkochen, Germany) operating at 15 kV and equipped with an Oxford Instruments X-Max 80 mm2 SDD X-ray microanalysis system. Samples were coated with carbon (∼5 nm) prior to the examination.
Surface area, pore volume and pore size were measured using a nitrogen sorption analysis at 77 K on an Autosorb IQ volumetric adsorption analyzer (Quantachorme Instruments, Boynton Beach, Florida, USA). Samples were outgassed overnight at 150 °C to remove CO2 and water. The specific surface area, pore volume and pore size of powders were estimated using the DFT model in the nitrogen sorption analysis program.
The contents of carbon, nitrogen and hydrogen in the triplicate samples were determined by a Carlo Erba 1106 automatic micro-analyzer (Milan, Italy).
Chemical stability tests for TiO2, ZrO2 and Zr0.75Ti0.25O2 were conducted by packing the accurately weighed ceramic powders (∼1.0 g) in mini plastic columns and eluting them with 0.5 mol/L ultra-pure hydrochloric acid using a multi-channel peristaltic pump set at 1.00 mL/min, in steps of 100 mL eluant volumes, to a maximum of 1000 mL. The resultant eluants were analyzed using inductively coupled plasma mass spectrometer (ICP-MS, Varian) for leached elements of interest. The mass of each metal element lost during the elution can be calculated by the concentration determined by ICP-MS and the volume of the eluant.
The first-principle investigation of titanium zirconate solid solution (representing the experimental Zr0.75Ti0.25O2 sample) was carried out with the CASTEP [44] package, which is a plane-wave pseudopotential total energy calculation code based on density functional theory (DFT). For all calculations, the plane-wave energy cut-off of 380 eV was used, and the Brillouin zone integration was done over a 2 × 2 × 1 k-point Monkhorst-Pack mesh [45]. Ultra-soft pseudopotential formation was used to represent interactions between electrons and ion cores. The electronic exchange-correlation energy was treated according to the generalized gradient approximation (GGA-PBE) [46]. The Broyden-Fletcher-Goldfarb-Shanno (BFGS) minimization scheme [47] was used in the full geometry optimization with the tolerances: difference in total energy within 5 × 10⁻⁶ eV atom-1, maximum force within 0.01 eV Å-1, maximum ionic displacement within 5 × 10⁻⁴ Å and maximum stress within 0.02 GPa.
The calculations of the titanium zirconate structures were performed on a 48-atom supercell, corresponding to a 2 × 2 × 2 unit cell of tetragonal ZrO2 structure with 4 Zr atoms randomly replaced by Ti atoms (representing the experimental Zr0.75Ti0.25O2 sample). All the crystal structures were fully optimized (both cell parameters and internal coordinates) without symmetry operators to allow a complete structure relaxation.
Fig. 1 shows the XRD patterns of the powder samples calcined for 4 h at 600 °C. For ZrO2, the pure tetragonal phase is produced (Fig. 1(a)) with XRD reflections at (101), (002), (110), (102), (112), (200), (103), (211), (202), (220) in the range of 25-80° (2θ). With increasing Ti content in the Ti-Zr solid solutions from 17 (Fig. 1(b)) to 25 (Fig. 1(c)), 33 mol% (Fig. 1(d)), all the samples possessing a full crystallization of the tetragonal structure indicate that the tetragonal structure is robust enough to be able to accommodate TiO2 up to 33 mol%. The absence of the anatase TiO2 peak (2θ = 25.3°) in these powders leads us to exclude the presence of segregated TiO2 microcrystals, and hence to conclude that the preparation method leads to the formation of solid solutions with titanium ions diluted in ZrO2 matrices when Ti is ≤33 mol%. However, when the Ti content increases to 50 (Fig. 1(e)) or 75 mol% (Fig. 1(f)), the crystal structure seems distorted with much less peak intensity, and hence most of the sample is amorphous. The titania powder calcined at 600 °C leads to the formation of the pure anatase phase with XRD reflections of (101), (103), (004), (112), (200), (105), (211), (204), (116), (220), (215) (301) clearly evident in the XRD spectrum (Fig. 1(g)).
Fig. 1. XRD patterns of (a) ZrO2, (b) Zr0.83Ti0.17O2, (c) Zr0.75Ti0.25O2, (d) Zr0.67Ti0.33O2, (e) Zr0.5Ti0.5O2, (f) Zr0.25Ti0.75O2, (g) TiO2 powders calcined for 4 h at 600 °C.
When the calcination temperature increases to 700 °C, the major crystal phase is tetragonal, but the monoclinic phase appears for the pure zirconia powder (Fig. 2(a)). In contrast, the crystal structure is hardly changed for samples Zr0.83Ti0.17O2, Zr0.75Ti0.25O2, and Zr0.67Ti0.33O2 (Fig. 2(b-d)), remaining as the pure tetragonal phase. For the Zr0.5Ti0.5O2 and Zr0.25Ti0.75O2 samples, a poorly crystallized phase is observed (Fig. 2(e and f)) with all major diffraction peaks indexed to an orthorhombic structure [32], as well as small amounts of impurities. The increase of Ti in the titanium zirconates (≥50 mol%) results in an incomplete crystallization with very weak XRD peak intensities, and the broad peak shape reveals that the size of the crystals are very small. A small amount of rutile structured titania emerges when pure TiO2 is calcined at 700 °C (Fig. 2(g)). As a result, the optimal processing condition for producing the pure tetragonal ZrO2 and the anatase TiO2 phases is 600 °C for 4 h.
Fig. 2. XRD patterns of (a) ZrO2, (b) Zr0.83Ti0.17O2, (c) Zr0.75Ti0.25O2, (d) Zr0.67Ti0.33O2, (e) Zr0.5Ti0.5O2, (f) Zr0.25Ti0.75O2, (g) TiO2 powders calcined for 4 h at 700 °C. R and M refer to rutile and monoclinic phase, respectively.
Calcination at 800 °C leads to more monoclinic phase mixed with the tetragonal zirconia (Fig. 3(a)). Interestingly, the tetragonal structure is remained for the samples of Zr0.83Ti0.17O2, Zr0.75Ti0.25O2, and Zr0.67Ti0.33O2 (Fig. 3(b-d)), calcined at 800 °C. The absence of the monoclinic phase at 700-800 °C in these samples suggests that the presence of Ti in the ZrO2 matrices impedes the phase transformation from tetragonal to monoclinic at elevated temperatures, in other words, improves the stability of the tetragonal phase. The tetragonal zirconia is a metastable phase and thermodynamically unstable at room temperature [5]. During the synthesis process at elevated temperatures for pure ZrO2, the phase transformation from the tetragonal structure to monoclinic one occurs. The formation of monoclinic precipitates depends on the driving force and the duration of the phase transformation. With increasing calcination temperature, both the driving force and the duration of the transformation increase, resulting in increased monoclinic phases as shown in Fig. 1, Fig. 2, Fig. 3 for ZrO2. However, when ZrO2 is synthesized in the presence of TiO2 at high temperatures, according to the phase diagram of ZrO2-TiO2 systems [48], the replacement of Zr ions by Ti ions in the tetragonal structure suppresses the formation of the monoclinic phase of ZrO2. Hence, the embedding Ti in ZrO2 impedes the formation of the monoclinic phase and improves the stability of the tetragonal structure due to the free-energy change of the entire system. In addition, the heat treatment of the Zr0.5Ti0.5O2 and Zr0.25Ti0.75O2 samples at 800 °C (Fig. 3(e and f)) produces mainly the orthorhombic structure [32] with some impurities. More rutile is formed at 800 °C for the TiO2 sample (Fig. 3(g)).
Fig. 3. XRD patterns of (a) ZrO2, (b) Zr0.83Ti0.17O2, (c) Zr0.75Ti0.25O2, (d) Zr0.67Ti0.33O2, (e) Zr0.5Ti0.5O2, (f) Zr0.25Ti0.75O2, (g) TiO2 powders calcined for 4 h at 800 °C. R and M refer to rutile and monoclinic phase, respectively.
Gionco et al. [16] have prepared ZrO2-TiO2 mixed oxides doped 0.1-15 mol% TiO2 and calcined at 1000 °C and have found that the materials with low Ti loading (0.1%-1 mol%) are basically constituted by the monoclinic phase of ZrO2 while the tetragonal phase becomes prevalent at 15 mol% of TiO2 molar fraction. Manríquez et al. [24] have prepared TiO2-ZrO2 samples with compositions (0, 10, 50, 90 and 100 wt% TiO2) by sol-gel processing. During calcination at 600 °C, the TiO2-ZrO2 50-50 wt% sample forms the Zr0.5Ti0.5O2 mixed oxide, although this material remains partly amorphous. The samples with higher (90 wt%) or lower (10 wt%) TiO2 forms solid solutions with respectively anatase or tetragonal structure. It has been reported [24] that zirconium incorporation into the TiO2 lattice leads to the expansion of the unit cell parameters, and it stabilizes the anatase phase, hindering its transformation into rutile. Similarly, dissolving titanium atoms into the ZrO2 structure delays the transformation from the tetragonal to the monoclinic polymorph.
In order to produce a full crystallization microstructure for the titanium zirconate solid solution, the Ti content must be reduced to ≤33 mol%. Thus Zr0.75Ti0.25O2 is selected in the following study. The crystallite size calculated from (101) peak is 25.3 nm, 23.1 nm and 25.1 nm for ZrO2, Zr0.75Ti0.25O2, and TiO2, respectively. At temperatures ≥700 °C, the formation of monoclinic and rutile structures occurs. In addition, a higher calcination temperature usually results in the reduction of the specific surface area of the powders (to be discussed in later section). As a result, the calcination process of 600 °C for 4 h is selected for producing ceramic powders possessing a single tetragonal phase and reasonably higher surface area.
The lattice parameters for the synthesized ZrO2, TiO2 and the titanium zirconate crystals are shown in Table 1. The synthesized Zr0.25Ti0.75O2 and Zr0.5Ti0.5O2 samples are close to amorphous and hence have no lattice parameters. All the lattice parameters for ZrO2 and TiO2 are in good consistence with those from references, while no reference data have been found for the solid solutions. Moreover, the lattice parameters for the synthesized titanium zirconate crystals are very close to those for tetragonal ZrO2. The same crystal structure type with close lattice parameters between the synthesized crystals and tetragonal ZrO2 also confirm the solid solution of the titanium ions in the ZrO2 matrices in the synthesized samples. However, this results in a slightly shorter a-axis and a slightly longer c-axis in the synthesized crystals than in the pure tetragonal ZrO2. This is attributed to the smaller radius of the Ti4+ cation than the Zr4+ cation. The ion radius for Zr4+ and Ti4+ with the coordination number of 8 in the tetragonal structure [5] are 0.84 Å and 0.74 Å, respectively [52]. With increasing the Ti content in the solid solutions, some Zr ions are replaced by smaller Ti ions, resulting in a change in the distance of some atom planes. For example, the d-spacing of (110) and (211) planes can be estimated from Fig. 1 as 2.522 Å and 1.532 Å for Zr0.83Ti0.17O2, and 2.527 Å and 1.529 Å for Zr0.75Ti0.25O2. Hence, the d-spacing of the (110) plane increases whereas that of the (211) plane decreases when more Zr ions are replaced by Ti ions. These changes result in a decrease in the length of the a-axis whereas an increase in the length of the c-axis. The a-axis of the anatase TiO2 is the longest among all the crystals investigated in the present study (Table 1). The replacement of Zr ions by smaller Ti ions also leads to a decrease in the cell volumes of the crystals (V = a2·c) from 66.8235 Å3 for ZrO2 to 66.3813 Å3 for Zr0.83Ti0.17O2, 66.1981 Å3 for Zr0.75Ti0.25O2, and 65.4042 Å3 for Zr0.67Ti0.33O2.
Table 1 Lattice parameters (Å) of tetragonal materials calcined at 600 °C for 4 h.
| Materials | Experiment data | Reference data [5,49,50,51] | ||
|---|---|---|---|---|
| a | c | a | c | |
| ZrO2 | 3.599 | 5.159 | 3.610 | 5.168 |
| Zr0.83Ti0.17O2 | 3.576 | 5.191 | ||
| Zr0.75Ti0.25O2 | 3.569 | 5.197 | ||
| Zr0.67Ti0.33O2 | 3.537 | 5.228 | ||
| TiO2 | 3.787 | 9.547 | 3.785 | 9.514 |
Raman spectroscopy is employed to further investigate the samples as it is often more sensitive to short-range order atomic arrangement (metal-oxygen vibrational modes) than XRD in determining the phase composition of metal oxides. Fig. 4 displays the Raman spectra of all powders calcined for 4 h at 600 °C. In the pure zirconia sample (Fig. 4(a)) several Raman bands are clearly identified, including 146, 272, 316, 461, 645 and 604 cm-1 as a shoulder peak. Raman spectroscopic studies of zirconia are well documented and these peaks are assigned to Raman active modes (A1g + 2B1g + 3Eg) of tetragonal ZrO2 belonging to space group D4h (P42/nmc) with two molecules per unit cell [53]. Current literature provide mixed identification of Raman modes due to the formation of a pure tetragonal phase t-ZrO2 [[54], [55], [56], [57]]. In the present work, Raman mode identification is accepted from the Raman scattering study of a polarized light from single crystals of a pure t-ZrO2 [58] and the vibrational property study of tetragonal zirconia using a density functional theory [59]. Both studies argue that the A1g mode in the spectrum of t-ZrO2 must be unequivocally associated with the band observed near 270 cm-1 in the Raman scattering. Thus we have assigned the 272 cm-1 band to the A1g mode, which is due mainly to the Zr—O stretching vibration. The Zr—O stretching vibrations also give rise to a peak at 645 cm-1 (Eg mode) and a shoulder around 604 cm-1 (B1g mode). The Eg mode at 146 cm-1 is due to O—Zr—O and Zr—O—Zr bending vibrations. Raman peaks at 461 cm-1 (Eg mode) and 316 cm-1 (B1g mode) have been assigned in the literature to a combination of bending and stretching vibration. Most importantly a very weak and broad peak centered around 190 cm-1 is detected and most likely due to a monoclinic ZrO2 phase. Careful re-examination of the XRD pattern (Fig. 1(a)) confirms the presence of a tiny peak at 24.4°, which is the reflection of (110) plane of the monoclinic zirconia. This finding is not surprising since Raman spectroscopy has greater sensitivity over XRD for the oxygen environment even though the amount of this phase is tiny [60,61].
Fig. 4. Raman spectra of (a) ZrO2, (b) Zr0.83Ti0.17O2, (c) Zr0.75Ti0.25O2, (d) Zr0.67Ti0.33O2, (e) Zr0.5Ti0.5O2, (f) Zr0.25Ti0.75O2, (g) TiO2 powders calcined for 4 h at 600 °C.
Raman spectrum of TiO2 calcined for 4 h at 600 °C is shown in Fig. 4(g) and exhibits the characteristics of the anatase TiO2 (space group I41/amd) phase, which has six Raman active vibrations: A1g + 2B1g + 3Eg [23,61,62]. Three Eg modes are found at 144, 195 and 640 cm-1. One B1g mode is located at 397 cm-1 and a combination of A1g + B1g modes is at 517 cm-1.
Fig. 4(b-f) shows Raman spectra of all the solid solution samples. In accordance with the XRD data, Raman spectra of the samples of Zr0.83Ti0.17O2, Zr0.75Ti0.25O2, and Zr0.67Ti0.33O2 show patterns similar to that of pure ZrO2. With increase of TiO2 in the samples Raman bands in the region 500-200 cm-1 become broader suggesting a tetrahedral distortion. Further increase in TiO2 in the samples of Zr0.5Ti0.5O2 and Zr0.25Ti0.75O2 results in Raman spectra closely resemble that of anatase TiO2. It is interestingly to note that the XRD result (Fig. 1(f)) indicates that the sample of Zr0.25Ti0.75O2 with the lowest content of ZrO2 is amorphous while the Raman data show incorporation of 25 mol% of zirconium does not significantly modify the Raman spectrum with the respect to TiO2. This discrepancy regarding the phase structure between XRD and Raman spectroscopy is at least partly originated by the difference in the sensitivity of these techniques [24]. The Eg mode (144 cm-1 peak) of TiO2 shifts to high wavenumber (blue shift) with increasing Zr dopant suggests the energy gain of scattered photons from the materials, thus the shorter bond length.
Our results are in contrary to those reported by Lejon et al. [63], who have analyzed the small Zr-doped (≤15 mol%) anatase TiO2 by Raman and XRD, and have found that the Zr-doped samples exhibit retarded grain growth and delayed anatase-to-rutile phase transition by up to 200 K compared to the pure anatase TiO2. XRD shows that Zr doping leads to a unit cell expansion of the anatase structure. In addition, they have observed that the Eg mode (144 cm-1 peak) shifts to lower wavenumber with increasing Zr doping up to 15 mol% after calcination at 600 °C. For small Ti doping up to 15 mol% in ZrO2 [22], the solid solutions have interesting optical properties as the typical band gap transition of ZrO2 undergoes a red shift proportional to the Ti loading, however, there is no obvious Raman shift observed.
Zr—O stretching vibrations (272 cm-1 and 645 cm-1 peaks) are found to shift to high wavenumber (high frequency and shorter wavelength, e.g. blue shift) with increasing Ti content (Fig. 4(a-d)). This is attributed to the decrease of ionic radius when Zr ions are replaced by Ti ions. The replacement of the Zr cation by a smaller Ti cation results in a movement of oxygen atoms closer to the metal cation, and a decrease in the length of the Me-O bond along the ab plane (Table 1). This decrease of the Me-O bond length leads to higher bond stretching frequency (i.e. bond stretching force constant), which is a general view of the Badger’s rule [64].
TEM analyses are conducted to gain some deeper insight into the extent of the grain size and more detailed information about the structure of the powder particles. Fig. 5 shows the TEM images, HRTEM images and SAED ring patterns for the samples of zirconia, Zr0.75Ti0.25O2, and titania. The TEM images exhibit agglomerates of nanoparticles with zirconia showing the strongest interconnection between primary particles and titania displaying the least aggregation. TEM‒EDS point composition analyses have been conducted on the Zr0.75Ti0.25O2 sample and the results show that the composition is very close to the designed stoichiometric value (≤0.26%) and low figure of the standard error of mean (≤0.18 mol%, number of spots = 18) suggests that the sample is highly homogeneous for metal ion distribution.
Fig. 5. TEM images (a, d, g), HRTEM images (b, e, h), and SAED ring patterns (c, f, i) for samples ZrO2 (a, b, c), Zr0.75Ti0.25O2 (d, e, f), TiO2 (g, h, i) calcined for 4 h at 600 °C.
The HRTEM images clearly show a full crystallization microstructure and crystallite grains with the diameter of approximately 5-20 nm for all the samples. These results are close to the crystallite size of about 25 nm calculated from the XRD peaks for the three samples. The grain size less than 30 nm indicates that the tetragonal structured metal oxides are stable at room temperature without any dopants [42,65]. Moreover, the HRTEM micrographs clearly show the lattice structures of the three materials. The d-spacings of different lattice planes can be calculated on the basis of the HRTEM structures. The SAED ring patterns show the diffraction spots of multi-grains of the tetragonal crystalline ceramics. The SAED rings of the (101) plane for the three materials exhibit the strongest intensities, which are consistent with the XRD spectra as shown in Fig. 1(a) and (c). The ZrO2 and Zr0.75Ti0.25O2 samples exhibit similar SAED ring patterns. In addition, extra diffraction spots are found near the main SAED rings in the samples of ZrO2 (top right) and Zr0.75Ti0.25O2 (middle right), indicating a small amount of the impurity phase.
The d-spacings of the (101) lattice plane are obtained via direct measurements on the SAED ring data. The measurements on the SAED rings match very well with the results from XRD and references for the three samples. In addition, the d(101)-spacing of Zr0.75Ti0.25O2, 0.293 nm, is very close to that of tetragonal zirconia ZrO2, 0.295 nm, but much smaller than that of tetragonal anatase titania TiO2, 0.352 nm. Hence, the TEM analyses indicate that the crystal structure of Zr0.75Ti0.25O2 is close to that of the tetragonal zirconia, confirming that the preparation method leads to the formation of solid solutions with titanium ions diluted in the ZrO2 matrices for the Zr0.75Ti0.25O2 sample.
Furthermore, in the HRTEM image of Zr0.75Ti0.25O2, a grain is found to exhibit a different lattice structure with others. One d-spacing for this grain is measured to be 0.288 nm, which is close to the d-spacing of (111) plane of monoclinic ZrO2, 0.284 nm (JCPDS card no.37-1484). Hence, this grain is the impurity monoclinic ZrO2. In SAED rings of Zr0.75Ti0.25O2, the d-spacing for the extra spots is 0.364 nm, matching the d-spacing, 0.370 nm, of (110) plane for the monoclinic phase. The TEM image and SAED patterns show the characteristics of very small areas of the TEM specimen whereas XRD results reflect those of the bulk sample. Hence, the fact that the monoclinic phase is observed at the isolated spot of a crystal grain in the SAED pattern and HRTEM image, but not in the XRD curve (Fig. 1(c)) confirms that the monoclinic phase is a tiny fraction of the Zr0.75Ti0.25O2 sample. As a result, both techniques should be utilized to better understand the overall structure and microstructure of the materials.
Nitrogen sorption analysis is employed to calculate specific surface area, pore volume and pore diameter of the samples heat treated at 600 °C. All three isotherms (Fig. 6) are more closely related to Type IV using the IUPAC classification scheme [66]. The characteristic feature of the Type IV isotherm is its hysteresis loop, which is associated with capillary condensation taking place in mesopores. The ZrO2 and Zr0.75Ti0.25O2 samples (Fig. 6(a, b)) give rise predominantly to type H2 hysteresis loop, which often associate with the materials where the distribution of pore size and shape is not well defined. It is noteworthy that these isotherms do not exhibit a limiting adsorption at high P/P0, which is typical for type H3 hysteresis and is observed with non-rigid aggregates with slit-shaped pores. The TiO2 sample indicates (Fig. 6(c)) type H4 loop that also often associates with narrow slit pores.
Fig. 6. Nitrogen sorption isotherms of powders calcined for 4 h at 600 °C: (a) ZrO2, (b) Zr0.75Ti0.25O2, (c) TiO2.
Nitrogen sorption data are summarized in Table 2. The zirconia powder possesses the highest specific surface area at $\widetilde{5}$0 m2/g in comparison with $\widetilde{1}$0 m2/g for the TiO2 powder calcined at 600 °C. When $\widetilde{1}$7 mol% ZrO2 is replaced by TiO2 (sample Zr0.83Ti0.17O2), the surface area is decreased to $\widetilde{3}$5 cm2/g under the same synthetic conditions. With further increasing the Ti component from 25 mol% (sample Zr0.75Ti0.25O2) to $\widetilde{3}$3 mol% (sample Zr0.67Ti0.33O2), the specific surface area is only reduced slightly to about 34 cm2/g. However, if the same amount of Zr and Ti is present in the composition (sample Zr0.5Ti0.5O2), the specific surface area decreases significantly to $\widetilde{1}$1 cm2/g, which is close to that of pure titania ($\widetilde{1}$0 cm2/g). It is not surprising that increasing the calcination temperature leads to a decrease of the specific surface area. To take the Zr0.83Ti0.17O2 sample as an example, the specific surface area is 35, 18 and 3.7 cm2/g at the calcination temperatures of 600, 700 and 800 °C, respectively. All the samples exhibit the same trend.
Table 2 N2 sorption data of powders calcined for 4 h.
| Materials | Calcination (oC) | Surface area (m2/g) | Pore volume (cm3/g) | Pore size (nm) |
|---|---|---|---|---|
| ZrO2 | 600 | 49.6 | 0.032 | 3.2 |
| 800 | 11.2 | 0.041 | 14 | |
| Zr0.83Ti0.17O2 | 600 | 34.8 | 0.039 | 4.9 |
| 700 | 18.4 | 0.035 | 7.6 | |
| 800 | 3.71 | 0.024 | 21 | |
| Zr0.75Ti0.25O2 | 600 | 34.4 | 0.035 | 4.8 |
| 800 | 2.01 | 0.015 | 29 | |
| Zr0.67Ti0.33O2 | 600 | 34.0 | 0.038 | 4.9 |
| 700 | 12.9 | 0.032 | 9.1 | |
| 800 | 2.81 | 0.021 | 29 | |
| Zr0.5Ti0.5O2 | 600 | 11.3 | 0.022 | 6.1 |
| TiO2 | 600 | 9.85 | 0.021 | 8.7 |
It is generally observed that with increasing calcination temperature, the pore size is increased. This is because higher heat treatment temperature leads to the collapse of the existing porous structure and subsequently re-establishment of a new structure with bigger crystal grains, and hence larger pores between them. As a result, the morphology shifts from micropores (∼4 nm) to mesopores (∼tens nm). In the data treatment of the nitrogen sorption analysis, some huge pores are treated as cavities by the program, which are not contributed to the porosity accumulation. As a result, the volume of the pores is generally decreased at elevated temperatures for the zirconia and titania solid solutions (Table 2). However, ZrO2 possesses smallest pore size (3.2 nm) at 600 °C and the crystal grains are highly agglomerated (Fig. 5(a)). At 800 °C, the pores are still much smaller than those in most samples, and all pores are taken into account during nitrogen sorption analysis. As a result, the pore volume is slightly increased with temperature as shown in Table 2.
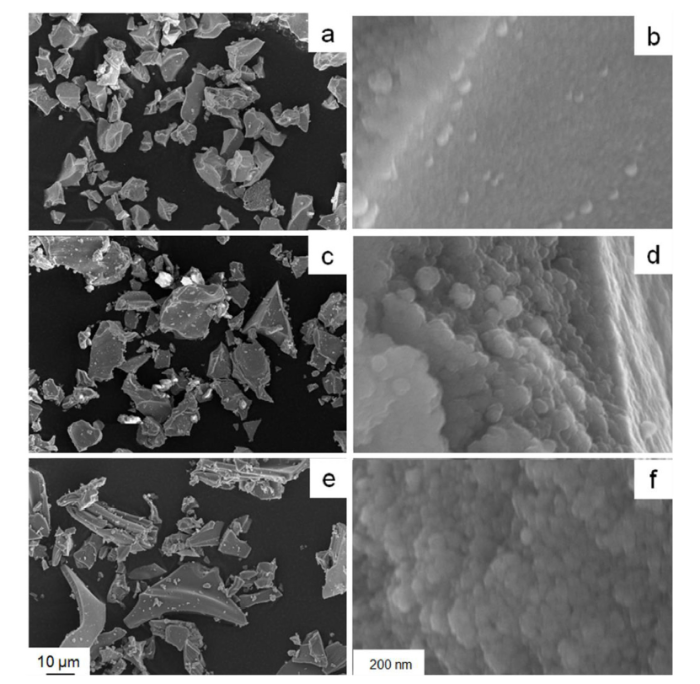
Fig. 7 shows the backscattered SEM images of the powders (ZrO2, Zr0.75Ti0.25O2 and TiO2) calcined for 4 h at 600 °C. Following the calcination, the particle size of the powders is in the range of 1-50 μm for all the samples (Fig. 7(a, c, e)) and mostly in the range of 10-30 μm, which is suitable for a column packing. The SEM images with a high magnification (Fig. 7(b, d, f)) show the ‘building blocks’ of the samples. The ‘building blocks’ are spherical particles with the size range of approximately 5-50 nm. The crystallite size ($\widetilde{2}$5 nm) calculated from XRD (101) peak falls in this range. The specific surface area determined by nitrogen sorption analysis is the surface area of these tiny particles as well as the interstitial voids between the spheres. It is quite challenging to produce ceramic particles not only in the micron size range (say >10 μm) for easy packing in a column, but also possessing a high specific area that smaller particles usually have. In addition, a specific crystalline phase is required for resisting radiation damage. As a result, a compromise is needed when the three factors are considered simultaneously.
Fig. 7. Backscattered SEM images of powders calcined for 4 h at 600 °C: (a, b) ZrO2, (c, d) Zr0.75Ti0.25O2, (e, f) TiO2.
The conventional sol-gel processing [[14], [15], [16], [17], [18], [19], [20], [21], [22], [23], [24], [25], [26]], in which Zr/Ti alkoxides are normally used but extremely sensitive to moisture, requires employing either a large amount of organic solvents or a stabilizer to ensure the reaction rate in a controllable manner. Hydro/solvo-thermal synthesis [[27], [28], [29], [30]] needs high pressure vessels, and hence the temperature and product mass are restricted. The coprecipitation method [[31], [32], [33], [34]] introduces extra procedure steps including titration, separation via centrifugation, filtration or decantation, which make the sample preparation complicated and costly. Contrary to above mentioned production methods, our chemical synthesis route using a selected fuel is quite simple and effective.
When zirconium(IV) nitrate is dissolved in water, it hydrolyzes to positively charged cation and nitrate anions; and the pH of the aqueous phase is approximately 2. At pH < 2.5, the prevailing species in aqueous solution is Zr4+. At pH 5.5-7, a triply positively charged hydrolysis product is formed mainly dimeric species, Zr2(OH)53+ or trimeric species, Zr3(OH)93+ [67]. When glucose is added into this aqueous solution, the HO— groups on the glucose affiliate with the positively charges cations forming complex-building-species. On the other hand, the nonpolar organic part is facing the peripheral of the complex-building-species, which will yield steric repulsions inhibiting the agglomeration (fusion) and aggregation (necking) of the particles during the process. As a result, the mechanism of the nanoparticle generation is termed as inorganic-organic layered particle model [38,40,42].
During the synthesis process of titania nanoparticles, besides the inorganic-organic layered particle model, there exists the poly-condensation reaction of the titanium precursor. With the evaporation of water, the pH of the solution increases from initial pH $\widetilde{7}$.5, producing a strong catalyst (OH-) for the condensation of Tyzor LA by cross linking. As a result, linear (1D: -[-O-Ti-O-]-n) and/or planar (2D), even 3D net-work can be formed. This may be one of the reasons that the specific surface area of the titania powder is smaller due to bigger building blocks while the pore size is larger because of the net-work formation, compared with zirconia power.
The results of the microelement analyses reveal that no hydrogen or nitrogen element is detected after calcination at 600 °C, suggesting that all organic species are decomposed. A trace amount of carbon is determined to be less than 0.5 wt%, due to probably the formation of a carbon char deposit after burning the organics. ZrO2 has more carbon residue ($\widetilde{0}$.43 wt%) in comparison with Zr0.75Ti0.25O2 ($\widetilde{0}$.14 wt%) and TiO2 ($\widetilde{0}$.03 wt%). This could be due to ZrO2 possessing the highest specific surface area and the smallest pore size, thus associating more organic species on the particle surface, which are more difficult to be removed.
The results about the chemical stability analyses eluting with 0.5 mol/L HCl for titania, zirconia and titania zirconia mixture (Zr0.75Ti0.25O2) are presented in Table 3. All the three sorbent materials are stable under a fairly robust elution regime, and the elution of titania and zirconia are negligible totaling to 0.039% Ti for TiO2 sorbent, 0.022% Zr for ZrO2 sorbent and 0.5% Ti, 0.031% Zr for Zr0.75Ti0.25O2. There is no change in the XRD patterns after the elution of these sorbents (data not shown), suggesting that the elution by acid would not have an effect on the crystal structure. In addition, the particle morphologies are hardly changed after the elution by acid, which are confirmed by nitrogen sorption results shown in Table 4.
Table 3 Chemical stability of ceramic powders eluted by 0.5 mol/L HCl (element concentration in each 100 mL eluant).
| Eluant volume (mL) | TiO2 (1 g) | ZrO2 (1 g) | Zr0.75Ti0.25O2 (1 g) | |
|---|---|---|---|---|
| Ti (mg/L) | Zr (mg/L) | Ti (mg/L) | Zr (mg/L) | |
| 100 | 0.15 | 0.09 | 2.14 | 0.07 |
| 200 | 0.08 | 0.02 | 0.72 | 0.04 |
| 300 | 0.05 | 0.03 | 0.38 | 0.03 |
| 400 | 0.02 | 0.01 | 0.53 | 0.03 |
| 500 | 0.01 | 0.01 | 0.26 | 0.03 |
| 600 | 0.03 | 0.02 | 0.23 | 0.02 |
| 700 | <0.01 | 0.01 | 0.27 | 0.03 |
| 800 | <0.01 | 0.01 | 0.20 | 0.02 |
| 900 | 0.02 | 0.01 | 0.42 | 0.02 |
| 1000 | <0.01 | 0.01 | 0.24 | 0.02 |
Table 4 N2 sorption data of powders calcined for 4 h at 600 °C.
| Materials | Eluted | Surface area (m2/g) | Pore volume (cm3/g) | Pore size (nm) |
|---|---|---|---|---|
| ZrO2 | Before | 49.6 | 0.032 | 3.2 |
| By 0.1 M HCl | 45.7 | 0.034 | 4.1 | |
| By 0.5 M HCl | 43.7 | 0.033 | 4.1 | |
| Zr0.75Ti0.25O2 | Before | 34.4 | 0.035 | 4.8 |
| By 0.1 M HCl | 32.7 | 0.034 | 4.8 | |
| By 0.5 M HCl | 31.0 | 0.038 | 4.8 | |
| TiO2 | Before | 9.85 | 0.021 | 8.7 |
| By 0.1 M HCl | 9.88 | 0.021 | 8.7 | |
| By 0.5 M HCl | 9.90 | 0.021 | 9.0 |
Zirconia, titania and their mixtures/solid solutions consist of discrete metal oxide clusters covered by hydroxyl groups on the surface. The interaction of nanocrystalline metal oxide particles with aqueous solutions results in the hydroxylation of the surface sites and this imparts a pH-dependent surface charge, which is primarily responsible for the uptake of metal ions [68,69]. Hence, when inorganic ceramics are used as adsorbent materials, not only the specific surface area of the powders should be considered for maximizing higher adsorbing capacity, but also the amount of functional hydroxyl groups on particle surfaces should be considered. An elevated calcination temperature normally leads to the densification (reducing the specific surface area) and also the dehydroxylation (reducing the amount of -OH functional groups on particle surfaces), which have a detrimental effect for inorganic adsorbents.
The variation of the Ti component in the titanium zirconate matrix as adsorbents with TiO2 ≤33 mol%, while the crystal structure is kept constant, facilitating adsorption of different types of metal ions via isomorphrism-based adsorption mechanism [70]. The tetragonal crystal phase is ideally required when these inorganic ceramic nanomaterials are used as adsorbents for radioisotope generators and separation applications due to its radiation damage resistant property [[68], [69], [70], [71]]. A recent work shows that the tetragonal phase without the stabilizer of the mesoporous nanocrystalline zirconia is extremely stable being able to tolerate a dose of around 82 dpa without becoming amorphous [72].
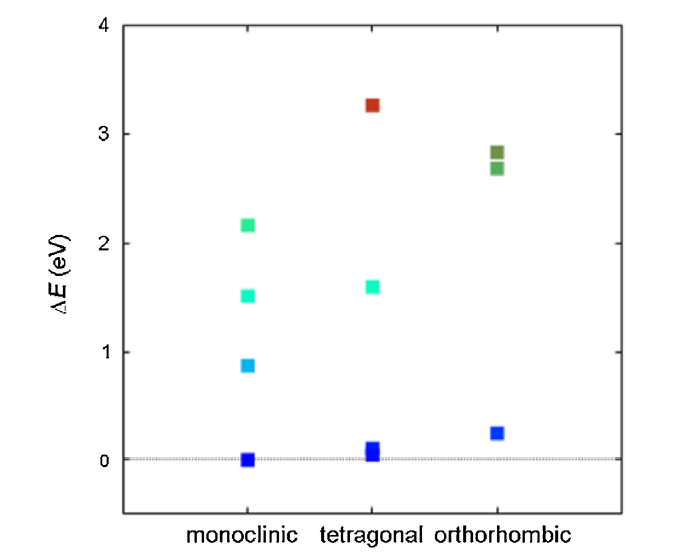
In the case of the Zr0.75Ti0.25O2 sample, Ti and Zr atoms can occupy randomly the cation positions, and this is modeled with a 48-atom supercell (Zr12Ti4O32). Different configurations of the replacement have been taken into account. Fig. 8 shows the energy differences between different replacement configurations, more than 3.26 eV per supercell (0.4 eV per unit cell) has been observed between the highest and the lowest energy configurations. Due to the symmetry of the replacement, the configurations simulated represent many possible symmetrical replacement configurations.
Fig. 8. Energy differences between different replacement configurations for Zr0.75Ti0.25O2.
Monoclinic, tetragonal and orthorhombic Zr12Ti4O32 structures have been observed, depending on where Zr atoms are replaced by Ti atoms. The most stable (lowest energy) optimized monoclinic, tetragonal, and orthorhombic structures are shown in Fig. 9(a-c), respectively, together with a high-energy monoclinic structure shown in Fig. 9(d). It can be seen from Fig. 9 that there are four cation layers along the c-axis (cations with same c-coordination).
Fig. 9. DFT optimized the most stable (low-energy) Zr0.75Ti0.25O2 (Zr12Ti4O32): (a) monoclinic, (b) tetragonal, (c) orthorhombic, and (d) high-energy monoclinic structures. Red, green and blue spheres refer to oxygen, zirconium and titanium atoms, respectively.
The most stable monoclinic structure is observed to have three Ti atoms in one layer and another Ti atom in the cation layer next to the first one (Fig. 9(a)). It exhibits relatively large expansion of the unit cell (a = 3.634 Å, b = 3.648 Å and c = 5.365 Å) compared to the experimental lattice parameters (a = b = 3.569 Å and c = 5.197 Å) (Table 1). The most stable orthorhombic structure is observed to have two Ti atoms in one layer and another two Ti atoms in the layer next to the first layer (Fig. 9(c)). It exhibits significant expansion of the unit cell in the y-axis (a = 3.495 Å, b = 3.680 Å and c = 5.249 Å) compared to the experimental lattice parameters. The most stable tetragonal structure also shows two Ti atoms on two cation layers but with an all-Zr-atom layer in between (Fig. 9(b)). The lattice parameters (3.584 Å and 5.289 Å) are very close to those of the experimental values (Table 1).
Compared with the ZrO2 structure simulated by DFT (a = b = 3.619 Å and 5.293 Å), the most stable tetragonal structure exhibits contraction of the unit cell in three axes (Δa = Δb = -0.035 Å, and Δc = -0.004 Å). The most stable monoclinic structure shows expansion in three axes, especially in the c-axis (Δa = 0.015 Å, Δb = 0.029 Å, and Δc = 0.072 Å). While the most stable orthorhombic structure shows significant contraction in the a- and c-axis, and expansion in the b-axis (Δa = -0.124 Å, Δb = 0.061 Å, and Δc = -0.044 Å).
In order to check the number of k-points on the accuracy of the calculation results, simulations with a 4 × 4 × 2 k-point have been performed on the monoclinic, tetragonal and orthorhombic structures with the lowest energy (Fig. 9(a-c)). The simulation results show that the energy differences (per super-cell) are very small, for the monoclinic structure: E(4 × 4 × 2) - E(2 × 2 × 1) = -0.0557 eV; for the tetragonal structure: E(4 × 4 × 2) - E(2 × 2 × 1) = -0.1137 eV; and for the orthorhombic structure: E(4 × 4 × 2) - E(2 × 2 × 1) = -0.0812 eV. It can be seen from Fig. 8 that the energy differences between structures with higher and the lowest energy are 1 eV and above, and hence the 2 × 2 × 1 k-point mesh is sufficient for the accuracy of the simulation in the present study.
After the optimization, a strong local structural rearrangement is observed. For the monoclinic structure, both Ti and Zr atoms are observed to have seven oxygen coordination number with senen different bond lengths. For the orthorhombic structure, both Ti and Zr atoms are eight oxygen coordinated with four different bond lengths (two same bond lengths each). While for the tetragonal structure, both Ti and Zr atoms are eight oxygen coordinated with two different bond lengths (four same bond lengths each).
The relative stability of the three structures is very small with the monoclinic structure being slightly more stable than the tetragonal structure and the orthorhombic structure. The energies of the tetragonal structure (Fig. 9(b)) and the orthorhombic structure (Fig. 9(c)) are 0.1065 eV per supercell (0.013 eV per unit formula) and 0.2463 eV per supercell (0.0303 eV per unit formula) higher than that of the most stable monoclinic structure (Fig. 9(a)), respectively. However, we should emphasize that the DFT calculation is pursued regardless of the temperatures.
We have designed a new synthesis method and optimized the processing conditions to prepare tetragonal ZrO2, TiO2 and titanium zirconate solid solutions, via a direct solution combustion method using glucose as an organic fuel. The chemical reaction takes place at the molecular level, which ensures the homogeneity of the synthesized powder. A full crystallization of the primarily single phase with the tetragonal structure is produced after calcination for 4 h at 600 °C for ZrO2, TiO2 and titanium zirconate solid solutions with TiO2 ≤ 33 mol%, and the crystalline size is less than 30 nm. The tetragonal Zr0.83Ti0.17O2, Zr0.75Ti0.25O2, and Zr0.67Ti0.33O2 have a similar crystal structure as the tetragonal zirconia, confirming that the preparation method leads to the formation of the solid solutions of the titanium ions in the ZrO2 matrices. The presence of Ti in ZrO2 impedes the phase transformation from tetragonal to monoclinic. The resulting metal oxides possess reasonable specific surface areas with mesopores. The chemical stability tests indicate that these materials are relatively stable with negligible removal of titanium and zirconium even after 1 L of elution (0.5 mol/L HCl). Hence such materials can be considered as candidates for adsorbents in most radioactive isotope generators. The most stable (low-energy) Zr0.75Ti0.5O2 with a monoclinic, tetragonal, or orthorhombic structure is calculated by DFT modelling. This aqueous synthetic method provides a simple pathway for the preparation of homogeneous ceramic powders with the tetragonal crystal structure of the titanium zirconate solid solutions. Future work may include the pH profiles of various radionuclide cations, adsorption capacity at optimized pH, and radiation damage analyses, as well as further increase of the specific surface area of the powder samples.
We thank the Nuclear Materials Development and Characterization Platform at ANSTO for providing facility access to carry out the material synthesis and characterization.
The authors have declared that no competing interests exist.

 WeChat
/
| 〈 |
|
〉 |


