


Plastic Flow of a Cu50Zr45Ti5 Bulk Metallic Glass Composite
[Wang G.1, *  , Pauly S.
2 , Gorantla S.2 , Mattern N.2 , Eckert J.2, 3 ]
, Pauly S.|
|


By modifying the cooling rate, a Cu50Zr45Ti5 alloy with various structures was developed. A fully glassy rod and specimens with different sizes and volume fractions of nanocrystals were produced. The relationship between the structure and mechanical properties of the Cu50Zr45Ti5 alloy was investigated. The different structures result in a transition of the deformation mechanism from being dominated by shear banding to being governed by dislocation action accompanied by shear band formation. These different plastic deformation mechanisms were discussed in the framework of self-organized critical behavior.
Plastic flow of bulk metallic glasses (BMGs) during quasi-static loading at room temperature is characterized by repeating cycles of a sudden stress drops followed by reloading elastically [1], [2], [3] and [4]. In analogy to that smooth macroscopic-scale crystalline plasticity arises from the spatio-temporal averages of disruptive earthquake-like events at the nanometer scale [5], [6], [7] and [8], the serrations in BMGs have been pointed out to show either a self-organized critical (SOC) behavior or a chaotic behavior, depending on their plastic deformability [2], [9] and [10]. These serration events are associated with shear banding behavior [11], [12] and [13]. Actually, avalanches of shear bands in BMGs are a fatal defect usually resulting in catastrophic fracture and marginal plastic strain (<2%) [14]. Therefore, prohibiting shear avalanches can possibly enhance the toughness of BMGs and thus can promote their plasticity.
The strength of the glassy phase is significantly higher than that of crystalline phase due to the absence of crystalline defects [15]. Considering this, one can assume that once the external stress is sufficient to initiate the operation of defects in crystals embedded in a glassy matrix, these crystals act as the soft medium to dissipate the deformation energy and thus retard the shear banding avalanches. Recent research works have found that nanocrystals embedded in CuZr-based glass could indeed improve the plasticity of BMGs [16] and [17]. This crystalline defect operation provides an effective measure to dissipate the deformation energy.
In this paper, based on the binary Cu–Zr alloy system, we chose a Cu50Zr45Ti5 BMG as a model material to investigate the influence of structure on the plastic deformation. The Cu50Zr45Ti5 BMG exhibits significant compressive plastic strain, which provides a sufficient number of serrations, required for a sound statistical analysis. Furthermore, the Cu50Zr45Ti5 BMG exhibits a relative low glass-forming ability when being compared to some Zr-based BMGs, such as Be-containing BMGs [15], indicating that the structure of the glassy phase is sensitive to the cooling rate. Through carefully controlling the cooling rate, nanocrystals with different sizes and volume fractions precipitated in the glassy matrix. These samples were then systematically analyzed with respect to the dynamics of their serrated flow behavior.
Alloy ingots were prepared by arc-melting a mixture of pure elements (with the purity higher than 99.99%) in a titanium-gettered argon atmosphere, followed by suction-casting into copper molds to form rod-like samples with a size of Φ2 mm × 70 mm. Fractography was carried out by using an HITACH TM-1000 scanning electron microscope (SEM). X-ray diffraction (XRD) measurements were performed using a Siemens Microdiffractometer with Cu Kα radiation ( λ = 0.1542 nm). The operation voltage and current are 40 kV and 150 mA, respectively. The measured angle, i.e., 2 θ, ranged from 20° to 63°. High-resolution transmission electron microscopy (HRTEM) was conducted in a Technai F20 microscope operated at an accelerating voltage of 300 kV. The TEM samples were firstly mechanically thinned and then ion-milled by using a Gatan 691 Precision Ion Polishing System with a liquid nitrogen cooling system till they became electron-transparent. The energy of the ion beam and the beam angle were 2.5 keV and 4°, respectively. The ion-milling durations for all of the samples were 2.5–3 h. Compression test specimens were fabricated from the rod-like samples by means of a diamond saw with cooling water. They had a height of 4 mm and a diameter of 2 mm. Compression tests were conducted using an Instron 8562 machine. All mechanical tests were carried out at a strain rate of 2.5 × 10⁻⁴ s-1.
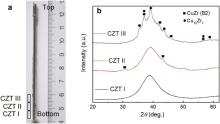
The as-cast sample exhibits a mushroom-like shape (see Fig. 1(a)). The bottom part of the rod solidifies first, suggesting the highest cooling rate. Along the length of rod towards the top, the cooling rate decreases due to the influence of the arc and the remaining melt. This is expected to result in different structures at different positions of the Cu50Zr45Ti5 rod. Therefore, we cut three compression test samples from bottom to top, which are named as CZT I, CZT II and CZT III, respectively (see Fig. 1(a)). After polishing, two ends of each compression test sample were directly observed by XRD. The XRD pattern exhibits a broad peak indicating a fully glassy phase for CZT I (see Fig. 1(b)). For CZT II, some weak peaks appear around the broad diffraction maximum, which can be attributed to nanocrystals precipitating in the glassy phase. Because the broad peak in the XRD pattern is still dominant and the diffraction peaks from crystalline phase are very weak, the size and the volume fraction of the crystals appear to be very small for CZT II. The XRD pattern of CZT III shows the presence of several phases. The calculations of the respective d-spacings obtained from the peak positions imply the presence of two main phases: the CuZr cubic B2 phase ( a = 0.3256 nm) and the orthorhombic Cu10Zr7 phase ( a = 1.2675 nm, b = 0.9313 nm and c = 0.9347 nm).
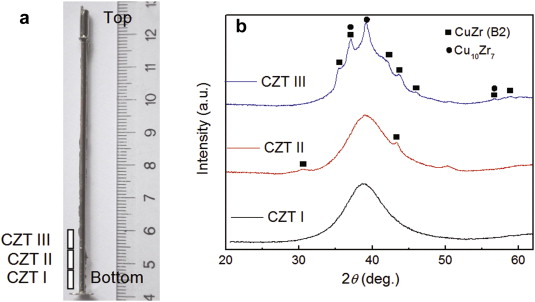 | Fig. 1. (a) As-cast Cu50Zr45Ti5 rod and a sketch of the position of the three samples investigated in this work; (b) XRD patterns of three samples. |
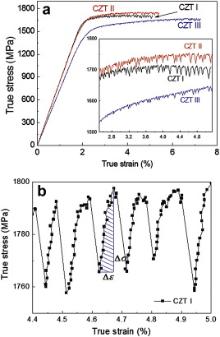
Compression tests of these three samples with different structures display different properties, as shown in Fig. 2(a). It is evident that the fully glassy structure (CZT I) exhibits a perfect elasto-plastic deformation behavior, i.e., a linear elastic deformation followed by serrated plastic flow, which is a typical behavior of BMGs [5]. Once crystals precipitate (CZT II), the stress–strain curve is influenced, which exhibits a slight strain-hardening behavior while the yield strength, maximum strength, total strain, and elastic modulus remain almost constant, as compared with CZT I (see ). CZT III exhibits a large plastic deformability, a smaller elastic modulus and yield strength (see Fig. 2 and ). At a higher magnification it becomes obvious that the amplitudes of the single serration events in the plastic regime in CZT III become smaller compared with those found in CZT I and CZT II (see inset of Fig. 2(a)). The plastic stress–strain behavior of the three samples clearly shows that with the structure evolving from fully glassy to a composite structure consisting of crystalline phases and glassy matrix, the amplitude of the serrations decreases.
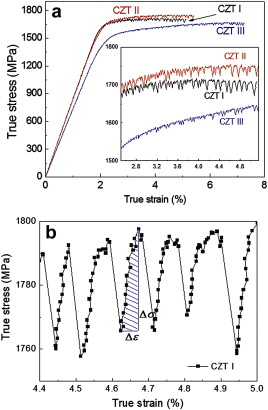 | Fig. 2. (a) True compressive stress–strain curves of the three Cu50Zr45Ti5 samples. The inset shows the enlarged serration events in the plastic regime; (b) elastic energy density for one serration event. |
| Table 1. Mechanical properties of four samples |
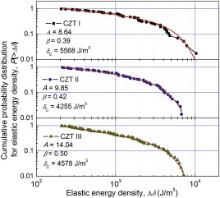
To further characterize the serrated flow behavior, a statistical analysis of the elastic energy density covered in the serration events was carried out. As shown in Fig. 2(b), the elastic energy density, Δ δ, can be calculated to be (where Δ σ and Δ ε are the elastic stress and elastic strain in one serration event, respectively) [18]. After an ergodic processing, a cumulative probability distribution, i.e., the percentage of serration events with an elastic energy density larger than an elastic energy density ( P(≥Δ δ)) is obtained and it shows a nonlinear dependence on Δ δ (see Fig. 3) [19]. The smaller elastic energy densities are more probable and follow a power-law distribution. The larger elastic energy densities do not follow a power-law distribution, and the probability of their occurrence decreases exponentially (see Fig. 3). The cumulative probability distributions of these three samples can be approximated by a power-law distribution function accompanied with a squared exponential decay function [20] and [21],
where Ais a normalization constant, βis a scaling exponent and δCis the cut-off elastic energy density (see Fig. 3). The fitting parameters are listed in Fig. 3. It is evident that the βvalue increases with the increase in the plastic strain ability, suggesting a transformation of the plastic flow mechanism [22]. The δCvalues of the samples containing crystals, i.e., CZT II and CZT III, are smaller than that of the fully glassy sample (CZT I), indicating that the shear avalanche size decreases due to the precipitation of crystalline phase.
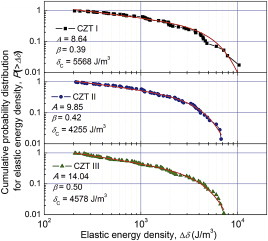 | Fig. 3. Cumulative probability distributions for the elastic energy densities of the three samples. Each data point is experimentally determined from the stress–strain curves. The solid lines are fitted using the relation. |
After the compression tests, the fractured samples were further observed by HRTEM in order to explore the origin of the different plastic flow, and the results are shown in Fig. 4. For CZT I, after plastic deformation, the high-resolution image shows a mazy pattern with a homogeneous contrast (see Fig. 4(a)), which is typical of a single-phase amorphous alloy. The inset of Fig. 4(b) shows a selected area electron diffraction (SAED) pattern with two diffraction halos. The dark field image (see Fig. 4(b)) also exhibits a homogeneous contrast. All these features imply an inherent amorphous character of CZT I. For CZT II, some small lattice fringes can be observed (as encircled in Fig. 4(c)). The dark field image (see Fig. 4(d)) shows some white spots corresponding to crystals. Although the SAED pattern (inset of Fig. 4(d)) also shows two diffraction halos, a strong and sharp diffraction ring on top of the inner halo can be observed, which is consistent with the XRD pattern in Fig. 1(b). By measuring five HRTEM images, we obtained the average diameter of nanocrystals, Davr, as approximately 4.2 ± 1.1 nm in CZT II. The volume fraction of the crystalline phase in CZT II, fc, is also averaged from five dark field images (such as in Fig. 4(d)) that were analyzed by a software of Gatan Digital Micrograph, and it is measured to be 4%. The high-resolution image of CZT III also shows some nanocrystals (see Fig. 4(e)). However, the dark field image suggests that the size and the volume fraction of the crystalline phase in CZT III are significantly larger than those in CZT II (see Fig. 4 (f)). The crystalline rings in the SAED pattern further confirm that a larger size and volume fraction of crystalline phase(s) in CZT III (see inset of Fig. 4(f)). After five images are measured, the Davr value is approximately 9.1 ± 2.0 nm and the fc value is 21%.
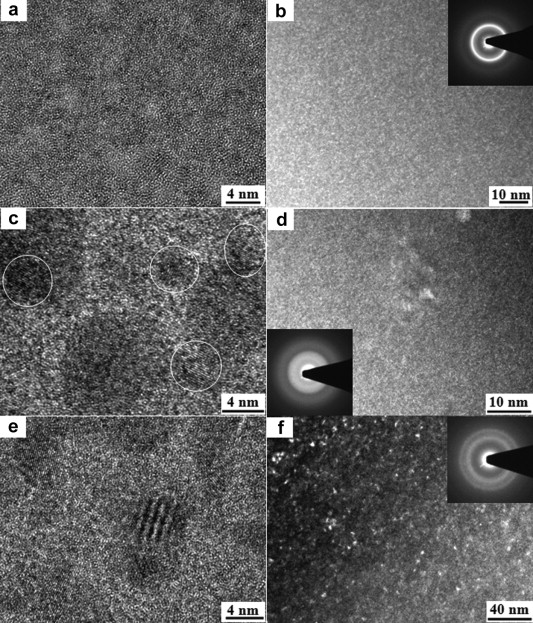 | Fig. 4. TEM images of three fractured samples: (a) high-resolution image of the fractured CZT I sample, (b) dark field image and the according SAED pattern of the fractured CZT I sample, (c) high-resolution image of the fractured CZT II sample, (d) dark field image and the SAED pattern of the fractured CZT II sample, (e) high-resolution image of CZT III after fracture, (f) dark field image and the SAED pattern of the fractured CZT III specimen. |
The SEM observations show that all three samples exhibit a shear fracture. They all fail under an angle of 43° and a lot of shear bands appear on the lateral surfaces of the three samples (see Fig. 5(a), (c) and (e)). The fractographic analyses of CZT I, CZT II and CZT III reveal almost identical features on the fracture surfaces, which exhibit a vein-like pattern (see Fig. 5(b), (d) and (f)). This suggests that the shear fracture in the glassy phase is the primary mechanism dominating the failure in CZT I, CZT II and CZT III [23].
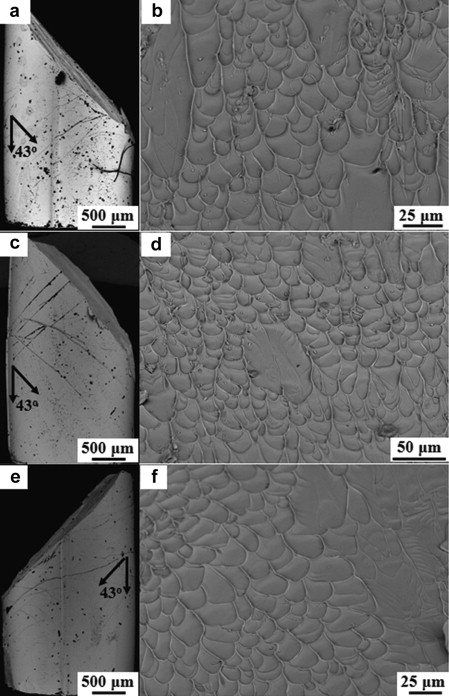 | Fig. 5. SEM images of three fractured samples: (a) surface morphology of CZT I, (b) fractography of CZT I, (c) surface morphology of CZT II, (d) fractography of CZT II, (e) surface morphology of CZT III, (f) fractography of CZT III. |
Based on the compression tests, it is obvious that a nanocrystal/glass matrix dual phase structure results in softening, i.e., a reduction in the yield strength, in Cu50Zr45Ti5 alloy. This softening effect becomes more significant as the size and volume fraction of crystals increases because of the change in the deformation mechanism. The mechanism of plastic deformation in the monolithic glass is dominated by shear band formation and propagation ( Fig. 5(a) and (b)) [24]. The shortcoming of this shear banding mechanism in BMGs is that the highly localized deformation seriously restricts the tolerance towards plastic deformation. The presence of nanoparticles in the glassy matrix significantly improves the plasticity, especially in CZT III. On the other hand, the yield strength decreases with increasing nanoparticle size and volume fraction, which excludes a possible particle hardening mechanism in CZT III. Since the enhanced plasticity is achieved by introducing nanoparticles, the deformation mechanisms in glass matrix composites are strongly influenced by the size, spatial distribution, and the mechanical properties of the particles, as well as the geometry and deformation characteristics of particle–matrix interfaces [25].
To further address the influence of nanoparticles on the formation of shear avalanches, we focus on the distribution of the nanocrystals. Once the crystalline volume fraction and the average particle size are known, one can calculate the average interparticle spacing, L [26],
The calculated interparticle spacing should yield the same result as those determined experimentally, shown in Fig. 4(c) and (e). This is indeed observed. The calculated results are listed in .
Fig. 6 shows the shear banding mechanism in the dual phase microstructure. The distances between two neighboring particles, S, for CZT II and CZT III are 5.7 ± 1.3 nm and 3.9 ± 1.2 nm, respectively (see Fig. 6). Previous studies have suggested that the thickness of shear band is ~10 nm, which is larger than the S values in our dual phase samples [27] and [28]. Hence, the shear band formation and propagation in CZT II and CZT III is expected to interact with the nanoparticles. Depending on the particle size, the interaction between shear band and crystalline particle has two types of mechanisms.
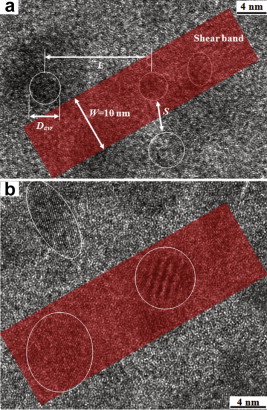 | Fig. 6. Description of the shear band propagation in the composite microstructure: (a) small nanocrystals drifting in a shear band (CZT II), (b) large nanocrystals interacting with a propagating shear band (CZT III). |
For CZT II, since the yield strength is identical to that of CZT I, it is believed that the shear band formation and propagation are also the main mechanisms dominating the plastic deformation. Considering that the average nanoparticle size in CZT II is 4.2 ± 1.1 nm, which is less than the critical size (approximately 11 nm [29]) for formation of stable dislocations, no dislocations are found in these nanoparticles ( Fig. 4). On the other hand, simulation results suggest that for the small nanocrystals the stress concentration at the interface with the glassy matrix is higher than that experienced in the center of the nanoparticle [30]. In this case, yielding occurs at the interface before the stress in the interior of the nanoparticles is sufficient to cause dislocation motion. Therefore, the nanocrystals can be treated as hard particles embedded into a glassy matrix. When the load approaches the yield strength of the glassy matrix, shear bands must be formed and then the shear is transferred across the interface between the nanocrystal and glassy matrix. The deformation is accommodated completely at this interface, which can result in a rotational motion of the nanocrystals and/or exchange of atoms between matrix and nanocrystals [30]. Although the rotational motion and/or exchange of atoms weakly affect the shear band propagation, i.e., does not significantly influence the mechanical properties, such as elastic modulus, plastic strain and yield strength, the δC value in Eq.(1) decreases obviously because the shear avalanche size is decreased [2]. In a fully glassy alloy, after yielding, the alloy approaches a critical state, in which shear banding can be initiated at some spots where the aggregation of shear transition zones (STZs) leads to the formation of shear bands [31]. This STZ aggregation is always accompanied by an elastic energy accommodation manifested as the elastic deformation in every serration event [32]. Through the formation of shear bands, the material organizes itself to match the plastic strain. In the present study, since the nanocrystal/glassy matrix interfaces can be considered as a defect, the accommodation of deformation at the nanocrystal/glassy matrix interface results in a stress concentration (or stress gradient) [30], which actually results in yielding before the aggregation of STZs can occur in the glassy matrix, which however is a necessary condition for the formation of shear bands. Then, the elastic energy density in the serration events decreases as compared with that in CZT I. Therefore, it can be imaged that the interfaces participate in the shear avalanche, leading to a decrease in the shear avalanche size. The β value is associated with the structural unit to self-organize to the critical state [22]. Since the size of nanocrystals in CZT II is half of the thickness of a typical shear band, the nanocrystals act as hard particles and drift in the viscous shear band as they shear across these nanocrystals (see Fig. 6(a)). In this case, the viscosity of the glassy phase in the shear band is improved [33]. The plastic strain rendering medium is the shear band in CZT II. The nanoparticles embedded in the shear bands modify the properties of the viscous layer, suggesting a structural change. As the fingerprint of the structural units, the β value increases.
When the nanocrystal size and the volume fraction increase to 9.1 ± 2 nm and 21%, respectively (CZT III), the mechanical properties are obviously changed (Table 1). The nanoparticle size of 9.1 ± 2 nm is comparable to the thickness of a shear band [27], meaning that the stress concentrations built up in the center of such crystals is much higher than that at the interface of the nanoparticle/glassy matrix based on simulation results [30].
To further address this, we can roughly estimate the yield strength of CZT II. Since the shear fracture is the main fracture mechanism in this alloy system, the shear stress plays an important role in the yielding behavior. The shear stress, τc, at yielding can be expressed as
where σyis the yield stress and θis the fracture angle (43°). The shear stress of CZT I at yielding is 753 MPa. Thus, the critical shear stress, which initiates shear bands in the glassy CuZr system is approximately 753 MPa. The critical shear stress of CZT II calculated from Eq.(3) is 754 MPa that is almost the same as the value in CZT I. However, in CZT III, the critical shear stress for yielding is decreased to 651 MPa, which is less than the critical value for the operation of shear bands in the glassy phase (753 MPa). In this case, the critical shear stress of 651 MPa must be accommodated at the interface between the nanoparticles and the glassy matrix. This stress accommodation leads to an increase of stress gradient in the center of nanocrystal as much as ~4.5 times of critical shear stress [30]. As such, the actual stress in the center of a nanocrystal reaches 2930 MPa. Based on classical dislocation theory, the critical shear stress needed to nucleate a perfect dislocation, τN, can be expressed as [34]
where αis a parameter reflecting the character of the dislocation ( α= 0.5 and 1.5 for edge and screw dislocations, respectively [35]); Gis the shear modulus and bNis the magnitude of the Burgers vector of the perfect dislocation. To estimate the bNvalue, we introduce the criterion for the formation of twins because the B2 phase in CuZr binary alloy facilitates twinning [16]. The necessary condition for twinning in nanocrystals is a process of the competition between the critical shear stress needed to nucleate a perfect dislocation and the critical shear stress required to initiate a Shockley partial twinning dislocation to generate stacking faults and deformation twins, τP [34]. These two shear stresses are associated with the crystal size, Davr. Once the Davrvalue approaches a critical size, twinning operates. This relationship can be formulated as [34]
where bPis the magnitudes of the Burgers vector of the partial dislocation and γis the stacking fault energy. In the present study, the Gvalue of the crystalline phase is approximately 32 GPa [26]. The αvalue is taken as 1 [34]. The bPvalue is approximately 0.095 nm [36]. The minimum critical crystal size for the twin formation is around 15 nm [36]. The γvalue is 0.12 J/m2 [36]. The bNvalue is calculated to be 0.391 nm and then the τNis estimated to be 2750 MPa, which is consistent with the stress gradient (2930 MPa) in the center of the nanocrystals. Therefore, a higher stress state in the center of crystals can result in a homogeneous dislocation nucleation preferentially initiated in the interior of the crystals [30], which leads to the fact that the yield strength of CZT III is approximately 14% lower than that of CZT I. However, dislocations cannot be found in the HRTEM images ( Fig. 4(f)). The reason for this finding is attributed to instability of the dislocations in the nanocrystals, whose size is less than the critical value [29]. The nanocrystals in CZT III act as a softer matter to render the plastic strain, which retard the catastrophic shear fracture and then improve the plasticity. The characteristic size of shear avalanches in CZT III is reduced as compared with that in CZT I. According to the statistical analysis ( Fig. 3) the elastic energy in the serration events follows a power-law distribution and is accompanied by a squared exponential decay. This suggests that in the composite microstructure (nanocrystal/glass matrix) of CZT III the dynamics of the serrated plastic flow still have the signature of SOC behavior. The dislocation-based plastic deformation also exhibits an intermittent stress fluctuation, which can only appear at the microscale rather than the macroscale [7] and [37]. Therefore, in CZT III, the stress fluctuations appear at the macroscale, which should be the result of the shear banding process rather than the force fluctuation coming from the dislocation motion. Hence, the stress accommodation and relaxation in each serration event correspond to the shear band formation and propagation, and the δCvalue reflects the characteristic shear avalanche size. The decreasing δCvalue is because of the “soft” nanoparticles, which release the stress accommodated during the elastic stage upon the plastic deformation. Thus, the energy used to initiate shear bands and to make them propagate is reduced. In other terms, the βvalue is related to the microstructure [7]. The increase in the βvalue suggests that the composite microstructure in CZT III decreases the fractal dimension of Df= 1/ βin the plastic regime. It is obvious that the Dfvalue decreases from 2.56 (CZT I) to 2.38 (CZT II) and 2.00 (CZT III) with increasing the size and volume fraction of the nanocrystals, which suggests that the fractal network of the glassy phase in these three samples already changes with the structural differences [22].
The discussion above indicates that the precipitation of nanocrystals affects the mechanical behavior of Cu50Zr45Ti5 alloy system by disturbing the shear banding behavior. The characteristic shear avalanche size, δC, of CZT I is 5568 J/m3, which is a value reflecting the shear avalanche without any interferences caused by nanocrystals. As hard particles, i.e., nanocrystals without any defects, are introduced into the glassy matrix (CZT II), the shear avalanches are affected and the δC value decreases to 4255 J/m3. The drift of these hard particles in shear bands finally leads to a slight strain hardening. In CZT III, the possible dislocation motion in the larger nanocrystals enhances the plastic strain and releases the stress accommodated in the glassy matrix. Therefore, the plasticity is improved and the δC value decreases to 4578 J/m3 compared to that in CZT I.
References
G. Wang acknowledges the Alexander von Humboldt Foundation for financial support. This work was supported by the National Natural Science Foundation of China (Nos. 51171098 and 51222102), the Innovation Program of Shanghai Municipal Education Commission (No. 12ZZ090), the Program for Professor of Special Appointment (Eastern Scholar) at Shanghai Institutions of Higher Learning, and the 085 project in Shanghai University.
| 1. |
|
| 2. |
|
| 3. |
|
| 4. |
|
| 5. |
|
| 6. |
|
| 7. |
|
| 8. |
|
| 9. |
|
| 10. |
|
| 11. |
|
| 12. |
|
| 13. |
|
| 14. |
|
| 15. |
|
| 16. |
|
| 17. |
|
| 18. |
|
| 19. |
|
| 20. |
|
| 21. |
|
| 22. |
|
| 23. |
|
| 24. |
|
| 25. |
|
| 26. |
|
| 27. |
|
| 28. |
|
| 29. |
|
| 30. |
|
| 31. |
|
| 32. |
|
| 33. |
|
| 34. |
|
| 35. |
|
| 36. |
|
| 37. |
|