Plastic Flow of a Cu50Zr45Ti5 Bulk Metallic Glass Composite
Wang G.1, *  , Pauly S.
2 , Gorantla S.2 , Mattern N.2 , Eckert J.2, 3
, Pauly S.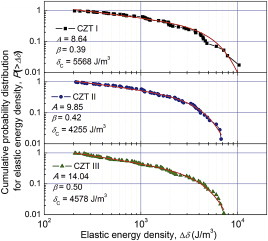
Plastic Flow of a Cu50Zr45Ti5 Bulk Metallic Glass Composite |
|
Wang G.
, Pauly S. |
| Fig. 3. Cumulative probability distributions for the elastic energy densities of the three samples. Each data point is experimentally determined from the stress–strain curves. The solid lines are fitted using the relation P ≥ Δ δ = A Δ δ - β exp [ - Δ δ δ C 2 ] . |
| |