
Finite Element Simulation on Thermal Fatigue of a Turbine Blade with Thermal Barrier Coatings
[Yang L.1, 2 , Liu Q.X.1, 2 , Zhou Y.C.1, 2, *  , Mao W.G.
1, 2 , Lu C.3 ]
, Mao W.G.|
|


In this paper, a finite element model was developed for a turbine blade with thermal barrier coatings to investigate its failure behavior under cyclic thermal loading. Based on temperature and stress fields obtained from finite element simulations, dangerous regions in ceramic coating were determined in terms of the maximum principal stress criterion. The results show that damage preferentially occurs in the chamfer and rabbet of a turbine blade with thermal barrier coatings and its thermal fatigue life decreases with the increase of thermal stress induced by high service temperature.
Thermal barrier coatings (TBCs) are usually applied to protect structural materials from hot gases in high temperature power engines such as gas turbines, internal combustion engines and fuel evaporators [1], [2] and [3]. TBCs commonly comprise an yttria-stabilized zirconia (YSZ) ceramic layer that barriers hot gases to melt turbine components, a substrate that endures mechanical loading and a MCrAlY alloy ( M represents Ni, Co, or Fe) bond coating that enhances adhesion of ceramic coating to substrate. By using TBCs along with internal cooling of the underlying superalloy components, temperature on superalloy can be decreased by 100–300 °C [1] and [4]. This has allowed for a higher engine operating temperature, thereby improving the engine efficiency and performance. In this multi-layered structure, however, each layer of TBCs has remarkably different physical, thermal and mechanical properties, which result in coating failures with the main type of spallation. During processing and further thermal exposure, a fourth layer, named as thermally grown oxide (TGO), is formed between bond and top coatings due to the diffusion and reaction of oxygen and metal ion. The growth of TGO aggravates the mismatch between these layers [5], [6], [7] and [8]. Thus, a turbine blade with TBCs usually has a very complex shape and structure, which makes its failure assessment or life prediction under harsh operating conditions much more complicated than that in metallic, ceramic components or other coating systems. In other words, the failure assessment or prediction for a turbine blade with TBCs is essential and desirable, but still intractable.
Spallation of ceramic coating occurs by the slow growth and eventual coalescence of sub-critical cracks, including cracks within top coating and at the interface of YSZ and TGO (or TGO and bond coating). The formation of these cracks is related to local thermal stresses due to the property mismatch, oxidation, interfacial roughness, creep, and sintering. Therefore, thermal stresses in TBCs are very complicated but necessary to be calculated in either the control of their failure and service life or the design of their materials and layer geometries. Significant efforts have been dedicated towards the reliable assessment of thermal stresses of TBCs and improvement of their reliability. For instance, theoretical models were established for thermal residual stress induced by the thermal mismatch and spatial variations in the growth of TGO [9] and [10]. Meanwhile, a number of experimental methods such as X-ray diffraction [11], Cr3+ piezo-spectroscopy [12] and synchrotron radiation [13] have been applied in the stress testing to qualitatively explain how cracks propagate in TBCs. Generally, analytic solutions can be obtained to describe biaxial thermal stress states in TBCs with a simple plate shape under a linear elastic or simple elastic–plastic approximation. However, these solutions cannot take into account the spatial variation in the growth of TGO and the complex structure associated with actual turbine blades. Additionally, the above-mentioned stress testing techniques can only be used to monitor the stress evolution in a very small region, and moreover, their applications require strict experimental conditions. Obviously, the complex geometry shape and interface morphology lead traditional strength analysis or experimental testing of stresses in a turbine blade with TBCs be very difficult or even impossible.
Recently, finite element (FE) simulations have been accepted as an attractive tool to estimate thermal stresses in TBCs [14], [15], [16], [17], [18], [19], [20] and [21]. Based on FE simulations, the stress field and especially the deformation evolution at interface within TBCs are extensively investigated. In these researches, several phenomena were considered such as residual stresses generated during the spraying of coatings, the intrinsic thermal mismatch, the elastic anisotropy within ceramic coating, the morphology of interface, the creep of TBCs layers and the growth of TGO [14], [15], [16], [17], [18], [19], [20] and [21]. The results show that oxidation and thermal loading after cooling give rise to significant compressive stresses within YSZ coating and TGO interfaces, which results in interface cracks as well as delamination [14], [19] and [20]. Moreover, the stress state depends crucially on the ratio of loading rate caused by growth and swelling of TGO layer and the unloading rate by creep relaxation [19] and [21]. However, almost all these works focus on regular plate or columnar TBCs and just a few attempts concern the performance of TBCs with an approximate shape of turbine blades [16], [22], [23] and [24]. For example, Wei et al. [22] investigated the thermal barrier effect of TBCs with leading and trailing edges without TGO, and according to their simulations on the temperature field, the thermal barrier effect of a leading edge is better than that of a trailing edge. Lugscheider and Nickel [16] simulated temperature and stress distributions in a blade with TBCs but without rabbet during a coating process, and found out that both are non-uniformly distributed. It is worth noting that, however, the majority of these three-dimensional models of TBCs are a simply extended form of two-dimensional models. Experimental results show that the failure zone of a TBC system is usually located in the border region of a blade body and its rabbet [23] and [24]. Thus, the potential influence of a complex geometry shape on the performance of TBCs is important, which makes any attempt with emphasis on simulating the fracture behavior of a turbine blade with TBCs be desirable and essential.
In this work, the thermal fracture behavior of TBCs was investigated under cyclic thermal loading. The FE model of a turbine blade with TBCs was firstly established by using the combination of CATIA and ABAQUS software. Then, the temperature distribution and stress evolution in the turbine blade were simulated, in which the effects of elastic–plastic deformation, high temperature creep, interfacial oxidation and deposition process were considered. Finally, dangerous regions of ceramic coating were predicted according to the maximum principal stress criterion. Based on the prediction of dangerous regions, the service life of a turbine blade with TBCs was discussed with the variation of temperature.
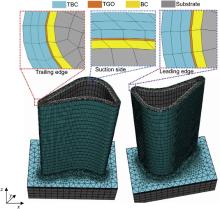
A turbine blade with TBCs, as shown in Fig. 1, comprises the blade body and turbine rabbet, which are produced by depositing a NiCrAlY bond coating and a ZrO2-8 wt% Y2O3 ceramic coating on a Ni-based alloy substrate with internal hollow cooling passages. The thicknesses of bond and ceramic coatings are 100 μm and 300 μm, respectively. Commonly, TGO formed during the high temperature oxidation has the maximum thickness of about 10–50 μm, and its morphology including thickness, microstructure, composition as well as the roughness of ceramic/bond coatings' interface are non-uniformly distributed in TBCs [12], [14], [19] and [25]. Morphological instability of TGO results in different thickness in each layer, and is a fundamental source of failure in TBCs [12], [14], [19], [25] and [26]. The thickness of TGO, however, is experimentally found that has a negligible influence on stress in thick ceramic coating (>50 μm) [26]. In considering of simulating the fracture behavior of TBCs with a complex turbine blade structure, here, the flat interface is assumed and the TGO is set to be 20 μm thick without the morphological instability in order to decrease the calculation time. The thicknesses of substrate for blade and rabbet are about 1 mm and 8 mm, respectively. The length of the blade body is 50 mm. The base material and coatings are modeled with the combination of the CAD software CATIA and the FE software ABAQUS. The geometry shapes and dimensions of ceramic coating, TGO, bond coating, and substrate are firstly built up in CATIA, and then merged together in ABAQUS. The FE model of a turbine blade with TBCs is shown in Fig. 1. Several assumptions have been made for simplification such as: (1) only one cooling passage is considered for both the blade body and rabbet; (2) the geometry shape of rabbet is regarded as a rectangle; (3) in each layer, its thickness is the same; (4) no thermal convection or emission occurs; (5) the phase transformation and sintering of ceramic coating is not considered; and (6) interfaces in TBCs are all undamaged.
 | Fig. 1. Illustration of the finite element model of a turbine blade with TBCs. |
The hexahedron plane strain element (C3D8RT) for the turbine blade and rabbet and the tetrahedron plane strain element (C3D4T) for the connection region between blade and rabbet are chosen. The number of elements in meshing is limited to an acceptable value in consideration of both the accuracy of numerical solutions and calculation time. Damage in ceramic coating is preferential failure in TBCs, and its temperature, displacement and stress evolution should be accurately calculated. Thus, elements are densest in ceramic coating. The study on the mesh sensitivity revealed that an adequate accuracy can be achieved by using about 210,000 elements for a turbine blade with TBCs. The iterative solution is stopped if the value of the maximum residual force divided by the maximum reaction force is less than 0.01 and the temperature change does not exceed 0.5 °C. Adaptive meshing is also used to achieve a higher accuracy.
Each layer of a turbine blade with TBCs, including ceramic coating, bond coating, TGO and substrate, is treated as an isotropic and homogeneous material. The physical and thermal properties of coatings and base alloy are listed in [21] and [27], which are temperature-dependence with a linear elastic behavior. The ceramic coating is capable of deforming elastically, creep, and then cracking if stress is equal to its tensile strength according to the maximum stress principle. The creep behavior of ceramic coating is described by [21]
where
To simulate the thermal cycling, a turbine blade with TBCs is assumed to be fixed in an equipment that does not make TBCs rotate. Therefore, the boundary conditions in the FE model of a turbine blade with TBCs, as shown in Fig. 1, are set as follows: (1) The displacement in the z direction is zero, i.e., w = 0, on the bottom surface of the turbine rabbet; and (2) the central line of the bottom surface of the turbine rabbet cannot move along the x and y directions. In this case, the bottom surface of the turbine rabbet can only expand symmetrically along the x or y direction, and cannot move along the z direction or rotate in the x– y plane.
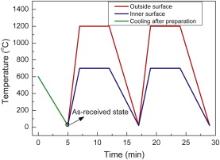
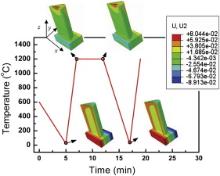
The stress produced in deposition is a major source of stresses in a TBC system, which should be calculated in the analysis of stress evolution in a turbine blade with TBCs. Therefore, the thermal loading investigated in this paper consists of coating deposition and thermal cycling. For the former, the turbine blade with TBCs is cooled from a deposition temperature of 600 °C [16], at which the initial stress in the whole turbine blade is zero [21]. A thermal cycle is defined as a 2-min heating, a 5-min insulating and then a 5-min cooling to room temperature. In details, as shown in Fig. 2, the surface of top ceramic coating is heated up to 1200 °C from room temperature in 2 min, kept at 1200 °C for 5 min, and then cooled to room temperature (20 °C) in 5 min. The temperature of the inner surface of substrate, i.e., the cooling channel, is heated up to 700 °C in 2 min, kept at 700 °C for 5 min, and then cooled to room temperature (20 °C) in 5 min. Obviously, there is a temperature gradient in layers of TBCs during a thermal cycling. In addition, the thermal radiation and convection of a TBC system is not considered.
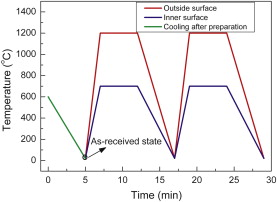 | Fig. 2. A typical thermal cycle for a turbine blade with TBCs, which contains three steps: heating, holding and cooling. |
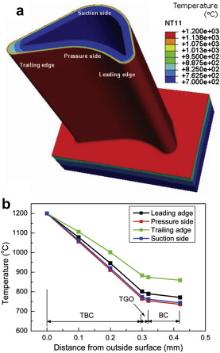
Fig. 3 shows the temperature distribution of a turbine blade with TBCs at the insulating state of thermal cycles, where temperatures in the system are steady and the highest, and thus temperatures at different sites directly reflect the thermal barrier effect of TBCs associated with their geometry shapes. As mentioned in Section , temperatures of the outside surface of ceramic coating and the inner surface of substrate are kept at 1200 and 700 °C, respectively. It is seen that temperature decreases gradually from the outside surface of ceramic coating to substrate due to the thermal barrier effect of TBCs and inner cooling. In order to show the difference of a temperature field in TBCs, temperature distributions in typical regions as designated in Fig. 3(a), including the leading edge, pressure side, trailing edge and suction side, are shown in Fig. 3(b). The temperature difference in the coating thickness direction of TBCs is not uniform in these regions. Temperature of the bond coating/substrate interface ranges from 734 to 859 °C, i.e., the thermal barrier effect of TBCs is between 262 °C and 387 °C at the different locations. It is also seen that temperature values near edges, especially at the trailing edge regions are relatively higher than that of the other areas, such as the suction or pressure side. This is in good agreement with the available results [28]. Obviously, it is attributed to the unavoidably small and narrow dimension of a cooling channel in the case of only one of channels is considered.
 | Fig. 3. Temperature distributions in the holding stage: (a) temperature contours of the whole TBC system; and (b) temperature distributions through the cross section of selected sections, where paths are selected from surface to interface of bond coat and substrate. |
When a turbine blade with TBCs experiences a cooling stage from deposition to room temperatures, inhomogeneous deformations are caused due to the thermal mismatch between different layers, as well as their geometry shapes. Fig. 4 shows the distribution and magnitude of the U1, U2 and U3, which are the displacements along x, y, and z direction after deposition, i.e., cooling to room temperature from 600 °C, for two aspect directions of the turbine blade. It is obvious in Fig. 4 that the displacement in each direction is non-uniform in different regions of ceramic coating, especially for U2. The magnitude of displacement U1 is negative and decreases along the x positive direction with a minimum value of -0.0131 mm at the leading edge, but is positive and increases along the x negative direction with a maximum value of 0.0136 mm at the trailing edge. This is attributed to the approximate symmetrical shape and the boundary condition. Due to the contraction caused by cooling, TBC moves towards the fixed boundary of the line with y = 0, and thus the displacement is negative along the x direction but positive along the opposite x direction. Moreover, the displacement should be cumulative with the increase of coordinate values, which makes the displacement reach maximum or minimum at edges. Similarly, the displacement U2 along the thickness direction shows an opposite symbol at the pressure side compared to that of the suction side, at which U2 is negative due to the cooling contraction along the y positive direction. It is seen that the extremum of U2 locates at the top or bottom of the central for suction or pressure side. Similarly, the axial displacement U3 is negative due to the cooling contraction along the z positive direction. The z-axis locates at the bottom surface of turbine rabbet, and thus the top of blade body has the maximum displacement, and the bottom surface of rabbet is slightly upward curved.
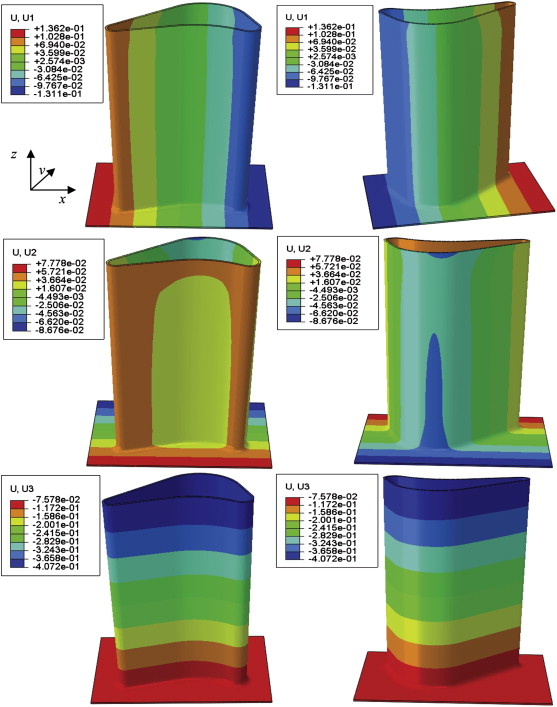 | Fig. 4. Distribution and magnitude of U1, U2 and U3 displacements after deposition, heating, holding and cooling during the first thermal cycle in two aspect directions of a turbine blade. |
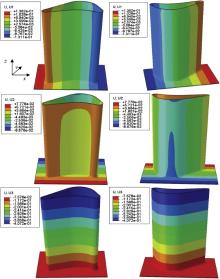
As shown in Fig. 5, four maps represent the displacements at the ends of preparation, heating, holding, and cooling stages, respectively. In the case of TBC along the y positive direction, it is seen that displacements initiate negative due to the initial cooling contraction, reverse to positive attributed to heating expansion, and then exhibit a small increase in the holding temperature stage, finally return to negative after cooling. It is worth noting that the displacement distribution is not uniform in each stage, indicating that the deformation of TBCs is greatly affected by the irregular geometry shape of a turbine blade. Fig. 5 also shows that the regions located at the top, bottom of suction or pressure side tend to produce a maximum displacement with the occurrence of bigger strains, where dangerous sites and sub-critical cracks preferentially form.
 | Fig. 5. Out-of-plane displacement contours of a TBC system in the first thermal cycle. The starting and ending points at each step during the first thermal cycle are considered. The line represents the temperature distribution of the first thermal cycle. |
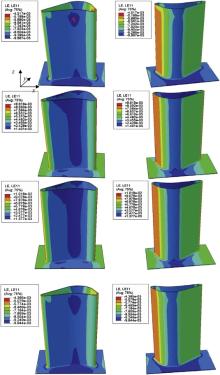
To analyze the role of geometry shape in deformation of a turbine blade with TBCs, the results of tensile strain along x direction, ɛ11, as a typical component of the strain field, at the end of each cycling stage, are shown in Fig. 6. After deposition, the compressive strain in ceramic coating is attributed to the cooling contraction from a free state at deposition temperature, while reverses to tensile strain on heating. As holding begins, the tensile strain of the whole ceramic coating gradually increases. On cooling, the compressive strain develops and shows a little increase in magnitude due to creep at high temperature; such as, the strain of region A increases from -0.009967 after deposition to -0.009944 at the end of the first cycle. Obviously, such a strain evolution process can be reasonably explained by the thermal cycling, i.e., heating expansion and cooling contraction. Similar to the feature of displacements, the distribution of ɛ11 is directly influenced by the shape change. The maximum compressive strain is -0.009967 at the top of pressure side, as signed A in Fig. 6. Relative higher strains develop at the central line of suction side, the bottom of pressure side, etc. These regions are dangerous sites for cracking or spallation of coating.
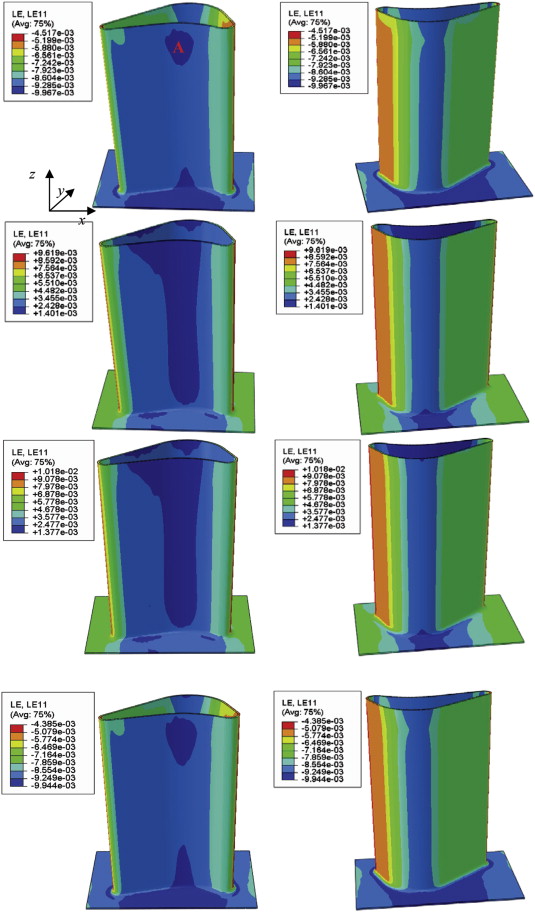 | Fig. 6. Simulation results of strain, ɛ11, as a typical component of the strain field, at the end of each cycling stage. |
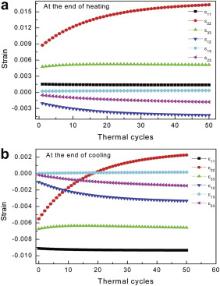
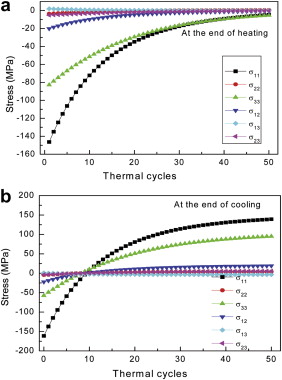
Fig. 7 depicts the strain evolution at the end of heating and cooling stage. Tensile normal strains develop in the heating stage with the maximum component of ɛ22, which is the tensile strain along y direction and results in lateral cracks in the interface between top ceramic coating and TGO. Although the normal strain components ɛ11 are moderate, the surface vertical cracks in ceramic coating occur because it can only tolerate the moderate tensile strain due to porous structures. Generally, strains within ceramic coating after cooling, for example, the resulting strain components of ɛ11, ɛ33, ɛ12, ɛ13 and ɛ23, as shown in Fig. 7(b), are compressive, which are caused by the cooling contraction and thermal mismatch. In particular, the out-plane strain, ɛ22, reverses to the tensile strain after about 20 cycles and its value increases with the increase of thermal cycles, which could lead to delamination at interface. The reason of the large strain values, as shown in Fig. 7, is due to the use of a linear elastic model for TBC in FE simulations. It is worth noting that, however, the shear strain component, which is equal to two times of ɛ12, ɛ13 or 2 ɛ23, is small and not crucial to failure of TBCs.
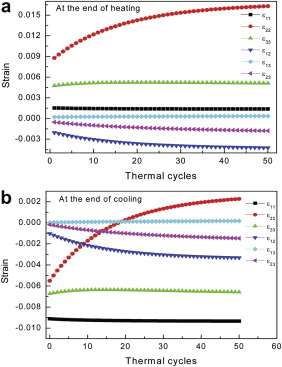 | Fig. 7. Evolution of strain components at location A (as shown in Fig. 6) developed from (a) heating and (b) cooling with the number of cycles, respectively. |
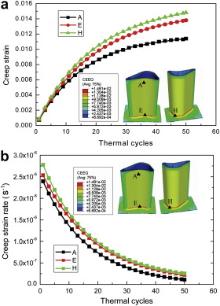
It has shown that the fracture behavior of TBCs is strongly influenced by their creep properties [21], [27] and [29]. For this reason, the creep of ceramic coating is considered in simulations of a turbine blade with TBCs. For simplification, only the equivalent strains from creep and their corresponding strain rates are calculated during the holding temperature stage in thermal cycling. As shown in Fig. 8(a), creep strains exhibit slightly higher in pressure and suction sides, where ceramic coating has a relatively bigger temperature gradient than other regions illustrated in Fig. 4. The magnitudes of creep strain at locations A, E, and H are small but rapidly increase with the thermal cycles. As the cycle proceeds, the accumulative creep strains tend to saturate, with the decrease of the creep strain rate, as shown in Fig. 8(b). The predicted magnitude and evolution of the creep strain rate of ceramic coating coincide with that reported in literature [30].
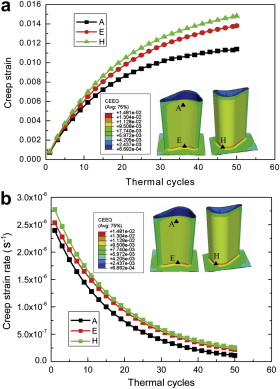 | Fig. 8. Relationships between (a) equivalent strains from creep and (b) the creep strain rate with the cycle number, respectively. |
The coating quality is strongly dependent on residual stresses in TBCs produced from deposition [9], [27] and [29]. Generally, the deposited ceramic coating after the rapid contraction of sprayed splat reaches an equilibrium temperature that is the same as the underlying materials (600 °C), at which the TBC system is regarded as a non-stress state. Simultaneously and slowly cooled down, the thermal transfer in the whole system proceeds through the convection with environment, leading to the decrease of temperature until 20 °C, which creates a thermal stress. During cooling to room temperature, the difference of thermal expansion coefficients between deposit and substrate causes in-plane compressive stresses, σ11, in ceramic coating, as shown in Fig. 9. It is seen that the final compressive stresses in ceramic coating after the spraying range from -10 to -180 MPa. The major types and magnitudes of stresses in ceramic coating are in accordance with analytical results [9], [26] and [35] and experimental data [31] and [32], which are in the range of -14 to -92 MPa. Moreover, the stress distribution has the same characteristic as that of strain component ɛ11 (see Fig. 6), which is determined by the constitutive relation. The magnitude of the compressive stress increases with the curvature radius, showing noticeable higher values at pressure and suction sides and reaching -200 MPa at location A, but changing to tensile stresses at trailing and leading edges. Obviously, the geometry shape of a turbine blade with TBCs has an important effect on stress distribution.
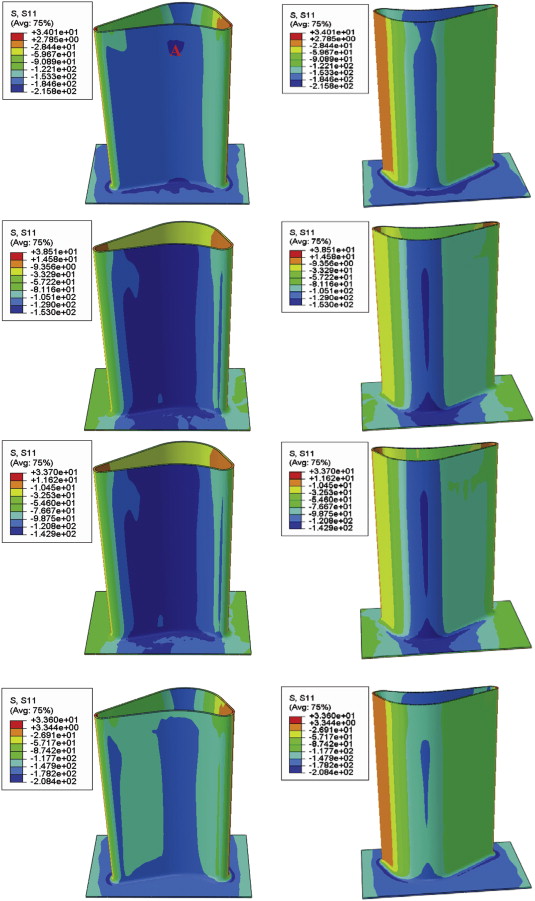 | Fig. 9. In-plane stress contours, σ11, in top ceramic coat during a whole thermal cycle from both pressure and suction sides of a turbine blade with TBCs. |
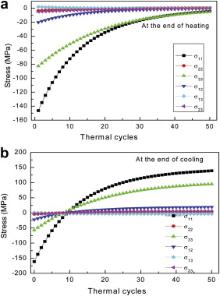
The distribution of in-plane stresses, σ11, as shown in Fig. 9, presents the evolution during a whole thermal cycle. It is seen that compressive stresses in ceramic coating gradually decrease during heating or holding at high temperature due to the heating expansion and creep strain. Although compressive stresses develop in ceramic coating on cooling, the absolute values of stresses decrease compared to that of initial residual stresses due to the relaxation creep from ceramic coating. As an example, the stress evolution with thermal cycles in region A is plotted in Fig. 10, where stress components at the end of heating and cooling stages are shown, respectively. It is seen that compressive stresses σ11 and σ33 developed at the end of heating stage decrease with a small rate and then reach a steady value of about -20 MPa after 40 thermal cycles. For residual stresses σ11 and σ33 formed after cooling in a thermal cycling, the stress reversal (from compression to tension) is observed with a saturation value of about 130 and 75 MPa, respectively. Stresses at location A show that the maximum component is σ11 in both heating and cooling stages. Such a stress could trigger a crack vertical to the TBC interface in ceramic coating. Fig. 10 also shows that shear stresses of ceramic coating are not high and have a trivial effect on failure of TBCs. Another interesting point in Fig. 10 is that out-of-plane stresses, σ22, are about zero at location A, which is in agreement with the free surface boundary condition of ceramic coating.
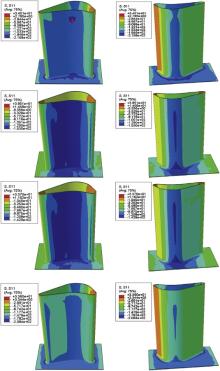
For simplification, the maximum principal stress is chosen to predict failure in a turbine blade with TBCs. According to the maximum tensile stress criterion, failure takes place at locations where the maximum principal stress reaches the strength of top ceramic coating. Fig. 11 shows the stress contours in top ceramic coating from both pressure and suction sides of a turbine blade with TBCs. The higher stresses located in ceramic coating during the thermal cycling, marked with A to H in Fig. 11, are regarded as dangerous regions, which are consistent with that observed from experiments [23] and [24]. The curves, as shown in Fig. 11, give information on the evolution of the maximum principal stresses in these dangerous regions with the thermal cycling. It is clear that compressive stresses during initial 12 cycles are about -10 MPa. Given that the compressive strength of YSZ is -500 MPa [33], the compressive stress-driven damage, such as buckling and delamination, would not occur.
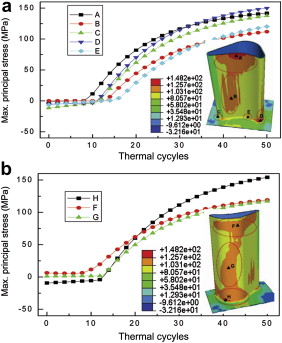 | Fig. 11. Maximum principal stress contours and stress evolution of dangerous regions in top ceramic coat at the end of 100 thermal cycles. The top ceramic coat is separated from the model. |
As shown in Fig. 11, the tensile stress in these marked locations rises very quickly until the 40th thermal cycle. Then, for locations of A and C, stress values are nearly the same. The stress of location H keeps increasing, which exceeds the stress values of A and C at the 36th thermal cycle. Here, the inelastic deformation plays a very important role in the stress evolution [34], which consists of plastic and creep deformations. The plastic deformation causes the increase of stress during the first 14 thermal cycles, and then creep leads to the stress relaxation.
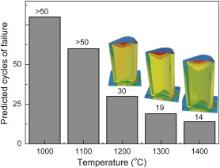
To study the influence of temperature, the maximum temperature on the inner surface of cooling channel is assumed to be 700 °C. The working temperatures (i.e., the maximum temperature on the outer surface of top ceramic coating) are set to be 1000, 1100, 1300 and 1400 °C. Totally a maximum of 50 thermal cycles are conducted in each working condition to predict the location where the first damage occurs. The tensile strength of top ceramic coating is 117 MPa [35]. Fig. 12 shows that, under different working temperatures, the predicted thermal cycles of failure emerge in top ceramic coating. It is found out that the dangerous regions are basically the same as that mentioned in Section . Locations A to C are the regions of stress concentration, where failure would take place. When the working temperature is equal to or less than 1100 °C, top ceramic coating is of low stress level and its maximum residual stress is smaller than the fracture strength after 50 thermal cycles. With the increase of working temperatures, stress in top ceramic coating increases. When the working temperature reaches 1200 °C at the 30th thermal cycle, stress at location A (at the top of pressure side) exceeds 117 MPa, i.e., damage occurs at location A. When the working temperatures are 1300 and 1400 °C, damage occurs at location A at the 19th and 14th thermal cycles, respectively.
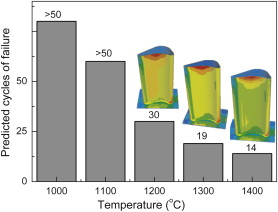 | Fig. 12. Predicted thermal cycles of failure that emerges in top ceramic coat under different working temperatures. |
In this paper, a three-dimensional finite element model of a turbine blade with TBCs has been established by ABAQUS and CATIA software, and then its thermal fatigue behavior has been investigated. The following important conclusions have been obtained:
(1) The thermal barrier effect on a turbine blade with TBCs and one cooling channel is not uniform. The maximal and minimal thermal barrier temperatures are 387 °C at suction or pressure side and 262 °C in the trailing edge region, respectively. That is, the thermal barrier effect of TBCs with a narrow and small cooling channel is weak. Therefore, a cooling system of a turbine blade should be designed with multi-cooling channels.
(2) Due to the non-uniform distribution of displacement, strain and stress in TBCs, the regions located at the top, bottom of suction or pressure sides tend to produce a maximum of displacement, with the occurrence of a bigger strain or stress, where sub-critical cracks preferentially form.
(3) According to the maximum tensile stress criterion, dangerous regions of a turbine blade with TBCs can be predicted. These dangerous regions mainly locate at the chamfer of blade body and rabbet, which are consistent with the experimental observations.
This work was supported by the National Natural Science Foundation of China (Nos. 11002122, 51172192, 11272275 and 11002121), the Natural Science Foundation of Hunan Province, China (No. 11JJ4003) and the Key Project of Scientific Research Conditions in Hunan Province, China (No. 2012TT2040).
| 1. |
|
| 2. |
|
| 3. |
|
| 4. |
|
| 5. |
|
| 6. |
|
| 7. |
|
| 8. |
|
| 9. |
|
| 10. |
|
| 11. |
|
| 12. |
|
| 13. |
|
| 14. |
|
| 15. |
|
| 16. |
|
| 17. |
|
| 18. |
|
| 19. |
|
| 20. |
|
| 21. |
|
| 22. |
|
| 23. |
|
| 24. |
|
| 25. |
|
| 26. |
|
| 27. |
|
| 28. | [Cited within: 1] |
| 29. |
|
| 30. |
|
| 31. |
|
| 32. |
|
| 33. |
|
| 34. |
|
| 35. |
|