

Crystallization of Al-based Amorphous Alloys in Good Conductivity Solution
[Yonggang Wang1 , Yan Liu1 , Yingjie Li1 , Bang An1 , Guanghui Cao2 , Shifeng Jin3 , Yimin Sun1 , Weimin Wang1  ]
]
]
|
|


The corrosion-induced crystallization of Al94- xNi xGd6 ( x = 6 and 10, in at.%) metallic glasses as well as phase separation, oxidation and cracking in good conductivity solution has been investigated by various techniques. The transmission electronic microscopy (TEM) result reveals that crystalline intermetallics and oxides present on the electrochemically thinned hole edge, and the phase separation occurs in the matrix of the as-spun ribbons with the circumferential speed Rc of 29.3 m/s. In addition, the bending and cracking of the samples occur after corrosion. The influence of Ni content on the phase separation, bending and cracking can be explained by the fact that the percolation of the backbone clusters in the amorphous alloy melts and glasses is enhanced by increasing the composition of Ni.
Lightweight Al-rare-earth-transition metal (Al-RE-TM) metallic glasses with Al concentrations above 80 at.% typically have good corrosion resistance, high yield strength and other key properties that make them interesting for potential structural applications[1], [2] and [3]. Gao et al. found that when the temperature is approaching the glass transition temperature under annealing, the Al-based metallic glasses will crystallize to reduce the total free energy for the system with the presence of medium-range Al clusters in the as-spun samples[4]. The tensile strength can be further enhanced when the alloys are partially crystallized to precipitate nanometer-sized Al crystals[5]. Although people have reported that the stability of the Al-based amorphous phase as well as the pathway of crystallization is sensitive to the composition of these alloys[6], i.e. the addition of Ni[7] and [8] and Si[9] can improve the stability of the Al-based glassy alloys; the substitution for Ni by Co can worsen the glass forming ability (GFA)[9], there is still lacking of an understanding of the underlying processes. It is reported that if the annealing process leads to a phase separation into Al-rich and solute-rich amorphous regions, crystallization appears to be preceded for Al88Gd6La2Ni4[10]. It is known that the earlier investigations have focused on the phase separation and crystallization during the annealing process of the amorphous alloys[11], [12] and [13]. There is little work devoted to uncovering the corrosion-induced crystallization of Al-based amorphous alloys.
The desirable properties of metallic glasses, such as superior specific strength, large ductility in bending, low coefficient of friction, high hardness and high resistance to corrosion, oxidation and wear are closely associated with the internal stress[14] and [15]. By dealloying the amorphous alloys, the selective dissolution of elements can introduce stress to the matrix and trigger the cracks[16] and [17]. Meantime, internal stress can lead to the elastic deformation of the samples, which will definitely decrease the service life of the products[18]. Cai et al. have reported that the stretched ribbons of Cu50Zr40Ti10 metallic glass generate the corrosion cracks more easily than the as-quenched one[19]. Therefore, it is valuable to explore the effect of internal stress on the cracking or embrittlement of the metallic glasses.
In our earlier works, we have found that a shoulder peak in X-ray diffraction (XRD) pattern of as-spun Al-Ni-Gd glassy alloys is associated with the strong Al-Ni (Gd) bonds[8]. The predominant atomic pair plays a governing role in the frame of amorphous structure[20], i.e. the backbone clusters in Al-Ni-Gd glassy alloys[10]. The microstructure of a glassy alloy should determine its corrosion behavior[21], which is closely related to the forming of the passivation film[22] and the segregation of beneficial alloying elements due to partial crystallization[23]. Meantime, it is reported that the minor addition of Ni can increase the strength and corrosion resistance of the Fe-based metallic glass[24], which indicates that the corrosion of metallic alloys is strongly influenced by the alloying elements as well as by their microstructure. The nanoscale pit initiation events are sensitive to the heterogeneities of the Al-based metallic glasses[25]. Hence, it is valuable to study the relationship between the backbone clusters and the corrosion behavior of the Al-based glassy alloys.
Accordingly, this work intends to investigate the mechanism of corrosion-induced crystallization, phase separation, oxidation, cracking and structure character of Al-Ni-Gd glassy alloys in good conductivity solution by electropolishing, electrochemical test and immersion corrosion. We try to explain the involving results with the backbone clusters argument in the present glassy alloys.
The ingots of Al94-xNixGd6 (x = 6 and 10) glassy alloy used in this work were obtained by induction-melting the mixture of pure Al, Ni and Gd ingots (purity > 99.5 wt%) in the air. The Al94-xNixGd6 (x = 6 and 10) ribbons were prepared by a single-roller melt-spinning technique in argon atmosphere. The diameter of the copper roller is 35 cm, and the circumferential speed Rc is 29.3 and 25.6 m/s. The ribbons are about 20-40 μ m in thickness and 2-3 mm in width.
The glassy structure of the specimens was investigated by high energy powder X-ray diffraction (PXRD) at room temperature using a PANalytical X'Pert PRO diffractometer equipped with a graphite monochromator in a reflection mode (2θ : 10° -80° , step: 0.017° and scan speed: 5 s/step) utilizing CuKα radiation (40 kV, 40 mA).
Transmission electron microscopy (TEM, JEM-2100) was used to study the structure of the Al94-xNixGd6 (x = 6 and 10) glassy alloy. Samples were investigated for TEM by electrochemical thinning only. A 26 vol.% nitric acid and 74 vol.% methanol electrolyte were used at approximately -25 ° C until a hole was formed. All the samples were checked at least three times to ensure the accuracy. Composition of the phases was obtained by energy dispersive X-ray spectrometry (EDS), which is available in conjunction with TEM.
Electrochemical measurements were carried out by using a typical three-electrode system: working electrode, platinum counter electrode and Hg|Hg2Cl2 (SCE) reference electrode. As we all know, the solution chosen for the electropolishing is commonly regarded as the good conductivity solution and has a heavier corrosion behavior for the sample, so the electrolytes for the electrochemical test were chosen as 7 wt% HNO3 methanol solution. LK 2005A advanced electrochemical workstation was used for measuring the potentiodynamic polarization curves with a scanning rate of 5 mV/s at room temperature. Corroded ribbons were cleaned with ethanol and deionized water. All the electrochemical measurements were repeated at least three times, which showed a good reproducibility. For immersion experiments, the as-spun ribbons were immersed in 27 wt% methanol solution open to air at room temperature (about 298 K) for 120 h. The surface morphologies of the ribbons after polarization experiments and immersion experiments were examined by scanning electron microscopy (SEM, Hitachi S-570). The compositions of the corresponding regions were analyzed by energy dispersive spectroscopy (EDS).
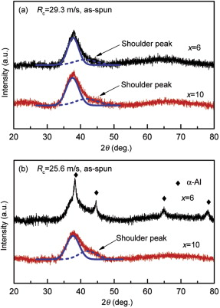
Prior to the corrosion studies, the microstructure of the ribbon pieces prepared from the specimens by single-roller melt-spinning has been checked in detail. Fig. 1 shows the XRD patterns of the as-spun Al94-xNixGd6 (x = 6 and 10, in at.%) samples with Rc of 29.3 and 25.6 m/s. For the ribbons spun with Rc of 29.3 m/s, a typical broad diffraction peak can be observed in the XRD patterns, which suggests that fully amorphous structure is formed under this circumferential speed. In the XRD patterns of samples with Rc of 25.6 m/s, several crystalline peaks can be found in the ribbon with the composition of Ni, cNi equal to 6 at.%, which are identified as α -Al phase, but are absent in the ribbon with cNi of 10 at.%. Apparently, those results confirm the argument that increasing cNi is helpful to improve the GFA of Al-based alloys [9] and the high cooling rate is beneficial to the increase in the amount of amorphous matrix. In addition, a shoulder diffraction peak is observed at about 2θ = 44° , which is often ascribed to the combined effects of strong interaction of Al-Ni bond [1] and [8] and pre-existed α -Al nuclei [26] in the glassy matrix.
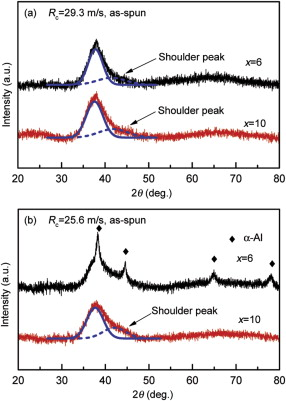 | Fig. 1 XRD patterns of the as-spun Al94-xNixGd6 (x = 6 and 10) samples with Rc of: (a) 29.3 m/s, (b) 25.6 m/s. |
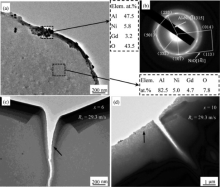
The TEM images and the corresponding selected area electron diffraction (SAED) patterns of the as-spun amorphous samples with Rc of 29.3 m/s are shown in Fig. 2. For the sample with cNi of 6 and 10 at.% just after electrochemical thinning, a layer of black precipitates is formed on the hole edge, and the image of the sample with cNi of 10 at% can be found in our earlier paper [8]. The compositions of the hole edge and internal matrix are also shown in the Fig. 2. For the sample with cNi of 10 at.%, the composition of the edge crystallites includes: cAl = 67.7 at.%, cNi = 11.2 at.%, cGd = 5.5 at.% and cO = 15.6 at.%, and the composition of the internal matrix is cAl = 77.5 at.%, cNi = 11.9 at.%, cGd = 7.9 at.% and cO = 2.7 at.%. The high ratios of cNi/cAl and cGd/cAl as well as high cO on the edge indicate that the crystalline phases are composed of intermetallics and oxides. The patterns in the corresponding SAED of Fig. 2(b) include Al4Ni3 and NiO (the others are not given in this paper). The types and percentages of the precipitates identified from 104 sets of measured SAED patterns are listed in Table 1. The results show that the oxides fraction decreases and the content of intermetallics increases with the addition of nickel, which indicates that increasing nickel is beneficial to improving the inoxidizability for the amorphous alloys and increasing the cohesion of the atoms.
 | Fig. 2 (a) Bright field TEM images of Al94exNixGd6 (x=6) ribbons with Rc of 29.3 m/s; (b) the corresponding selected area electron diffraction (SAED) patterns and the composition informations of the dashed boxes; (c) and (d) bright field TEM images of ribbons (Rc =9.3 m/s) with x of6 and 10, respectively. |
| Table 1 Types and percentages of oxides and intermetallic phases identified from the SAED patterns for Al94-xNixGd6 (x = 6 and 10) ribbons with Rc of 29.3 m/s |
In addition, the crack of the sample with cNi = 6 at.% fabricated after electrochemical thinning has a bending behavior ( Fig. 2(c)), which is seldom found near the crack with cNi = 10 at.% sample ( Fig. 2(d)), indicating that the low nickel content ribbon has a higher stress difference between the free and wheel side. The cracks are initiated by stress concentrated regions, i.e. starting from the thinned transparent edge of the electropolished hole. Meantime, there exist some round bright zones embedded in the matrix (denoted by the arrows) which are proven to be amorphous structure in our earlier works [8], and the amount of the bright zone increases with increasing cNi ( Fig. 2(c, d)). In several Al-RE-TM glasses, the contrast in the bright field image suggests the existence of phase separation [10] and [13].
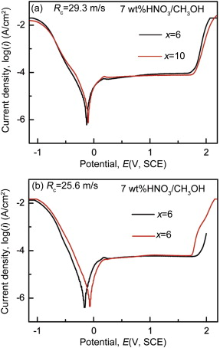
Fig. 3 gives the potentiodynamic polarization curves of Al94-xNixGd6 (x = 6 and 10) samples in 7 wt% HNO3 methanol solution with Rc of 29.3 and 25.6 m/s. The Al-Ni-Gd glasses exhibit an excellent spontaneous passivation behavior in good conductivity solution upon anodic polarization with a wide passive region. The involved electrochemical parameters such as corrosion potential (Ecorr), passive current density (ipass) and onset pitting potential (Espit) as well as their differences between samples with Rc of 29.3 and 25.6 m/s are listed in Table 2. In general, the more negative the corrosion potential, the lower the corrosion resistance. As shown in Fig. 3, ribbons with cNi of 6 at.% get a more negative corrosion potential than ribbons with cNi of 10 at.%, indicating that addition of Ni can defer the anodic reaction and improve the corrosion resistance for the present glassy alloys. As shown in Table 2, the change of the ipass and Espit for sample with cNi of 10 at.% spun with different cooling rates is small, suggesting that the addition of Ni can decrease the corrosion sensibility of the cooling rates and increase the structure homogeneity.
 | Fig. 3 Potentiometric polarization curves of Al94-xNixGd6 (x = 6 and 10) amorphous ribbons with different Rc in 7 wt% HNO3 methanol solution. |
| Table 2 Corrosion potential (Ecorr), passive current density (ipass), onset pitting potential (Espit) and corresponding standard deviation of these parameters of the Al94-xNixGd6 (x = 6 and 10) samples after electrochemistry corroded in 7 wt% HNO3 methanol solution |
Furthermore, SEM was employed to investigate the morphologies of the Al94-xNixGd6 (x = 6 and 10) glassy ribbons after polarization tests ( Fig. 4). After electrochemical corrosion some corrosion pitting holes appear on the surfaces of all four ribbons. For the sample with cNi of 6 at.%, the pit size of the sample with Rc of 25.6 m/s is much larger than that with Rc of 29.3 m/s. The pit size difference is more drastic than the sample with cNi of 10 at.%, indicating that the Rc sensitivity of the samples is weakened with increasing cNi. To understand the difference between the heavier corrosion pitting region and the film matrix, the EDS results are shown in Table 3. Here, the matrix film is denoted with F and the particles are denoted with P. The ratio of cNi/cAl is higher in the particle (near the pit region), which indicates that Ni atoms are more noble and have a better corrosion resistance. Meantime, the oxygen content of the film decreases with increasing cNi, which is consistent with the improvement of the inoxidizability of sample during the electrochemical thinning ( Fig. 2). However, the cO of particles in the ribbons with cNi of 10 at.% is slightly higher than that with cNi of 6 at.%.
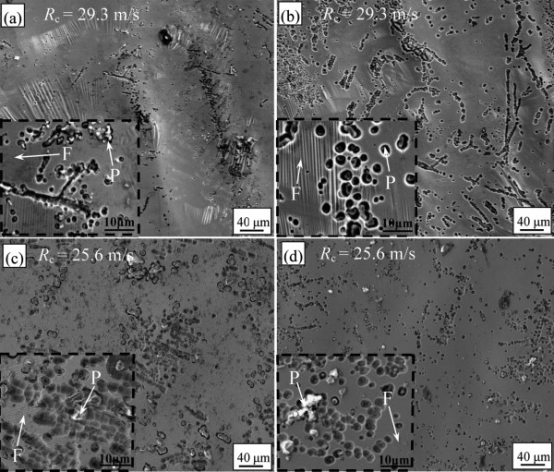 | Fig. 4 SEM micrographs of free surfaces of the Al94-xNixGd6 (x = 6 and 10) glassy ribbons by electrochemical corrosion in 7 wt% HNO3 methanol solution: (a) Rc = 29.3 m/s and x = 6; (b) Rc = 29.3 m/s and x = 10; (c) Rc = 25.6 m/s and x = 6; (d) Rc = 25.6 m/s and x = 10. The film matrix is labeled as F and the particles are labeled as P for the EDS region. |
| Table 3 Atomic fraction of elements on the surface of Al94-xNixGd6 (x = 6 and 10) glassy ribbons by EDS after electrochemistry corrosion |
To further investigate the corrosion behavior of Al94-xNixGd6 (x = 6 and 10) glassy alloys in the good conductivity solution without electrochemical potential, immersion experiment was performed. Fig. 5 shows the pictures and SEM images of the as-spun and immersed Al94-xNixGd6 (x = 6 and 10) glassy alloy specimens. The samples are immersed in 27 wt% HNO3 methanol solution for 120 h at room temperature, Fig. 5(a, c, e) shows the images of samples with Rc of 29.3 m/s and Fig. 5(b, d, f) displays the ones with Rc of 25.6 m/s. In the optical pictures ( Fig. 5(a, b)), the upper and lower ribbons are as-spun and immersed samples, respectively. In Fig. 5(a), cNi of left ribbons (1 and 2) and right ribbons (3 and 4) are 6 and 10 at.%, respectively. The bending degree of immersed ribbon with cNi of 6 at.% (ribbon 2) is severer than that with cNi of 10 at.% (ribbon 4). In Fig. 5(b), cNi of left ribbons (5 and 6) and right ones (7 and 8) are 6 and 10 at.%, respectively. Similarly, immersed ribbon 6 (cNi = 6 at.%) has a larger bending degree than ribbon 8 (cNi = 10 at.%). The bending behavior of ribbons may be explained by the different contraction degree induced by the internal corrosion stress between two sides of samples immersed in 27 wt% HNO3 methanol solution.
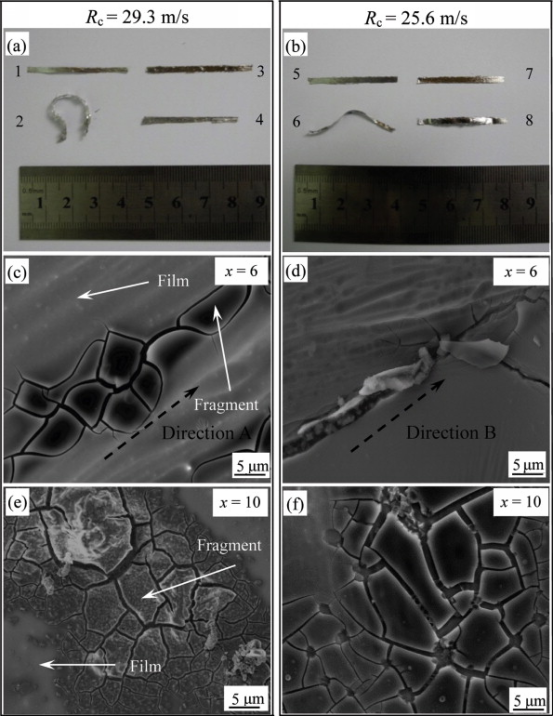 | Fig. 5 Optical pictures and SEM images of immersed Al94-xNixGd6 (x = 6 and 10) glassy ribbons in 27 wt% HNO3 methanol solution for 120 h. The cooling rates for the samples in left and right columns are 29.3 and 25.6 m/s, respectively. In optical picture with Rc of 29.3 m/s, ribbon 1, as-spun sample with x of 6; ribbon 2, immersed sample with x of 6; ribbon 3, as-spun sample with x of 10; and ribbon 4, immersed sample with x of 10. In optical picture with Rc of 25.6 m/s, ribbon 5, as-spun sample with x = 6; ribbon 6, immersed sample with x of 6; ribbon 7, as-spun sample with x of 10; and ribbon 8, immersed sample with x of 10. (c) and (d) SEM images of immersed samples with x of 6, (e) and (f) SEM images of samples with x of 10. Film denotes the film matrix, fragment denotes the heavy corrosion region. |
In SEM images, the morphologies of the immersed samples with cNi of 6 and 10 at.% are investigated ( Fig. 5(c-f)). With cNi of 6 at.%, cracks propagate preferentially along with the line directions A and B in Fig. 5(c, d), respectively. However, with cNi of 10 at.%, cracks propagate isotropically, indicating that increasing cNi can improve the homogeneity of the present glass alloys. To understand the effect of the heavier local corrosion, the EDS results of the fragment area and film are shown in Table 4, in which the local heavy corrosion region is labeled as “ Fragment” and the matrix film is labeled as “ Film” . Apparently, the oxygen content cO of fragment area of ribbons is higher than that of the matrix film, which is consistent with the electrochemical test ( Fig. 4 and Table 3). Moreover, the cO of the fragment area in the ribbon with cNi = 10 at.% is higher than that with cNi of 6 at.%, which is also consistent with the electrochemical test ( Table 3).
| Table 4 Atomic fraction of elements on the surface of Al94-xNixGd6 (x = 6 and 10) with Rc of 29.3 m/s glassy ribbons by EDS after immersion corrosion |
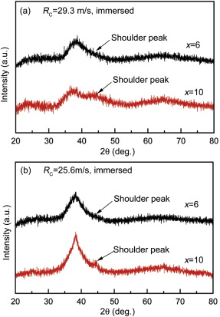
After being immersed in the nitric acid methanol solution for 120 h, the XRD patterns of the immersed samples are shown in Fig. 6. In contrast with the patterns of Fig. 1, the α -Al phase is corroded into the solution and all four samples appear in a fully amorphous structure. The broad main peak, generally corresponding to Al clusters, of the immersed ribbons is lower, and the shoulder peak, corresponding to Ni/Gd-rich clusters, is higher compared with the as-spun ribbons, implying that the aluminum clusters dissolve more quickly than Ni/Gd-rich clusters during the immersion test. The selective dissolution of elements/clusters can introduce the local stress to the sample and has a relationship with the cracking and bending in Fig. 5. Meanwhile, with increasing cNi, the shoulder peak increases after immersion test, showing a more typical phase separation phenomenon.
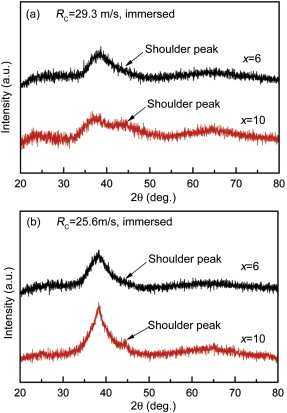 | Fig. 6 XRD patterns of the immersed Al94-xNixGd6 (x = 6 and 10) sample with: (a) Rc = 29.3 m/s, (b) 25.6 m/s. |
Kelton et al.[10] and Poon et al.[27] have proposed the backbone argument that the Ni/Gd-rich backbone clusters as well as Al inclusion clusters exist in the Al-Ni-Gd glassy alloys. They suggested that the bulk metallic glasses (BMGs) can be divided into MSL (majority atom-small atom-large atom) class and LS (large atom-small atom) class[27]. The atomic sizes of Al, Ni and Gd in the present Al-Ni-Gd alloy are 0.143, 0.124 and 0.180 nm, considered as M (majority), S (small) and L (large) size, respectively[28]. The interaction of the stress fields can lead to the formation of stable short-ranged ordered clusters of small (Ni) and large (Gd) atoms. The structure-reinforced network is called the backbone clusters. The small inclusion clusters are separated by the network structure[29]. It should be mentioned that the basic structural units of backbone clusters are solute centered quasi-equivalent clusters surrounded by Al atoms[30]. The backbone clusters are more stable and stronger than Al inclusion clusters[31]. Accordingly, it is expected that a higher cNi/cAl present in the severe corrosion zone after electrochemical thinning, polarization and immersion tests ( Fig. 2 and Table 3).
The percolation theory has been adopted to describe the mechanical and structural properties of several metallic glasses[31] and [32]. It is inferred that the mechanical properties may be changed discontinuously when the microstructural percolation is achieved[32]. Introducing particular solute species may promote the percolating backbone of short range orders in some glassy systems[31]. It is understood that, with Rc of 25.6 m/s, the Al precipitates appear in the sample with cNi of 6 at.%, but are absent in the sample with cNi of 10 at.% ( Fig. 1(b)). The sensitivity to the composition of the alloys could be dramatic due to the phase transition nature of a percolation, which has possibly mixed the discontinuous and continuous characters [33]. Increasing the cooling rate is another method to promote the percolation of the backbone clusters in the glass alloys [34]. It is expected that, with cNi of 6 at.%, the Al precipitates appear in the sample with Rc of 25.6 m/s, but absent in the sample with Rc of 29.3 m/s ( Fig. 1).
When a glassy alloy is electrochemically decomposed in the electrolyte, the noble metal atoms diffuse through the alloy surface to form new nuclei and grow to crystals[35]. During dealloying Al-Cu-Mg amorphous precursor alloys the selective dissolution of elements occurs and nanoporous crystal Cu is synthesized[36]. Our earlier ab initio molecular dynamic simulation on Al94-xNixGd6 (x = 6-12) amorphous alloys indicated that the Al-Ni and Al-Gd bonds are strong bonds [8]. Hence, it is expected that crystalline intermetallics Al4Ni3 and Al2Gd3 have remained in the sample after electrochemical thinning ( Fig. 2 and Table 1). The solvent aluminum is active in the Al-Ni-Gd glassy alloys in the annealing process and Al clusters in the melt have a lower stability than the Ni/Gd-rich clusters in the cooling process [4]. Therefore, it is expected that Al phase precipitates from the melt with cNi of 6 at.% at a low cooling rate of 25.6 m/s ( Fig. 1(b)). According to the resemblance between the glass state and the liquid state [37] and the fact that the aluminum is easier to be dissolved into the solution [8], it is understood that the α -Al peaks in XRD pattern of as-spun sample with cNi of 6 at.% and Rc of 25.6 m/s disappear after immersion test ( Fig. 1 and Fig. 6).
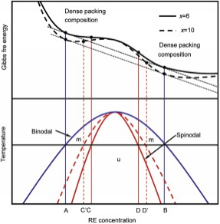
The phase separation prior to crystallization, forming Al-rich and solute-rich regions, has been found in Al88Gd6La2Ni4[10], Al85Ni5Y6Fe2Co2[13], Al-Fe-Y[3] and Al89Ni6La5[38] amorphous alloys. 3D-atomic probing technology (APT) investigation demonstrates the phase separation occurring in the Al-Fe-Y and Al-Ni-La metallic glasses, which have negative mixing enthalpies among their three binary subsystems[3] and [38]. As suggested first by Hume-Rothery and Anderson[39], in a region of composition beneficial to the development of short- and medium-range order involving five-fold symmetry, the G-curve dips, which makes the occurrence of eutectic be more likely. In metallic glasses, the eutectic composition is usually considered as the ideal composition to form the glass. According to Hume-Rothery and Anderson's hypothesis[39], a narrow miscibility gap may open near the composition corresponding to maximal atomic packing efficiency due to rapid dip in the Gibbs free energy curve[40]. The hypothetical form of the free energy curve and a metastable miscibility gap, including a spinodal region of amorphous phase separation, in Al-RE binary amorphous alloys can be presented by solid lines in Fig. 7[41]. Here, the second derivative of the free energy of mixing defines the spinodal points (C and D), which locate between the binodal points (A and B, which is defined as the first derivative of the Gibbs free energy). Above the binodal line, two liquids are miscible and the system is stable(s); below this line there is a metastable region (m), in which the system is stable to small fluctuations but is unstable to large fluctuations; below the spinodal line, the system is unstable[42]. In our earlier work[8], the electropolished as-spun Al84Ni10Gd6 amorphous ribbon formed white regions, which were still amorphous structure in the matrix; the corresponding SAED patterns showed an asymmetric halo of the amorphous structure, which may correspond to two overlapped diffraction peaks. The phase separation phenomenon is also confirmed by the XRD patterns of sample with cNi = 10 at.% after the immersion corrosion ( Fig. 6).
Increasing the content of nickel can widen the composition range of phase separation, which is shown schematically by the dashed line in Fig. 7. Considering the similar RE content of both alloys as well as Hume-Rothery and Anderson's hypothesis[39], we suppose that the binodal curve for x equal to 10 is overlapped by that with x of 6. Here, with increasing cNi, the backbone clusters are strengthened, leading to a heavier dip in the Gibbs free energy [41] and [43]. Accordingly, the spinodal region is wider and it is easier to perform the spinodal decomposition with a higher content of nickel. Hence, it is expected that the sample with cNi of 10 at.% undergoes a heavier phase separation after corrosion than that with cNi = 6 at.% ( Fig. 2 and Fig. 6). The composition range of phase separation locates always near/inside the optimized glass formation ranges, i.e. the more easily the phase separation occurs in a glass, the more difficultly the nucleation and growth of crystallites occur [41]. Hence, it is understood that the sample with cNi of 10 at.% has a heavier phase separation and a higher crystallization temperature than the counterpart with cNi of 6 at.% ( Fig. 2 and Fig. 6 and Table 3 in Ref. [8]).
'>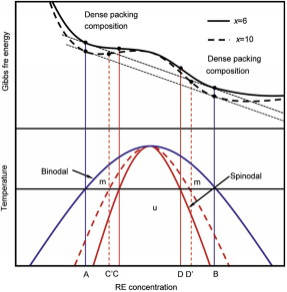 | Fig.7 Fig7 Schematic presentation of a hypothetical form of the free energy curve and a metastable miscibility gap in Al94-xNixGd6 (x = 6 and 10) amorphous alloys. A and B define binodal points, and the composition between C (C') and D (D') belong to a spinodal region. Above the binodal line, the liquid is stable. Below this line, there is a metastable region (m). Within the metastable region the system is stable to small fluctuations but is unstable to large fluctuations. Below the spinodal line, the system is unstable and easy to turn from one phase to two-phase system. |
Oxidation is an intrinsic phenomenon associated with the electropolishing method, especially for alloy systems containing highly reactive elements[8] and [44]. During the electropolishing, a range of clusters, from embryo clusters to clusters approaching the critical condition, and possibly oxidized clusters are present in the alloy's surface layer[45]. During the HCl/HF solution etching process, the relatively inert Cu atoms in Cu-Hf-Al glass are left and form Cu2O[16]. It is known that, the closer to the hole the zone is, the heavier etching degree it endures, and the larger stress it has. In our earlier work, the stress induced by autoclave and compression treatment can cause the crystallization of Al-Ni-La glass[34]. Meanwhile, the composition near the hole is far away from the ideal composition with a good GFA[46]. Hence, the crystallization and oxidation can emerge more easily on the edge, which has sustained heavier selective dissolution of elements, and it is understood that the ratios in cNi/cAl and cGd/cAl as well as cO in the crystallites are higher than those in matrix ( Fig. 2). Generally, Ni is a noble element and can increase the inoxidizability of the alloy. It is expected that with increasing cNi, the cO of the hole edge decreases, and the fractions and types of oxides also decrease ( Fig. 2 and Table 1).
Generally, the properties of a material are dependent on its microstructure. The physical and chemical properties of samples in the percolated state are apparently different from those in the unpercolated state[31] and [34]. As we have mentioned, increasing the cooling rate is a method to promote the percolation of the backbone clusters in the glass alloys. Hence, the corrosion potential Ecorr, passive current density ipass and onset pitting potential Espit of sample with cNi of 6 at.% under Rc of 29.3 m/s differ from those under Rc of 25.6 m/s; moreover, the difference degrees with cNi of 6 at.% are larger than those with cNi of 10 at.% ( Fig. 3 and Table 2).
Moreover, it is known that there is a cooling rate difference between the wheel and air side of as-spun ribbons, which can bring structure difference between both sides[47] and [48]. As mentioned above, the Rc sensibility of the sample with cNi of 6 at.% is higher than the sample with cNi of 10 at.% ( Fig. 1 and Fig. 3). In other words, the percolation of the backbone cluster in the air side (low cooling rate side) of sample with cNi of 6 at.% and Rc of 25.6 m/s is more easily destroyed (the corresponding crystalline precipitates with Rc of 29.3 m/s can be ignored in the XRD analysis due to the small amount), and structure difference between two sides is larger than that with cNi of 10 at.%. The wheel side usually has a higher cooling rate than the free side, leading to a higher amorphous fraction and free volume in the wheel side for the as-spun ribbons. When the ribbons sustain heavy corrosion, the contraction of the wheel side is larger than the free side and the effect of the contraction can surpass the original stress, resulting in a tensile stress on the wheel side and a compressive stress on the free side. After electrochemical thinning, the corrosion rate difference between the two sides with cNi of 6 at.% is much higher, inducing a larger compressive stress on the free side and a higher tensile stress on the wheel side compared with the sample with cNi of 10 at.%. Therefore, it is understood that the bending degree of the hole edge of electrochemical thinned sample with cNi of 6 at.% as well as the immersed sample is higher than with cNi of 10 at.% ( Fig. 2 and Fig. 5).
As mentioned above, the minor Ni addition can not only enhance the structural and chemical homogeneity by promoting glass formability, but also enhance the percolation of backbone structures in the present glass. Meanwhile, Ni is more noble than Al and Gd[8], and it is expected that the Ecorr of the sample with cNi of 10 at.% is higher than that with cNi of 6 at.% ( Fig. 3 and Table 2) and that the oxygen content of the film region decreases with the addition of nickel ( Table 3 and Table 4).
In addition, the shear localization and strain rate independence appear to be robust features of the samples, in which a backbone of atoms percolates through the material[49]. In the cracking position of sample with cNi of 10 at.%, a higher threshold stress should be surpassed to trigger the localized corrosion; in other words, a higher internal stress exists in the fragment area of sample with cNi of 10 at.% than that with cNi of 6 at.%. It should be noted that the internal stress near the fragment area is completely different from the tensile stress on the wheel side owing to a quicker cooling rate than that of the air side. The latter is global stress and the former is much localized. In addition, the phase separation can embrittle the sample [50], and the phase separation of sample with cNi of 10 at.% is heavier than that with cNi of 6 at.%. Accordingly, it is understood that the crack in the immersed sample with cNi of 10 at.% is more developed than that with cNi of 6 at.% ( Fig. 5). The accumulated highly localized stress is beneficial to the crystallization and coupled with oxidation [51]. It is explained that a higher oxygen content presents in the particles near the pits of the electrochemical polarized and in the fragment area of the immersed samples with cNi of 10 at.% compared with that with cNi of 6 at.% ( Table 3 and Table 4). We have to mention that the discrepancy of cO between the TEM and SEM samples is mainly due to the checking area of TEM investigation (100 nm) is much smaller than that in SEM test (10 μ m), resulting in a larger error of the TEM sample.
(1)Crystallization of Al-Ni-Gd glassy alloys as well as the phase separation and oxidation occurs during the electrochemical corrosion process and immersion test in good conductivity nitric acid/methanol solution.
(2)Bending and cracking of the present Al-based amorphous samples after corrosion are ascribed to the microstructure heterogeneity induced by different cooling rates as well as the embrittlement during the crystallization, respectively.
(3)The influence of Ni content on the crystallization, phase separation, bending and cracking behavior can be explained by the fact that the percolation of the backbone clusters in the amorphous alloy melts and glasses is enhanced by increasing cNi.
The authors have declared that no competing interests exist.
| [1] |
|
| [2] |
|
| [3] |
|
| [4] |
|
| [5] |
|
| [6] |
|
| [7] |
|
| [8] |
|
| [9] |
|
| [10] |
|
| [11] |
|
| [12] |
|
| [13] |
|
| [14] |
|
| [15] |
|
| [16] |
|
| [17] |
|
| [18] |
|
| [19] |
|
| [20] |
|
| [21] |
|
| [22] |
|
| [23] |
|
| [24] |
|
| [25] |
|
| [26] |
|
| [27] |
|
| [28] |
|
| [29] |
|
| [30] |
|
| [31] |
|
| [32] |
|
| [33] |
|
| [34] |
|
| [35] |
|
| [36] |
|
| [37] |
|
| [38] |
|
| [39] |
|
| [40] |
|
| [41] |
|
| [42] |
|
| [43] |
|
| [44] |
|
| [45] |
|
| [46] |
|
| [47] |
|
| [48] |
|
| [49] |
|
| [50] |
|
| [51] |
|