
Influence of Shear Banding on the Formation of Brass-type Textures in Polycrystalline fcc Metals with Low Stacking Fault Energy
[Yan Haile1 , Zhao Xiang1 , Jia Nan1, *  , Zheng Yiran
1 , He Tong2 ]
, Zheng Yiran|
|


Texture evolution in nickel, copper and α-brass that are representative of face-centered-cubic (fcc) materials with different stacking fault energy (SFE) during cold rolling was systematically investigated. X-ray diffraction, scanning electron microscopy and electron backscatter diffraction techniques were employed to characterize microstructures and local orientation distributions of specimens at different thickness reductions. Besides, Taylor and Schmid factors of the {111} <110> slip systems and {111} <112> twin systems for some typical orientations were utilized to explore the relationship between texture evolution and deformation microstructures. It was found that in fcc metals with low SFE at large deformations, the copper-oriented grains rotated around the <110> crystallographic axis through the brass-R orientation to the Goss orientation, and finally toward the brass orientation. The initiation of shear banding was the dominant mechanism for the above-mentioned texture transition.
Texture is a common phenomenon in crystalline materials. It is closely linked to mechanical behaviors, physical and chemical properties of materials, and is associated with the performance in their production processing and follow-up engineering applications. Hence, an accurate understanding of deformation mechanisms together with precise control of texture evolution becomes a prerequisite for developing new materials [1]. As for face-centered-cubic (fcc) materials with high or medium stacking fault energy (SFE), grains tend to rotate toward the copper-type textures (inclusive of the {112} <111> and {123} <634> orientations) with increasing deformation, and dislocation slip has been identified as the dominant deformation mechanism during the whole deformation stage [2], [3] and [4]. For materials with low SFE, the copper-oriented grains also aggregate at an early stage of deformation. However, with increasing loading these grains then rotate to the brass-type textures (inclusive of the {110} <112> and {110} <100> orientations) and the latter dominates in the final textures at large deformations [5], [6] and [7].
Numerous efforts have been made to understand the texture evolution in low SFE fcc metals at large deformations [8] and [9]. According to the research on cold-rolled α-brass by Wassermann et al. [10], twinning of {112} <111> (copper) oriented materials introduces the twin orientation {552} <115> (copperT), and then, the copperT-oriented grains rotate toward the {110} <112> orientation (brass) by dislocation slip. However, Duggan et al. [11] clarified that the total volume fraction of twin is less than 25%. Therefore, the limited twin volume is not sufficient to change the texture type completely. Based on the study of microstructure for α-brass at large thickness reductions, shear bands are proposed to induce the significant texture change from the copper-type to the brass-type after the formation of the fine matrix-twin lamellar structure [11]. Besides, Hirsch et al. [8] and [12] developed a physical model by proposing that, at small deformations the copperT-oriented grains which are developed by mechanical twinning rotate to the intermediate orientation of {111} <112> (brass-R), then, the brass-R grains rotate to the Goss orientation through the process of shear banding deformation. In addition, a series of researches on low SFE fcc single crystals initially oriented with copper have been conducted by Paul et al. [13] and [14]. It is suggested that two coplanar slip systems that are adjusted by the initiation of shear banding play an important role in the formation of the brass-type textures.
For the simulation of deformation textures in low SFE fcc metals, so far only a few studies have addressed incorporating shear band theory. A numerical study by Gill Sevillano et al. [15] concluded that shear bands in rolled fcc materials with low SFE do not play a significant role in the texture evolution. On the contrary, Kalidindi [16] conducted numerical simulations by introducing a specified shear component stemming from shear bands into the velocity gradient tensor for grains whose twin volume fraction reaches a critical value. He suggested that the mechanism of shear banding contributed to the copper-to-brass type texture transition. Therefore, although extensive studies in both experiments and simulations have been made [17] and [18], the mechanism of texture evolution in low SFE fcc metals at large deformations are still not clear.
In the present study, new features about the α fiber ( Φ = 45°, φ2 = 90°) and the τ fiber ( φ1 = 90°, φ2 = 45°) in the Euler space for fcc materials with different SFEs are studied. In order to explore the relationship between texture evolution and deformation mechanisms composing of dislocation slip, twinning and shear banding in metals with low SFE, the microstructures and local orientation distributions of the metals at different deformation stages were characterized by using EBSD techniques. Moreover, Taylor and Schmid factors for some typical orientations under plain strain state (cold-rolling) were analyzed [19] and [20]. This study provides an unambiguous understanding on the micromechanics of texture evolution in fcc metals with low SFE as well as a guidance for developing the relevant materials, such as austenitic stainless steels [21], [22] and [23] and twinning-induced plasticity (TWIP) [24], [25] and [26] steels incorporating fcc phases.
Pure nickel (99.99%), copper (99.99%) and α-brass (Cu–32%Zn) were selected as the studied materials in this work. They represent fcc materials with high, medium and low stacking fault energy (SFE), respectively. All the metals were firstly cross-rolled to a total reduction of 30% and heat treated to provide equiaxed microstructures with an average grain of about 30 μm [11], which were taken as the initial states of the materials. Then, the materials were symmetrically rolled at room temperature to different thickness reductions: 20%, 40%, 80% and 98%. The rolling processes were divided into many steps, so as to ensure homogeneous deformation and to avoid generating a large quantity of heat in each step. The {111}, {200} and {220} pole figures for the three materials with various reductions were measured by the laboratory X-ray diffraction (XRD) technique with a radiation of Cu Kα in reflection geometry. Then, crystallographic orientation distribution functions (ODFs) for the materials were determined from their respective pole figures by using the LaboTex texture analysis software [28]. The notation of { hkl} < uvw> was used for characterizing the texture type with { hkl}||ND and < uvw>||RD, where RD represented the rolling direction and ND denoted the normal direction of the rolled plates. The microstructures and orientations of α-brass at various deformation stages were characterized by employing the electron backscatter diffraction (EBSD) technique on the longitudinal section of each sample containing RD and ND. In order to obtain EBSD patterns of good quality, it is important to remove the residual deformation in the surface layer of specimens. The investigated surfaces (the longitudinal sections) were first mechanically ground and polished. Subsequently, electro-polishing was carried out for the flat surfaces in a solution of 20% phosphoric acid (H3PO4), 20% ethanol (C2H5OH), 10% 1-propanol (CH3CH2CH2OH) and 1% urea ((NH2)2OH) in volume at 20 °C, with the voltage of 15 V for 25 s. The EBSD mapping was performed in a field emission gun scanning electron microscope (JEOL JSM 7001F) with EBSD acquisition camera and channel 5 software. Beam control mode was used to acquire the Kikuchi pseudo-bands from crystals. An acquisition step of 0.02 μm was applied for the 80% and 98% deformed specimens and for other specimens a step size of 0.2 μm was used.
Taylor factors and Schmid factors for some typical orientations under plain strain state were calculated. In this study, the Taylor factors for the studied orientations were obtained by the full constraints Taylor model [19] and [27]. Besides, the Schmid factors for the twelve {111} <110> slip systems under plain strain state were computed for the typical orientations. Then, the maximum among the absolute values of the different systems was selected as the Schmid factor of each orientation. Using the same method, we obtained the Schmid factor for the {111} <112> twin systems of each grain orientation [20].
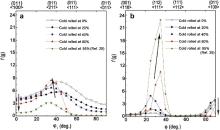
It is known that orientations along the α and τ fibers contain all the typical orientations in deformed fcc materials. Namely, the α fiber consists of the {011} <100> (Goss) and {011} <211> (brass) orientations, while the {112} <111> (copper), {111} <112> (brass-R) and Goss orientations are included in the τ fiber. The orientation density distributions along the both fibers for nickel, copper and α-brass are displayed in Fig. 1, Fig. 2 and Fig. 3, respectively.
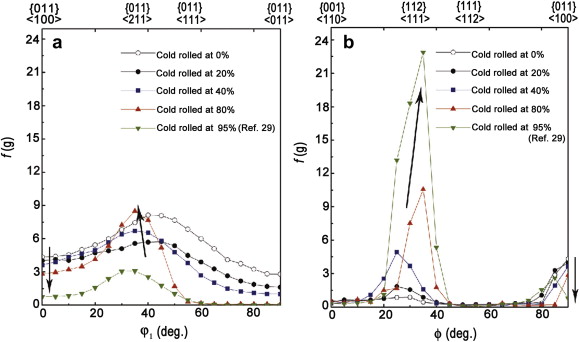 | Fig. 1. Texture evolution of nickel with rolling reduction in α and τ fiber representation: (a) α fiber with constant Euler angles Φ = 45° and φ2 = 0°, (b) τ fiber with constant Euler angles φ1 = 90° and φ2 = 45°. The data set at 95% deformation is obtained from Ref. [29] for nickel with the same initial microstructure as in this work. |
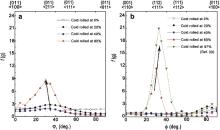
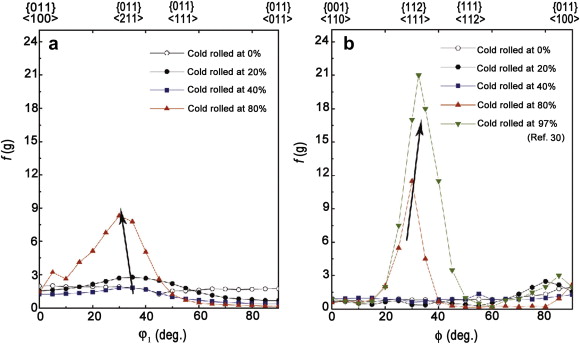 | Fig. 2. Texture evolution of copper with rolling reduction in α and τ fiber representation: (a) α fiber with constant Euler angles Φ = 45° and φ2 = 0°, (b) τ fiber with constant Euler angles φ1 = 90° and φ2 = 45°. The data set at 97% deformation is obtained from Ref. [30] for copper with the same initial microstructure as in this work. |
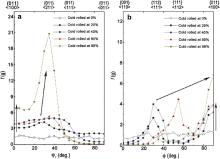
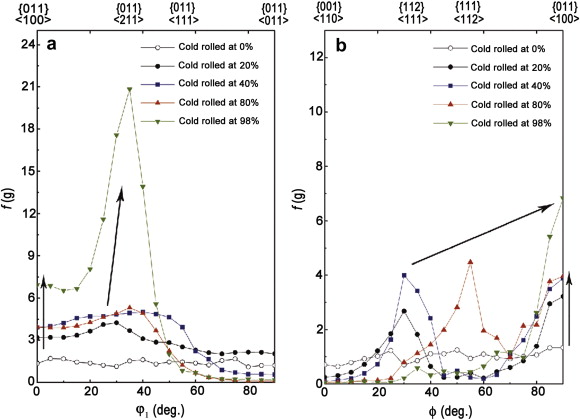 | Fig. 3. Texture evolution of α-brass with rolling reduction in α and τ fiber representation: (a) α fiber with constant Euler angles Φ = 45° and φ2 = 0°, (b) τ fiber with constant Euler angles φ1 = 90° and φ2 = 45°. |
At 20% thickness reduction, the copper, brass and Goss textures are the dominant texture components in nickel ( Fig. 1). When deformation is within the range of 20% and 80%, the brass component shows an increasing trend with increasing external loading. On the contrast, when the deformation reaches 95% [29], the intensity of the brass components is relatively small. It can be attributed to the rapid development of the copper component at higher reductions, as shown in Fig. 1(b). Besides, the position corresponding to the strongest peak in the α fibers at different deformations, is located close to the ideal peak position of the brass orientation ( φ1 = 35°, Φ = 45°, φ2 = 0°) through a way of “moving left”, as marked by an arrow in Fig. 1(a). The as-received nickel shows a strong α fiber texture under 0% cold-rolled reduction, which can be attributed to the preprocessing by cross rolling for the material. However, during the subsequent mechanical processing the initial textures do not change the evolution tendency of major texture components (texture type). The intensity of the copper component monotonously rises during the whole deformation stages, and it dominates over all the other textures at 95% thickness reduction [29]. Moreover, the strongest peak positions of the copper texture component with increasing deformation, are located close to the ideal peak position of the copper orientation ( φ1 = 90°, Φ = 35°, φ2 = 45°) through a way of “moving right”, as displayed by an arrow in Fig. 1(b). In addition, a monotonously decreasing tendency for the Goss component with further deformation is also identified in both α and τ fibers.
Fiber textures in copper during deformation are displayed in Fig. 2. The texture change with decreasing SFE can be found by comparing Fig. 2 and Fig. 1. The same evolution tendency for the copper, brass and Goss texture components with increasing rolling reductions are observed in both metals. In addition, the change of orientation intensity at the initial deformation stage (below 40%) is relatively small in copper.
The dominant texture components in α-brass are consistent with those in nickel and copper, as displayed in Fig. 3. Besides, the {111} <112> (brass-R) orientation is also identified at 80% thickness reduction. The intensity of the brass component shows an increasing tendency during deformation, and their strongest peak positions in the α fiber are located close to the ideal peak position for the brass orientation through a way of “moving right”, as marked by an arrow in Fig. 3(a). Moreover, an increasing tendency for the Goss component during deformation is also observed. Besides, an interesting observation is that the copper component firstly displays an increasing tendency and then decreases with deformation. At 40% reduction, the intensity of the copper component reaches the maximum value. Furthermore, the strongest peak positions in τ fibers at different deformation stages display a “moving right” tendency. As shown in Fig. 3(b), the strongest peak positions in the τ fibers move from the copper orientation (at 20% and 40% thickness reductions), through the brass-R orientation (at 80% thickness reduction) to the Goss orientation (at 98% thickness reduction).
The distributions for band contrast (BC) and inverse pole figure (IPF) parameters for α-brass at various thickness reductions were obtained from the post-processing of the EBSD data, as displayed in Fig. 4. Since the BC parameter describes the quality of electron backscatter diffraction patterns, qualitative description of the strain distribution in the microstructures can be obtained from that parameter [31]. The IPF parameter is utilized to present the local orientation distributions for metals.
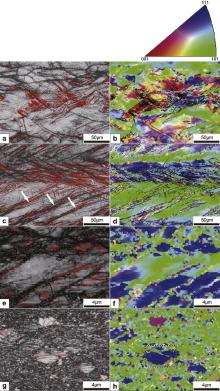
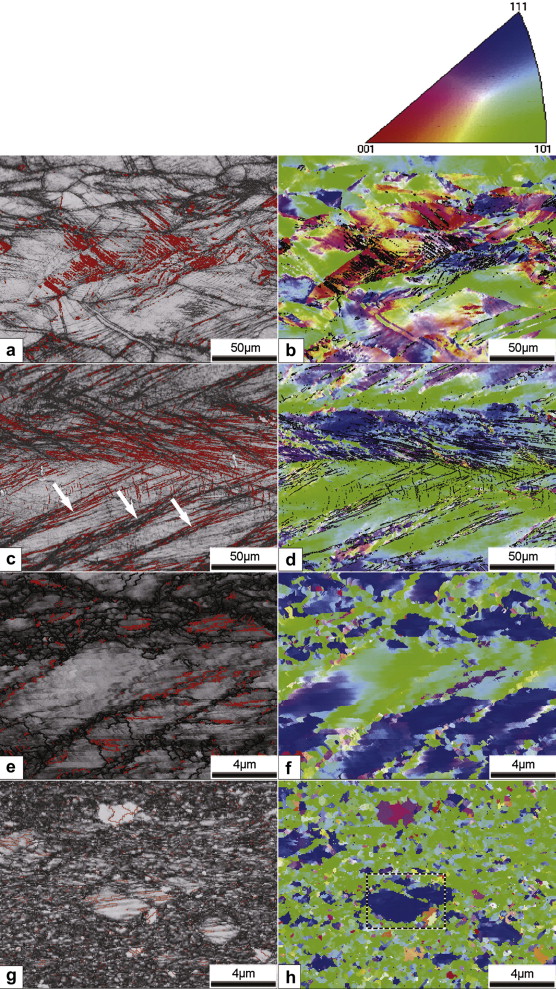 | Fig. 4. Band contrast maps and orientation distribution maps obtained from EBSD analysis for α-brass at various thickness reductions. The red lines in the left figures and the black portion in the right figures represent the Σ3-type twin boundaries. (a) and (b) 20% thickness reduction, (c) and (d) 40% thickness reduction, (e) and (f) 80% thickness reduction, (g) and (h) 98% thickness reduction. |
At 20% reduction, the elongation of grains along the rolling direction can be observed. Besides, some red lines that are denoted as the Σ3-type twin boundaries are identified ( Fig. 4(a)). Thus, it is clear that {111} <112> twin systems have been activated in the interior of some grains at this stage. In addition, some parallel fine traces are also identified in the interior of most grains. It is obvious that they are not twin boundaries but slip traces on the {111} planes. The discrepancy in color within each individual grain is clearly identified in the orientation mapping, as shown in Fig. 4(b), which indicates the development of local misorientations arising from dislocation accumulation near grain boundaries. Then, it can be proved that dislocation slip is the dominant mechanism at this thickness reduction.
When the thickness reduction reaches 40%, higher dislocation density is found in some of areas within α-brass, as marked by arrows in Fig. 4(c). This observation has been reported in many copper-rich alloys and is commonly denoted as shear bands. Besides, the shear bands are inclined to RD of 30°–40° angle. By comparing the orientation mapping ( Fig. 4(d)) with its corresponding microstructure ( Fig. 4(c)), it is inferred that the twin-matrix layers are mainly with the {111} orientation and the shear band regions are of the lattice plane {110}. When 80% deformation is reached, the twin boundaries turn to be aligned along RD. Moreover, shear bands are extensively found in the microstructure, especially on the upper half portion of the investigated area ( Fig. 4(e)). It was also found that two sets of bands intersect with each other in the interior of some grains and divide these grains into several portions. At 98% thickness reduction, most of the areas are covered with shear bands. The grains are severely refined because of the initiation of shear bands in different directions. It is worth pointing out that these areas are mainly located on the {110} lattice plane, as shown in Fig. 4(h). In addition, just a few large grains are retained. In these grains the {111} orientation is identified, thus the formation of the dynamic-recrystallized crystals at the very large deformations can be excluded [32].
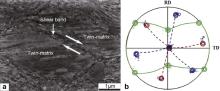
Microstructure of a special region in the 98% deformed sample as marked in the rectangular box in Fig. 4(h), i.e. a retained grain and shear bands, is shown in Fig. 5(a). By combining the microstructure and orientation distribution, it is clear that the green and blue colors in Fig. 4(h) represent the shear banding and the matrix regions, respectively. The shear band that generated by shearing among neighboring grains is detected in the interior of the lamellar structure ( Fig. 5(a)). Consistent results have also been obtained from the investigation of deformed Cu–Al alloys with low SFE [33]. The orientation characteristics of this region is depicted by the {111} pole figure ( Fig. 5(b)). The orientations in the shear band regions are also displayed using green color. Besides, two orientations represented by blue and red in the pole figure are included in the lamellar microstructure (also represented in blue in Fig. 4(h)). Based on the analysis of the {111} pole figure, it is clear that the shear banding regions are with the {110} <001> (Goss) orientation. This result is consistent with the analysis that the shear banding regions are with the lattice plane {110}, as shown in Fig. 4. Besides, the Miller indices of the orientations represented in blue and red are (111) [2–31] and (111) [–1–23], respectively, and they satisfy the relationship of twinning. Then, the lamellar microstructure can be identified as the twin-matrix layers. Since the number of pole points for the blue-color represented orientation is much more than that for the red-color represented orientation in the pole figure, it is inferred that the orientations represented in blue and red are from the matrix and twin areas, respectively. Accordingly, it is concluded that the shear band is generated in the interior of twin-matrix layers. Consistent results have also been found in the plane strain compressed fcc single crystals [15] and [16].
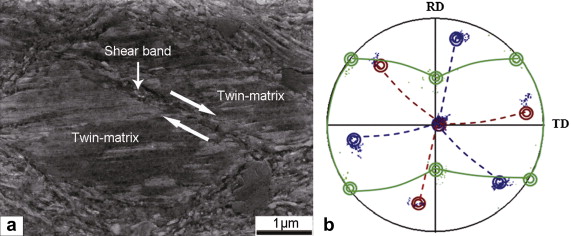 | Fig. 5. Microstructure and orientation characteristics of special regions in α-brass at 98% thickness reduction: (a) SEM photograph, (b) {111} pole figure obtained from the complete area in (a). |
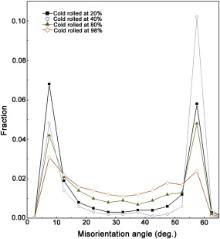
The distributions of misorientation angles across grain boundaries in α-brass at different stages of deformation are displayed in Fig. 6. It is obvious that the low angle boundaries (misorientation angle < 10°) and the Σ3-type twin boundaries (misorientation angle = 60°) are the most important components at 20% and 40% deformations. Plenty of low angle boundaries are responsible for dislocations slip in the interior of grains. Besides, some Σ3-type boundaries reveal that twins have been generated inside grains. As deformation proceeds, the fraction of low angle boundary decreases, whereas the fraction of Σ3 twin boundary increases significantly and reaches ∼10% at 40% deformation. The prominent increasing tendency for Σ3 twin boundary indicates that the twin systems are extensively activated and twinning promotes the plastic deformation at this stage. When the thickness reduction reaches 80%, fractions of the both low angle boundary and Σ3 twin boundary decrease. On the contrast, an increasing tendency for other high angle boundaries (10° ≤ misorientation angle < 55°) is observed. These can be attributed to the increasing fraction of the fine grains that are subdivided by two sets of shear bands intersecting with each other in the interior of some grains. At 98% reduction, the fraction of the low angle boundaries and the Σ3-type twin boundary further decreases, while the fraction of the high angle boundaries increases continuously. As a result, the distributions of grain boundaries are more homogeneous at this deformation stage.
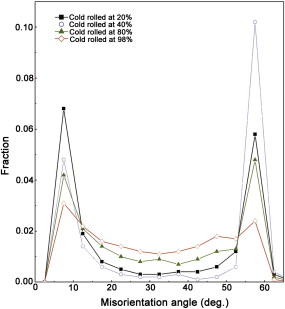 | Fig. 6. Distribution of grain boundaries represented by relative frequency as a function of misorientation angle for α-brass at different thickness reductions. |
The ideal positions of the α and τ fibers, as well as some typical orientations of fcc material in Cartesian coordinate are displayed in Fig. 7. According to the above results, it is clear that the texture evolution during cold rolling is almost identical for nickel and copper. Both the copper-type and brass-type textures are the main textures at the whole deformation stages. At larger deformations, the intensity of the copper texture is stronger than that of the brass texture. Besides, the both textures move toward their respective ideal positions as shown in the fiber plots. These can be achieved through the path I along τ fiber, as presented in Fig. 7, and lead to the aggregation of the copper-oriented grains at the most. In addition, the grains display a tendency of rotation toward the ideal brass orientation with increasing deformation in both nickel and copper, which can be achieved through the path IV along α fiber. This results in the enhancing of the brass-type textures. On the other hand, for the fcc materials with low SFE (α-brass), the copper texture dominates over all the other components in τ fiber and shows an increasing tendency at the initial deformation stage, as shown in Fig. 3(b) when the thickness reduction is below 40%.
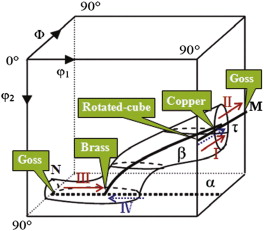 | Fig. 7. Diagram showing ideal positions of α and τ fibers and some typical orientations of fcc materials in Cartesian coordinate. The axes are labeled in Bunge convention. |
As deformation proceeds, the peak positions in the τ fiber show a tendency of “moving right” and this can be achieved through the path II along τ fiber ( Fig. 7). The τ fiber represents a series of orientations which can transform into each other by rotation around the <110> crystallographic axis. Consequently, it can be inferred that the copper-oriented grains rotate around the <110> axis, through the brass-R orientation, toward the Goss orientation. Thus, the intensity of the copper texture component shows an increasing tendency firstly (below 40%), and subsequently decreases with further deformation. The Goss texture intensity displays a monotonically increasing tendency throughout the whole period of deformation. In addition, the grain orientations are located close to the ideal position of the brass orientation by the way of “moving right” in the α fiber (the path III in Fig. 7), and lead to the aggregation of the brass-oriented grains finally.
Though the texture types at small and medium deformations are similar for the materials with different SFE, i.e. the copper and brass textures, the evolution tendency of both textures (the dominant textures shown in the α and τ fibers) are entirely different when comparing the materials with low SFE with those with high/medium SFE. This leads to the different texture components for fcc materials with high/medium and the ones with low SFE at large deformations. It is known that both the point “M” in τ fiber and the point “N” in α fiber in Cartesian coordinate represent the identical crystallographic orientation (Goss orientation). Accordingly, the evolution tendency in α fiber can be connected with that in τ fiber by the Goss orientation. Based on the evolution tendencies in α and τ fibers for materials with low SFE, it is clear that the evolution of texture at large deformations is following the route:
{112}<111>→{111}<112>→{110}<001>→{110}<112>
To clarify the relationship between the texture evolution and deformation mechanisms composing of dislocation slip, twinning and shear banding for the fcc metals with low SFE, the analysis of Taylor factor and Schmid factor were employed [19] and [20]. The Schmid factors for slip systems and twin systems and the Taylor factors of some typical orientations and their twinned orientations in fcc metals under plain strain compressive loading are listed in .
| Table 1. Schmid factors for slip systems and twin systems and Taylor factors of some typical orientations in fcc metals under plain strain compression |
As can be seen, the Taylor factor of the copper orientation is 3.68, which is the biggest for the studied orientations. Thus, more work is required to reach one constant deformation for the copper-oriented grains compared to other grains. On the contrast, the Schmid factor of slip systems shows the minimum value for the copper orientation. Thus, plastic deformation in the copper-oriented grains is relatively difficult to proceed via dislocation slip. Consequently, the copper orientation is expected to be the most stable orientation and dislocation slip on the twelve {111} <110> slip systems is the main deformation mechanism. This analysis is consistent with the texture evolution of fcc materials with high or medium SFE at large deformations ( Fig. 1 and Fig. 2).
On the other hand, dislocation slip on the {111} <110> slip systems also occurs in the metal with low SFE at small deformations (below 20% thickness reduction). Thus, it is inferred that the grains in α-brass would tend to rotate toward the copper orientation, as shown in Fig. 3(b). As deformation proceeds, an obvious discrepancy between metals with low and medium/high SFE is that {111} <112> twin systems are much more extensively activated in the former materials [8] and [12]. The Schmid factor of the {111} <112> twin systems for the copper orientation is 0.629 (), which is also the smallest among the studied orientations. Therefore, it can be inferred that the twin systems are preferentially activated in the other grains compared to the copper-oriented grains. The copper orientation is still relatively stable at the initial stage of twinning. Consequently, the intensity of the copper orientation will continuously increase due to the further slip behavior, which is also in agreement with the increase of the copper-type textures in the 20%–40% deformed α-brass specimens ( Fig. 3(b)).
At 40% reduction, for the low SFE metal the {111} <112> twin systems are activated in more orientations. Twinning is activated in the copper-oriented grains, and the copper orientation then evolves to the copperT orientation. The Taylor factor for the copperT orientation is 2.845, which is smaller than that for other orientations. Besides, the Schmid factors of the slip and twin systems for the copperT orientation are 0.847 and 0.978, respectively. Both of the values are the largest among the studied orientations. Thus, it can be inferred that grains with the copperT orientation are in favor of both dislocation slip and twinning. Consequently, the copperT orientation is quite unstable, and tends to be transferred to other orientations during plastic deformation. Then, it is inferred that this processing facilitates the deformation of the copper-oriented grains which are located near the copperT-oriented grains.
On the other hand, the twin-matrix layers have covered most of the grains in α-brass at 40% reduction, while the shear bands have developed in the interior of the twin-matrix lamellar structure ( Fig. 4(c)). Regarding the microstructural aspect of shear band formation, recent experiments employing transmission electron microscopy (TEM) suggest that the initiation of shear banding is a result in which normal dislocation slip on the {111} <110> slip systems is prohibited by the twin-matrix lamellae. Then, strong shear is left at twin boundaries. With further deformation, the shear bands that are identified as the band-like strain localization propagate through the twin-matrix lamellar structure [13], [14], [17] and [18]. Besides, the shear banding areas are mainly covered with the Goss orientation. Based on the above analysis, the Goss orientation is one of the intermediate orientations during the transition from the copper to the brass orientation, which agrees with an investigation on {112} <111> oriented copper single crystals deformed at 77 K [13]. Then, it can be inferred that the initiation of shear bands is harmful to the strengthening of the copper orientation. As a result, the copper-oriented grains quickly disappear with the development of shear bands, which is also consistent with texture evolution of α-brass at large deformations (>40%). Therefore, it is known that shear banding is an essential factor for explaining the disappearance of the copper orientation in low SFE metals at large deformations. It is worth noting that the interactions between solutes atoms and mobile dislocations play a role in the mechanical behaviors of materials, e.g. the jerky flow in stress–strain curves as reported in the high-manganese or high-carbon twinning-induced plasticity (TWIP) steels [34], [35] and [36]. In this study, the alloying elements may also influence the micromechanism (dislocation slip, twinning and shear banding) and then the associated textures of the low SFE alloy [9]. This is, however, beyond the scope of the current paper.
Besides, the Schmid factor of the slip systems for the brass orientation is 0.816. This value is nearly the same as that for the brassT, Goss and GossT orientations, but larger than that for the copper orientation. The Schmid factor of twin systems for the brass orientation is 0.786, and it is also larger than that for the copper orientation. Besides, the Taylor factor for the brass orientation is 3.261, and it is smaller than that for the copper orientation. Then, the brass-oriented grains are also relatively stable, which contributes to the continuous strengthening of the brass orientation during loading. This process is also consistent with the development of the brass-type textures in α-brass at lower thickness reductions ( Fig. 3(a)).
As deformation proceeds, the copper-oriented grains gradually decrease and even disappear. The shear banding areas are covered with the Goss orientation. It is known that the Goss orientation is one of the intermediate orientations in the transition from the copper orientation to the brass orientation. Then, shear banding is in favor of the formation of the brass orientation. In addition, based on the analysis of Schmid factor for the slip and twin systems together with the Taylor factor, it is obvious that the brassT grains are also stable. Then, the intensity of the brass orientation continuously increases during the whole deformation stage, which is consistent with the texture evolution in α-brass ( Fig. 3). Consequently, it is concluded that for fcc metals with low SFE, shear banding is the dominant reason for the significant strengthening of the brass-type texture components at large deformations.
Texture evolution of fcc materials with various SFE (nickel, copper, and α-brass) under plane strain deformation were investigated systematically. The characteristics of microstructure and local orientation distributions were identified by SEM and EBSD techniques for α-brass at different thickness reductions (20%, 40%, 80% and 98%). Besides, Taylor factors and Schmid factors of slip systems and twin systems for some typical orientations were analyzed to explore the mechanism of texture evolution in low SFE materials. The main results are as follows:
(1) For nickel and copper at small deformations (below 40%), the main textures consisted of the brass and copper components. With further deformation, both textures showed a monotonically increasing trend, during which dislocation slip was the main mechanism.
(2) For α-brass, when the thickness reduction was below 40%, the brass and copper textures were the dominant texture components. At larger deformations the copper-oriented grains rotated around the <110> crystallographic axis through the brass-R orientation to the Goss orientation, and finally toward the brass orientation. Namely, the route of orientation evolution was following the route:
{112}<111>→{111}<112>→{110}<001>→{110}<112>
(3) For α-brass at small deformations (below 20% thickness reduction), dislocation slip was the dominant deformation mechanism. The role of twinning in plastic deformation enhanced with deformation. At larger deformations (above 40% thickness reduction), shear banding became the dominant mechanism.
(4) The deformation mechanism of dislocation slip was in favor of increasing the intensity of the copper texture component. The initiation of shear bands was the main reason for the texture transition from the copper-type to the brass-type for fcc materials with low SFE at large deformations.
We gratefully acknowledge the financial support of the National Natural Science Foundation of China (Grant No.51101030) and the Fundamental Research Funds for the Central Universities (Grant No. N100702001). The authors are also grateful to the kind support of the Alexander von Humboldt Stiftung (AvH, Alexander von Humboldt Foundation, www.humboldtfoundation.de) for N. Jia.
| 1. |
|
| 2. |
|
| 3. |
|
| 4. |
|
| 5. |
|
| 6. |
|
| 7. |
|
| 8. |
|
| 9. |
|
| 10. |
|
| 11. |
|
| 12. |
|
| 13. |
|
| 14. |
|
| 15. |
|
| 16. |
|
| 17. |
|
| 18. |
|
| 19. |
|
| 20. |
|
| 21. |
|
| 22. |
|
| 23. |
|
| 24. |
|
| 25. |
|
| 26. |
|
| 27. |
|
| 28. |
|
| 29. |
|
| 30. |
|
| 31. |
|
| 32. |
|
| 33. |
|
| 34. |
|
| 35. |
|
| 36. |
|