|
|
|
|
Influence of Shear Banding on the Formation of Brass-type Textures in Polycrystalline fcc Metals with Low Stacking Fault Energy
|
Yan Haile 1, Zhao Xiang 1, Jia Nan 1,* , Zheng Yiran 1, He Tong 2 |
|
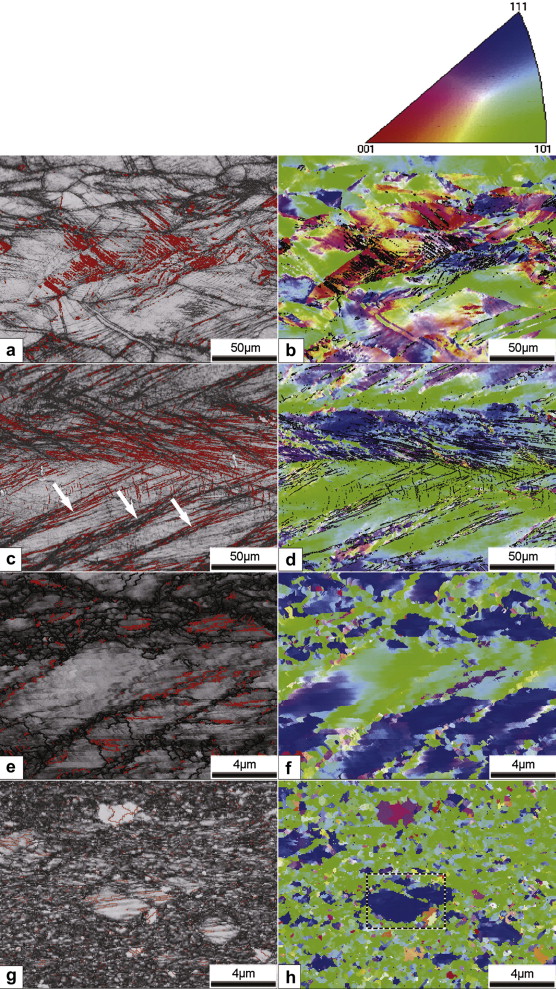
Fig. 4. Band contrast maps and orientation distribution maps obtained from EBSD analysis for α-brass at various thickness reductions. The red lines in the left figures and the black portion in the right figures represent the Σ3-type twin boundaries. a and b 20% thickness reduction, c and d 40% thickness reduction, e and f 80% thickness reduction, g and h 98% thickness reduction.
|
|
|
 |
|
|