

1. Introduction
Recently, selective laser melting (SLM) has attracted much attention because of its capacity to produce complex metallic components with a lower time-to-market, a higher material utilization rate and a higher level of flexibility [[1], [2], [3]]. Nowadays, this technology has been used to manufacture non-structural components for certain industrial applications. However, due to the inherent drawbacks of SLM technique, its implementation for fabricating structural parts is still very limited.
One key issue is that there are still serious micro-pore problems, which means that the stable performance of SLMed components cannot be guaranteed. Micro-pores usually come from the evaporation of liquid, where dense vapor plumes caused by the vaporization produce recoil momentums in the molten materials to form cavities [4,5]. At present, by controlling processing parameters during SLM, such as laser power, layer thickness, scanning speed, scanning strategy or laser focus, micro-pores of SLMed materials can be reduced [6,7]. However, for some materials that are difficult to manufacture by SLM, the effective range of the processing parameters is very small. For example, fully dense SLMed Al-Cu-Mg alloys can only be fabricated under a very low scanning speed (83.3 mm/s) [8]. Moreover, it is impossible to eliminate micro-pores for some materials such as Ti-Al alloy only by regulating the processing parameters of SLM [9]. Therefore, the effect of reducing micro-pores by adjusting SLM processing parameters is limited. Certainly, microalloying is often used to eliminate micro-pores [10], but it changes the characteristics of materials. Moreover, Hot Isostatic Pressing (HIP) is also able to eliminate micro-pores [11], but the equipment and cost are much higher.
Another critical drawback of SLMed materials is the microsegregation accompanied by fast solidification [12]. It usually occurs when the later solids (e.g., interdendritic zones or grain boundaries) have higher solute atomic concentrations than the former solidified parts. Generally, microsegregation is the reason for the formation of detrimental non-equilibrium phases which will greatly degrade the performances of components. For example, in the SLMed Inconel 625 alloy [13], a large amount of Nb, Mo, and other elements enriched in the grain boundaries lead to the formation of cracks. For the SLMed Hastelloy-X alloy [12], the segregation of Mn, Si, S and C in the grain boundaries also increases the crack-sensitivity. In recent years, numerous efforts have been made to reduce the microsegregation during the SLM process. On one hand, many scholars try to eliminate microsegregation by adjusting SLM processing parameters [14,15], but the effect is not obvious. On the other hand, microalloying methods are adopted to resist element segregation [11,16], but the characteristics of materials are varied.
In summary, to overcome the existing problems of SLM, optimizing the processing parameters during SLM is an easier and more convenient way, but the regulation effect is severely limited. It is all known that traditional SLM with stationary laser beam results in the static distribution of laser power around the stationary position, so that the gas volatilization and solute diffusion during solidification are not drastic. Thus, traditional SLM limits the possibility to optimize the formability, microstructure and mechanical property. To realize a further industrial application of SLM technology, how to suppress the formation of micro-pores and solute element microsegregation are key bottlenecks that must be overcome.
Previous studies on welding process have demonstrated that circular beam oscillation has a huge potential to eliminate micro-pores, improve welding formability, reduce solute element microsegregation and thus reduce crack tendency [[17], [18], [19], [20]]. SLM can be regarded as a process of micro-welding molten pool stacking. Applying circular oscillation scanning in the SLM process, the beam moves along a chosen trajectory and then the regular high-frequency motion of laser beam is used to stir molten pools, which is expected to bring about the elimination of micro-pores and improvement of the microstructures. Compared with the traditional welding, the size of molten pools in SLM is smaller, so it is easier to stir. In addition, the oscillating rate brought by the galvanometer is higher than the mechanical arm of the welder, so the stirring effect will be more obvious. Unfortunately, relevant work has not yet been studied.
Inconel 718, as an age hardening Ni-based superalloy, has widely been used in the high-temperature components due to its superior mechanical properties and excellent oxidation resistance [21,22]. In recent years, extensive researches on SLMed Inconel 718 have been carried out, which show that the microsegregation usually occurs in the interdendritic regions [23,24] and micro-pores usually form under the higher laser energy density [24,25]. Therefore, Inconel 718 alloy was selected to study the circular oscillating effect during SLM process. In addition, oscillating scanning usually results in a change of the temperature gradient [19], which may affect the crystal orientation. Traditional SLMed Inconel 718 usually presents a strong texture [26,27], therefore, the influence of circular oscillation scanning during SLM process in crystal anisotropy was also studied.
In this work, to achieve a comprehensive understanding of the circular oscillation scanning during SLM, the formability, microstructure, texture and mechanical property from single-track, multi-layer to cuboid specimens for SLMed Inconel 718 alloy were firstly investigated in detail. Also, the relationship between circular oscillating scanning and solidification behaviour was established to evaluate the oscillating effect during SLM.
2. Materials and methods
In the experiments, the used Inconel 718 powders are spherical and their average diameter is 32.7 μm. The chemical composition of Inconel 718 powders has been listed in our previous publication [5]. The used substrate is rolled Inconel 718 substrate. All experiments were carried out on a self-developed SLM machine (LSNF-3), which consisted of a 2000 W fiber laser with a wavelength of 1017 ± 10 nm and a self-developed control software to achieve the circular oscillation scanning. The circular oscillating pattern was controlled by adjusting the amplitude (A) and oscillating frequency (F), as shown in the Fig. 1. A is the radius of a circle, and F is the number of circles per unit time. Time depends on the ratio of the length of the single molten pool (L) and the speed of the single molten pool formation (v). For all the samples, the length of each molten pool is 10 mm, and the speed of each molten pool is 10 mm/s. Therefore, F is the number of the circles per 1 s. Besides, v´ is defined as the actual scanning speed of the laser beam during the oscillating SLM process. A series of processing parameters of single-track, multi-layer and cuboid samples are shown in the Table 1.

Fig. 1.
Schematic diagram of circular oscillating scanning.
Table 1 Design of experiments for SLMed Inconel 718 single-track, multi-layer and cuboid samples.
| Group | Single-track | Multi-layer | Cuboid sample |
|---|---|---|---|
| Laser power, P (W) | 300 | 300 | 300 |
| The speed of single molten pool formation, v (mm/s) | 10 | 10 | 10 |
| Scanning distance, S (mm) | - | - | 0.3-1 |
| Layer thickness, T (μm) | 40 | 40 | 80 |
| Amplitude, A (mm) | 0-1.1 | 0, 0.5 | 0, 0.5 |
| Oscillating frequency, F (Hz) | 0-800 | 0, 300 | 0-500 |
A Phantom® CMOS high-speed video camera, with the maximum frame of 650 kfps (frames per second) was used to observe the molten pools. A CAVILUX® diode laser light source was used to increase the contrast of the molten pool, whose wavelength is 80 ± 10 nm and pulse energy is 25 μJ-5 mJ. Moreover, the relative densities of cuboid samples can be obtained by image processing of eight optical micrographs using the Image-Pro Plus 6.0 software. All SLMed samples were polished and then electrolytically etched in the aqueous phosphate solution with volume fraction of 75 at 5 V for ∼75 s. The phase composition of the SLMed samples was identified using an X-ray diffraction (XRD). The microstructures of the SLMed samples were characterized using an optical microscope (OM) and a FEI Sirion 200 scanning electron microscope (SEM) equipped with an electron backscattered diffraction (EBSD) detector. The element composition of all the samples was characterized by the electron probe micro-analyzer (EPMA). Finally, Vickers hardness of the molten pools were also measured by an HVS-1000 microhardness tester with a load of 0.98 N.
3. Results and discussion
3.1. Analysis of molten pools with and without oscillation
3.1.1. Geometry and formability
In Fig. 2, the morphology of the top surface of SLMed Inconel 718 molten pool can be changed by the circular beam oscillation. Compared with the flat top surface of the molten pool without oscillation (Fig. 2(a)), some circles appear on the upper surface of molten pools when the amplitude (A) is fixed and the oscillating frequency (F) is relatively low (Fig. 2(b-d)), and subsequently disappear with the increase of the F (Fig. 2(e-h)). Inversely, when the F is fixed and the larger A is applied, some circles will appear on the upper surface of the molten pool (Fig. 2(i-l)).

Fig. 2.
Top surface morphologies of SLMed circular beam non-oscillating (a) and oscillating (b-l) Inconel 718 molten pools.
Fig. 3 shows the cross sections of the molten pools with and without oscillation. Obviously, there are some micro-pores in the nail-shape Inconel 718 molten pool without oscillation (Fig. 3(a)). Compared with the molten pool without oscillation, a remarkable morphology transition from inverted peak to rectangle shape is observed when the oscillating frequency increases from 20 Hz to 500 Hz (Fig. 3(b-g)). Under the oscillating frequency of 20-30 Hz (Fig. 3(b) and (c)), the bottom of the inverted peak shape molten pool is made up of irregular concave and convex surfaces which may derive from the long-distance lap of the circular scanning lines (Fig. 2(b) and (c)). Obvious micro-pores are also observed in the inverted peak shape molten pool. But when the oscillating frequency is increased to more than or equal to 50 Hz (Fig. 3(d-g)), the molten pool becomes rectangle shape with a relatively flat bottom, and micro-pores basically disappear. Thus, the rectangle-shape molten pool has the best formability. The molten pools under different amplitudes also confirm this view (Fig. 3 (h-k)).

Fig. 3.
Cross-section morphologies of SLMed circular beam non-oscillating (a) and oscillating (b-k) Inconel 718 molten pools.
The depth (D, μm), width (W, μm) and height (H, μm) of rectangle-shape molten pools (Fig. 4(a)) are measured, as shown in Fig. 4(b) and (c). Obviously, when other parameters are fixed, the increase of oscillating frequency or amplitude can bring about significant reduction in the depth of molten pools. However, for the width of molten pools, the effects of those two oscillating parameters are inconsistent. The width of molten pools increases first (from ∼1000 μm to ∼1500 μm) and then decreases (from ∼1500 μm to ∼1300 μm) with increasing oscillating frequency from 0 to 500 Hz. But as the amplitude increases from 0 to 1.1 mm, the width of molten pools increases linearly (from ∼1000 μm to ∼2500 μm). Moreover, the height of molten pools under various oscillating frequencies and amplitudes nearly remains constant (∼40 μm).

Fig. 4.
(a) Chart to describe the depth, width and height of rectangle-shape molten pool; Measured sizes of rectangle-shape molten pools under various oscillating frequencies (b) and amplitudes (c).
Therefore, the formability, morphology and size of the SLMed Inconel 718 molten pools can be influenced by the circular oscillating scanning. The oscillating molten pool forms two shapes including inverted peak and rectangle shape, which is different from the traditional nail-shape SLMed Inconel 718 molten pool. Between them, the rectangle-shape molten pool has a better formability. The width of rectangle-shape molten pools is affected greatly by the oscillating amplitude.
3.1.2. Microstructures
Fig. 5(a) gives the microstructure of the SLMed Inconel 718 molten pool without oscillation, which is composed of γ dendrite and irregular chain shape Laves phases formed in the interdendritic network. Quite high cooling rate (103-108 K/s) easily causes the Nb, Mo and Ti elements concentrate near the interdendritic regions [28,29]. This microsegregation will presumably serve as nucleation sites for intermetallic phase, leading to the precipitation of Laves phases in the interdendritic network at the end of solidification during SLM. By carefully observing, it can be observed that the phase composition of the oscillating molten pools is not changed and still composed of γ-dendrites and Laves phases (Fig. 5(b-j)).

Fig. 5.
Microstructures in SLMed Inconel 718 molten pools without (a) or with (b-j) oscillation.
Fig. 6 gives the primary dendrite arm spacing (PDAS) and the area fraction of Laves (Laf) in the molten pools. In Fig. 6(a), with increasing oscillating frequency from 0 to 800 Hz, the PDAS first decreases by >50 % to 1.42 μm (F = 50 Hz) and then increases to the peak value of 2.42 μm (F = 100 Hz) and decreases to ∼1.69 μm in the end. Similarly, the Laf first decreases from ∼3.5 % to ∼1.3 % and then increases to ∼1.8 % and finally decreases to 0.43 % with the increase of oscillating frequency. Unlike those variation trend, two decreasing curves in the PDAS (from ∼3.20 μm to ∼0.90 μm) and the Laf (from ∼2.20 % to ∼0.90 %) are observed with varying amplitude from 0 to 1.1 mm (Fig. 6(b)). It is noting that the PDAS and Laf of all oscillating samples are less than those of the sample without oscillation.

Fig. 6.
Effects of oscillating frequency (a) and amplitude (b) on PDAS and Laf in SLMed Inconel 718 molten pools.
Based on the quantitative analysis results, the distributions of PDAS and Laf under different oscillating parameters tend to satisfy the following equations:
Thus, although the circular oscillating during SLM process has no significant influence on the phase composition of the Inconel 718 molten pools, it can bring about the refinement of dendrites and the reduction of the area fraction of Laves phases.
3.1.3. Microhardness
Fig. 7 is the measured microhardness values of the molten pools. Apparently, the microhardness values under two groups oscillating parameters show two trends opposite to the PDAS. Moreover, all microhardness values of oscillating samples are higher than that of the sample without oscillation. Thus, oscillating scanning can improve the microhardness of molten pools.

Fig. 7.
Effects of oscillating frequency (a) and amplitude (b) on microhardness in SLMed Inconel 718 molten pools.
3.1.4. High speed video analysis
High-speed videos were used to capture the real-time formation process of molten pools, as shown in the Fig. 8. During the non-oscillating SLM process, the laser beam moves from left to right along the path indicated by the golden arrow (Fig. 8(a1-d1)). The position where the laser beam appears in each figure is indicated by the red arrow. The heat flux flows to the rear stably along molten pool centerline. Moreover, obvious depression zones form due to the drastic recoil pressure caused by the metal vapor [30]. Those depressions are easily closed and develops into cavities as the laser moves forward [31].

Fig. 8.
Time series snapshots of Inconel 718 molten pool evolution during different SLM processes including non-oscillation (a1-d1) and oscillation (a2-d4).
Under the condition of beam oscillation (Fig. 8(a2-d4)), the laser beam moves in a specific circular trajectory depending on the selected oscillating parameters. The two-dimensional motion of the scanning circle under different oscillating parameters makes the overlap of liquid flows different. When F is equal to 50 Hz (Fig. 8(a2-d2)), the liquid flow forms along the movement direction of the laser beam and the previous liquid flow has solidified before the next scanning circle comes. But when F is higher than 100 Hz (Fig. 8(a3-d4)), the melting caused by the previous oscillating circles has not completely solidified when the next oscillating circle comes. The overlaps of several scanning circles result in the width enlargement of the Inconel 718 molten pool. The circular scanning stirs the enlarged molten pool and strengthens the convection in the molten pool (a lot of tiny turbulences indicated by white arrows). On one hand, turbulences can accelerate the homogeneous diffusion of solute atoms and thus reduce the volume fraction of Laves phase. On the other hand, turbulences are helpful to the rapid release of metal vapor in the depression zones, thus reducing the micro-pores of the samples, as shown in Fig. 3(d-g).
The cooling rate (T˙) of a molten pool can be calculated as the ratio between a temperature interval ΔT and a time interval Δt [32]. The liquid phase temperature range (TV-TS, where TV is vaporization temperature of alloy and TS is solidus temperature) is taken as ΔT. In addition, Δt is considered as the time interval between the t1 when the laser beam acts on position X (T≈ TV) and the t4 when the position X solidifies (T= TS). The solidification occurrence time of molten pool (t = t4≈ tS) is regarded as the frame at which the movement of the top surface of the molten pool cannot observed. The results of cooling rate are shown in Table 2. Obviously, the cooling rate of all oscillating samples are higher than that of the non-oscillating sample. Specially, the calculated cooling rate (∼105 K/s) of the oscillating sample with an oscillating frequency of 50 Hz is one order of magnitude lager than that of the non-oscillating molten pool. Obviously, solidification microstructure and microsegregation in SLMed alloys are driven by the temperature gradient G and the solidification front growth rate R. A high cooling rate ΔTΔt=G*R can promote higher undercooling, which causes finer dendrites and less solute trapping [33]. Therefore, the increase of the cooling rate is the main reason for dendrite refinement in the molten pool. But the decrease of the volume fraction of Laves phases depends not only on the increase of cooling rate but also on the stirring effect inside the molten pool.
Table 2 Cooling rates measured from video acquired during formation processes of molten pools with and without oscillation.
| Laser power, P (W) | Scanning speed, v (mm/s) | Amplitude, A (mm) | Oscillating frequency, F (Hz) | Δt (s) | Cooling rate, T˙ (K/s) |
|---|---|---|---|---|---|
| 300 | 10 | 0 | 0 | 69.05 | 2.4 × 10⁴ |
| 0.5 | 50 | 5.96 | 2.78 × 10⁵ | ||
| 0.5 | 100 | 40.93 | 4.06 × 10⁴ | ||
| 0.5 | 500 | 30.05 | 5.53 × 10⁴ |
The cooling rate (Ṫ, K/s) during the oscillating process is proportional to the actual scanning speed (v´, mm/s) according to the following equation [34]:
As shown in Fig. 1, the circular trajectory makes the actual scanning length (L´ ≈2πAF) of the molten pool larger than the straight line (L). Thus, the actual scanning speed (v´) at any point of the oscillating molten pool is far beyond that of the speed of molten pool formation (v). The actual scanning speed can be calculated based on the following formula:
According to Eqs. (3) and (4), for the SLMed Inconel 718 molten pool, the circular oscillating scanning contributes to the increase of cooling rate, resulting in the decrease of PDAS and Laf.
To sum up, two factors have an important influence on the Inconel 718 molten pool microstructures during the oscillating SLM process. One important effect is that the beam oscillation increases the convection in the molten pool and thus strengthens the solute element diffusion. Another important effect is that the actual molten pool is composed of a number of smaller molten pools which experience higher cooling rates, thus decreasing the PDAS and Laf.
3.2. Analysis of multi-layer samples with and without oscillation
3.2.1. Microstructures and crystallographic features
Based on the above analysis, the rectangle-shape molten pool (A = 0.5 mm, F = 300 Hz) was selected to manufacture the single-track multi-layer sample (thin wall), as shown in Fig. 9(a1). The non-oscillating thin wall (A = 0, F = 0) was used for contrast (Fig. 9(a)). At the bottom part of the non-oscillating thin wall (Fig. 9(b)), the γ-dendrites have multiple growth directions. With the increase of the sedimentation height (Fig. 9(c) and (d)), the γ-dendrites are easier to grow along the build direction. But in the oscillating thin wall, the dendrites with multiple growth directions at the bottom part cannot be found (Fig. 9(b1)). On the contrary, at different parts of the whole thin wall, “long” and “straight” dendrites tend to grow along the deposition direction (Fig. 9(b1-d1)).

Fig. 9.
Optical and SEM images of dendrites at different parts of SLMed non-oscillating (a) and oscillating (b)Inconel 718 thin walls.
Fig. 9 also shows the morphology of Laves phase. The width of Laves phases gradually increases with the build-up of the thin walls regardless of whether or not the oscillation is applied, which may own to the gradually decreasing cooling rate in the deposition process of thin walls. A slower cooling rate makes the ability of γ-matrix to trap solute atoms weak as there is sufficient time for Nb, Mo and Ti atoms to diffuse to the interdendritic zones. Sufficient solute atoms facilitate the formation of Laves phases. The cooling rate (ε, K/s) can be calculated using the following semiempirical equation [35]:
The results are presented in Fig. 10, showing two obvious decreasing curves of cooling rate along the deposition direction of the thin walls with and without oscillation, which means that the heat accumulation occurs due to the overlaps of vertical scanning tracks. Moreover, at the same deposition height, the cooling rate of the oscillating thin wall is lower than that of the non-oscillating thin wall. Also, when the deposition height exceeds 1.5 mm, the cooling rate of the non-oscillating thin wall tends to be flat and its value is about 1.0 × 10⁴ K/s, but the cooling rate of the oscillating thin wall still decreases slowly. Therefore, unlike the single molten pool, the oscillating thin wall has a slower cooling rate compared with the non-oscillating thin wall. This may be because the heat accumulation caused by track-by-track overlaps is more conductive to slow down the solidification rate of the oscillating thin wall. More interestingly, this slower cooling rate does not result in more Laves phases compared to the non-oscillating thin wall, which in turn reduces the area fraction of Laves phases. Therefore, this improvement of the microsegregation in the thin wall has nothing to do with the cooling rate, but only related to the stirring effect inside the molten pool.

Fig. 10.
Cooling rate and area fraction of Laves phases in SLMed oscillating and non-oscillating Inconel 718 thin walls.
Expect for the dendrite and Laves phase, the texture at various locations in the thin walls with and without oscillation are also shown in Fig. 11. In Fig. 11(c) and (c1), near the bottom part of two kinds of thin walls (within 500 μm for the non-oscillating sample and 200 μm for the oscillating sample), grains have random orientations. So, from the pole figures (Fig. 11(e) and (e1)), the projection locations of the bottom part in the oscillating thin wall is relatively concentrated. Moreover, at the top parts of the thin walls with and without oscillation, obvious <001> preferential orientations along the building direction are seen (Fig. 11(b) and (b1)). Therefore, compared with the bottom parts, the top parts in both samples have higher pole densities, as shown in Fig. 12(d) and (d1).

Fig. 11.
Optical images (a, a1) and EBSD images at different zones of oscillating and non-oscillating thin walls: inverse pole maps (b, c and b1, c1) and pole maps (d, e and d1, e1).
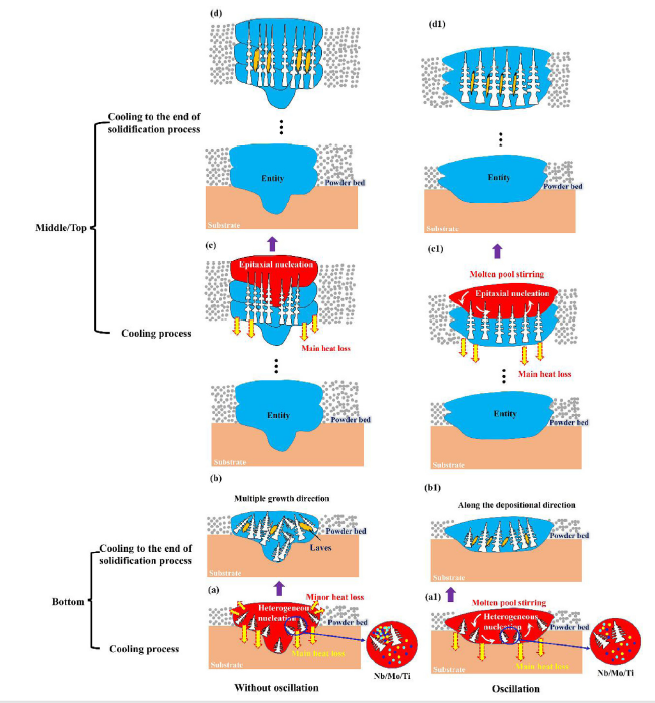
Fig. 12.
Microstructural evolution mechanism diagram of oscillating (a1-d1) and non-oscillating (a-d) Inconel 718 thin walls during SLM process.
3.2.2. Microstructural evolution mechanism
Compared with the non-oscillating thin wall, less microsegregation and stronger <001> texture are present in the oscillating thin wall. Inevitably, such differences in thin walls are derived from the comprehensive effects of the thermal gradient, cooling rate, nucleation, and growth of the dendrites.
Detailed formation and evolution mechanisms on microstructures of the thin walls are shown in Fig. 12. At the bottom part of non-oscillating thin wall (Fig. 12(a)), γ-dendrites begin to the heterogeneous nucleation. Subsequently, dendrites tend to grow along the maximum thermal gradient [36], accompanied by solute segregation (Nb, Mo, Ti) in the interdendritic zones [37]. The maximum thermal gradient depends on the path of heat loss. One major heat loss is the cooling effect of the substrate. Moreover, a small amount heat is lost through the surrounding powders and ambient gas. The heat loss with several channels leads to the slight deviation of the temperature gradient of each point in the molten pool. Therefore, the dendrites at the bottom part have multiple directions. Meanwhile, at the end of the solidification process, the eutectic reaction of L → γ + Laves may occur due to the higher concentration of solute elements in liquid phase (Fig. 12(b)). With the layer-by-layer build-up of the non-oscillating thin wall, the epitaxial nucleation of γ phases would take over the heterogeneous nucleation [37] (Fig. 12(c)). The formed grains would act as the substrate for the nucleation in the liquid phase and epitaxial nucleation would continue layer by layer. In addition, the heat loss through powders and ambient gas decreases gradually with the heat accumulation in the deposition process of the thin wall. Therefore, the highest thermal gradient is from the molten pool to the substrate [38], which causes a nearly vertical growth direction of the dendrites, as shown in Fig. 12(d). Meanwhile, the reduced cooling rate leads to the formation of more Laves phases. But at the bottom part of the oscillating thin wall (Fig. 12(a1)), a lot of tiny turbulences caused by oscillating scanning rotate the heat flow of the molten pool. On the one hand, the heat dissipation in all directions inside molten pool is more uniform and the highest thermal gradient is from the molten pool to the substrate. On the other hand, solute enrichment toward the interdendritic zones is hindered due to the stirring effect. Thus, at the end of the solidification process, dendrites with nearly vertical growth direction and less Laves phases form (Fig. 12(b1)). When deposition height increases, although the cooling rate of non-oscillating thin wall is reduced, the stirring effect of the oscillating scanning reduces the precipitation of Laves phases (Fig. 12(c1) and (d1)).
Moreover, the growth orientations of columnar grains are the comprehensive influences of the thermal gradient, nucleation, epitaxial/preferred growth (<001> are the fastest growth directions for face-centered cubic crystals) [39]. At the bottom part of the thin wall without oscillation, on the one hand, heat flows in many directions causes the growth direction of dendrites to deviate from <001> direction. On the other hand, the heterogeneous nucleation and its subsequent growth dominate the solidification process, which causes no obvious preferred orientation for the dendrites (Fig. 11(c)). However, at the top part, the epitaxial nucleation gradually holds a dominant position and a favored <001> direction gradually appears. The highest thermal gradient from molten pool to substrate also leads to the increase of the <001> texture intensity (Fig. 11(b)).
However, at the bottom zone of the oscillating thin wall, a lot of tiny turbulences rotate the heat flow of the molten pool [40]. Thus, the growth of original grain with non-optimal orientation will stop, while the preferred <001> direction will be retained. Thus, a relatively strong <001> texture forms at the bottom part (Fig. 11(c1)). When the height of thin wall increases, the heat accumulation blurs the heat flow direction in the molten pool, so that the grains with the direction of <001> along building direction are largely preserved, thus causing a stronger <001> texture compared with the top part (Fig. 11(b1)).
In summary, the solute homogenization and texture enhancement of the oscillating thin wall are mainly caused by the stirring effect and the change of temperature gradient, respectively.
3.3. Analysis of cuboid samples with and without oscillation
3.3.1. Formability
Fig. 13 gives the processing window of SLMed Inconel 718 cuboid samples. Obvious irregular micro-pores and spherical micro-pores are observed in all the samples without oscillation, showing a poor formability. In this case, the highest relative density (RD) is only 90.05 %. But when the oscillating scanning was adopted (A = 0.5 mm, F = 300 Hz), the micro-pores were basically eliminated under the scanning distance of 0.8 mm and 1 mm. The specimen with oscillating frequency of 300 Hz and scanning distance of 1 mm has the highest relative density (up to 99.95 %). Apparently, the circular oscillating scanning is helpful to enlarge the forming window and improve the formability of the SLMed cuboid Inconel 718 sample. However, when the oscillating frequency is increased to 500 Hz, the micro-pores were increased again. This may be because the turbulence of molten pools caused by the larger oscillating frequency is too violent to overflow the micro-pores from the molten liquid (Fig. 8 (a4-d4)).

Fig. 13.
Cross sections of SLMed Inconel 718 cuboid samples under various oscillating parameters.
3.3.2. Phase analysis
Fig. 14 shows the XRD patterns of the SLMed samples with and without oscillation, in which the oscillating sample is the one with the highest density shown in Fig. 13. The XRD spectra of both samples are coincident with that of the γ-face-centered cubic (fcc) solid solution and show three main peaks including (1 1 1), (3 1 1) and (2 0 0). Besides, there are also two weak peaks (2θ = 44.12° and 2θ = 44.97°) labeled to (1 1 2) and (2 0 1) planes of Laves phases in these two samples [41]. The peak intensity of Laves phases in the sample with oscillation is lower than that of the no-oscillating sample. Therefore, circular oscillating scanning is also conducive to eliminate the formation of Laves phases in the SLMed Inconel 718 cuboid sample.

Fig. 14.
XRD patterns of SLMed oscillating and non-oscillating Inconel 718 cuboid samples.
3.3.3. Microstructures and crystallographic features
Fig. 15(a) and (c) display SEM images at the same height in the samples with and without oscillation, showing the morphologies of dendrites and molten pools. The layered half arcs accumulated along the deposition direction are identified, where the arcs of molten pools in the oscillating sample are flatter than those of the non-oscillating sample. Moreover, the extending directions of the dendrites (indicated by golden arrows) in the molten pools are also different. In the non-oscillating sample, except for a few γ-dendrites epitaxially growing across the boundaries of molten pools, most of the dendritic growth directions are changed by the boundaries of molten pools. Thus, there is no obvious relationship between the dendritic growth direction and the deposition direction. According to the IPF map shown in Fig. 15(b), it can be seen that various dendrite orientations display in the SLMed Inconel 718 sample without oscillation, showing a weak texture.

Fig. 15.
SEM figures of SLMed cuboid samples with and without oscillation (a, c); (b, d) are inverse pole figures.
However, in the oscillating sample, most of columnar dendrites are inclined about 45° to the deposition direction, and only a few columnar dendrites in the center of molten pool grow along the build direction. The columnar dendrites that along the deposition direction and inclined 45° to the growth direction are usually the origins of <001> and <101> texture in the superalloy [42], respectively. Thus, compared with the non-oscillating sample, a strong <101> texture and a weak <001> texture are formed in the oscillating sample (Fig.15(d)).
Fig. 16(a) and (c) show the corresponding enlarged SEM images at the same zones shown in Fig. 15(a) and (c), respectively. Obviously, the PDAS of the oscillating cuboid sample is bigger than that of the non-oscillating sample, meaning that there is a higher number of dendrites in the non-oscillating bulk sample under the same area. However, the SEM images only reflect the local dendrites, and cannot truly reflect the sizes of the dendrites of the whole cuboid sample. The existing research has confirmed that the tiny γ-dendrite existed in each columnar grain is the main reason for the formation of the low angle boundaries (misorientation angle lower than 15°) of SLMed Inconel 718 [43]. Fig. 16(b) and (d) represent the grain boundaries map in a bigger area. For the non-oscillating sample, 57 % of the low angle grain boundaries (LAGBs) can be found in the columnar grains, which is nearly 30 % higher than that of the oscillating sample (40 %). Therefore, circular oscillating scanning can make the PDAS bigger, which is consistent with the thin wall.

Fig. 16.
Enlarged SEM figures of SLMed oscillating and non-oscillating (a, c) Inconel 718 cuboid samples; (b, d) are grain boundaries map with various angles in a bigger area.
Fig. 17 shows the EPMA maps of element distribution in the cuboid sample without oscillation. It can be observed that Nb, Ti and Mo elements are rich in interdendritic regions and other elements including Fe and Cr are abundant in dendritic trunks. Magically, when applied the circular oscillating scanning, the most concentrated parts of clustered elements are greatly eliminated, as shown in Fig. 18. For example, the zones with the highest mass fraction of Nb and Mo elements in the interdendritic network (golden circles) disappear. Moreover, it is exciting that circular oscillation can extensively eliminate the extreme point of Fe mass fraction in the dendritic trunks, reducing the average mass fraction of Fe element from 24.36 % to 20.00 %. Thus, circular oscillating scanning can cause a more homogeneous distribution of solute atoms for the SLMed Inconel 718 cuboid sample due to its stirring effect. Homogenization of solute atoms favors the reduction of the area fraction of the Laves phases, as shown in the XRD patterns.

Fig. 17.
Microstructures on cross section of the non-oscillating SLMed Inconel 718 cuboid sample.

Fig. 18.
Microstructures on cross section of oscillating SLMed Inconel 718 cuboid sample.
3.3.4. Texture formation mechanism
As observed in the thin wall, <001> are easy growth directions and they grow fastest when <001> are oriented towards the deposition direction. However, in the cuboid sample, no obvious texture for non-oscillating scanning and <101> texture for oscillating scanning are oriented along the deposition direction. Inevitably, such differences in cuboid samples are closely related to their preferred growth and thermal gradient.
First of all, the growth behaviour of columnar grains in the oscillating sample was focused (Fig. 19). Near the center of the molten pool, the direction of the temperature gradient (indicated by the red arrow) is approximately parallel to the deposition direction, so a small number of columnar grains grow along the deposition direction. Because the extension direction controlled by temperature gradient is consistent with the growth direction of columnar grains in the molten pool, these columnar grains can go through several layers [44]. Thus, these perpendicularly grown columnar grains causes a weak <0 0 1> crystal orientation. However, at the boundaries of the adjacent molten pools, the growth direction of the columnar grain is controlled by both temperature gradient and epitaxial growth direction. For example, at position b, the columnar grains in #2 molten pool tend to grow along the D2b direction, which is similar to the main growth direction of the grain (Ga) in the adjoining #1 molten pool for decreasing the nucleation energy between the #1 and #2 molten pools. However, the maximum temperature gradient in the #2 molten pool (T2b) also pulls the dendrites to grow toward the center of the molten pool. Therefore, when the angle (θ) between D2b and T2b is acute angle, these two temperature gradients compete fiercely. To maximize the stability of the system, the competition between the temperature gradient and the epitaxial direction will cause most of the columnar grains to tilt about 45° relative to the deposition direction (yellow arrows) [42], thereby forms a strong <010> texture. But for the non-oscillating sample, the θ is an obtuse angle, inhibiting the epitaxial growth of grains. Thus, the maximum temperature gradient direction of the molten pool controls the growth directions of new grains, so that the cuboid sample has no obvious texture.

Fig. 19.
Formation mechanisms diagram of different textures of SLMed Inconel 718 cuboid samples with and without circular beam oscillation.
4. Conclusions
In this work, the effects of SLM circular beam oscillation on formability, microstructure, texture and microhardness of the Inconel 718 samples from single-track to cuboid sample were investigated. The main results are as follows:
(1)During the circular oscillating SLM process, the Inconel 718 molten pools forms two shapes including inverted peak and rectangle shape. The rectangle-shape molten pool has a better formability. This circular oscillating scanning can also improve the formability of the SLMed Inconel 718 cuboid samples, increasing the relative density to 99.95 %.
(2)In the SLMed Inconel 718 molten pool, the circular oscillating scanning can bring about the refinement of dendrites, the reduction of the area fraction of Laves phases and the increase of the microhardness. However, for the oscillating SLMed Inconel 718 thin wall and cuboid samples, coarser dendrites and fewer Laves phases can be obtained compared with the non-oscillating samples.
(3)Compared with the non-oscillating thin wall and cuboid sample, the oscillating thin wall and cuboid sample have obvious <001> and <101> texture, respectively.
(4)The improvement of formability, microstructure and texture in the oscillating SLMed Inconel 718 samples is closely related to their cooling rate, thermal gradient and stirring effect.
Reference
Equilibria and Lattice Parameters of Fe2Nb Laves Phase in Fe-Ni-Nb Ternary System at Elevated Temperatures,

 WeChat