
1. Introduction
Zircaloy-4 alloy (Zr-4, i.e. Zr-1.2 wt%Sn-0.2 wt%Fe-0.1 wt%Cr) has been extensively used in nuclear power industries because of its low absorption of thermal neutrons and excellent corrosion resistance [[1], [2], [3]]. The corrosion resistance of the Zr-4 alloy tube is an important factor to anticipate the service life of fuel assemblies. In general, the uniform corrosion and nodular corrosion take place on the surface of the Zr-4 alloys tube in light water reactors operation [4,5]. In addition, with the increasing of corrosion time, the growth of nodular corrosion spots will blend into each other and form a larger nodule, which will effect the corrosion resistance of the Zr-4 alloy tube [6,7]. A number of studies were conducted to understand the formation mechanism of nodular corrosion spots. The researches have reported that the formation of nodules in zirconium alloys depends upon a number of factors, such as the size and the distribution of second phase particles [[8], [9], [10], [11], [12], [13]], the crystal structure of oxide [[14], [15], [16]], heat treatment [[17], [18], [19]], alloying elements (Y, Nb, Fe, ect) [[20], [21], [22], [23], [24]], hydrogen pickup [25,26] and the orientation of grain [[27], [28], [29]]. Many studies focused on the relationship between the crystal orientation and anisotropic growth of oxide layers. For example, the corrosion rate on the planes {10-14} and {10-12} was found to be faster than other planes [28]. As an important factor, Zhou et al. [30,31] reported that the orientation of grain has a close relationship with the nodules formation in Zr-4 alloys. However, in case of polycrystalline materials, the effect of preferred orientation of grains on the corrosion behavior remained complex. Moreover, the relationship between microtexture and nodules formation is hardly reported.
In the present research, the Zr-4 samples were cut from Zr-4 alloy tube and corroded in static autoclave with superheated steam at 400℃/10.3 MPa for a period of 3 and 30 days. In this work, a new method has been established to analyze the formation mechanism of nodules in the cross-section (CS) of Zr-4 alloy tube by the EBSD technique. Furthermore, the effect of microtexture on the nodules formation was studied.
2. Experimental and matrix transformation methods
2.1. Experimental methods
The as-cast Zr-4 ingot was forged in β phase field (1000℃), followed by water quenching. Then, the tube blank (80 mm in external diameter and 20 mm in wall thickness) was obtained by hot extrusion. After that, the Zr-4 tube blank went through the cold pilger rolling (rolling speed 80 r/min, with the feed rate of 3 mm/cycle.), and annealed at 630℃ for 3 h. The external diameter of the cold pilger rolled Zr-4 alloy tube was 60 mm, and the wall thickness was 10 mm. Then, zircaloy-4 specimens were cut from tube, as the schematic diagram of sampling shows (Fig. 1). The specimens were ground by 150, 320, 800, 2000 grit SiC papers, and immersed into the 10%HF + 30%HNO3 + 30%H2SO4 + 30%H2O (in volume fraction), cleaned in tap water and boiling deionized water and then dried in air. Then, two pieces of the specimens were corroded in static autoclave with superheated steam at 400℃/10.3 MPa for 3 and 30 days, respectively. The corroded specimens were taken out from the static autoclave in fixed interval.
Fig. 1.

Fig. 1.
The schematic diagram of specimen. RD, TD and AD indicate the radial direction, tangential direction and axial direction, respectively.
MERLIN Compact scanning electron microscope (SEM) was used to observe the oxide layers formed on the CS. For EBSD analysis, the samples were mechanically polished followed by electro-polishing in a solution of 10 vol%HClO4 + 90 vol%C2H5OH at about -100℃ with 60 V for 8 min; the corroded samples were cut by ion etching method using LEICA EM RES101. Texture analysis was carried out on MERLIN Compact SEM equipped with electron backscattered diffraction detector and the crystallographic orientation images were obtained using HKL® Channel5 software.
2.2. Matrix transformation methods
The crystal orientation information obtained by the EBSD system is mainly obtained by processing the Euler angle information of crystal through the CHANNEL5 software system. The HKL CHANNEL5 software processes the Euler angle data collected during the EBSD scan and outputs the crystal orientation information. The formation of Euler angles is shown in Fig. 2. Initially, the crystal coordinate system and sample coordinate system coincide, denoted as x0y0z0. Firstly, rotation of an angle of φ1 is executed around z-axis to form the x1y1z1 coordinate system, where x-x1, y-y1 are coplanar. Then, rotation of an angle of Φ around x1-axis is performed to form the x1y2z' coordinate system and the Ox1y1 plane becomes Ox1y2 plane. An intersecting line ON is drawn which is perpendicular to four axis (y1, y2, z, z'), the four axis coplanar. Final rotation of an angle of φ2 around z'-axis brings about x'y'z' coordinate system.
Fig. 2.

Fig. 2.
Illustration of the Euler angles (a) and the successive rotations, each specifying an orientation through the Euler angles (b).
The formation of three Euler angles can be expressed as matrices M1, M2 and M3, as formulaes (1), (2), (3) [32]:
Combining the three matrices (M1, M2 and M3) yields the transformation matrix M, as given in Eq. (4) [32,33]. From the Eq. (4), the sample coordinate system and the crystal coordinate system can be inter-converted by matrix M. The schematic diagram of the relation between sample coordinate system and crystal coordinate system is shown in Fig. 3. In Fig. 3(b), the normal direction of the crystal plane was denoted by red arrows. As α + θ = 90°, the angle θ or α can be measured directly. In Fig. 3(a), the observation direction is along the Z-axis, therefore the angle β equals 90°, and the normal direction of the crystal plane can be expressed as F(α,0) or [XYZ]. The direction [XYZ] can be calculated by using the Eq. (5).
Fig. 3.

Fig. 3.
A schematic diagram of the relationship between the sample coordinate system and crystal coordinate system; (a) sample coordinate system. (b) the relationship between sample coordinate system and crystal coordinate system. (c) crystal coordinate system.
In EBSD system, the a2 and c axis of crystal coordinate system were parallel to the X and Z axis of sample coordinate system, shown in Fig. 3(a and c). Hence, the correction matrix T can be expressed as Eq. (6). The Eq. (7) can be deduced for inter-conversion of the sample coordinate system and crystal coordinate system. The crystallographic direction [UVW] can be converted into four-index system as [uvtw] by using the formula (8).
For the HCP crystal structure, the normal direction [uvtw] of the crystal plane {hkil} can be given by the expression:
where the a/c axial ratio is 1/1.593 for Zr. Combining the equations (1), (2), (3), (4), (5), (6), (7), (8), (9), the crystal indices of {hkil} can be given as:
3. Results
3.1. Texture characteristics of outer and inner walls of the tube
The inverse pole figures (IPF) map, pole figures and three-dimensional (3-D) schematic diagrams of the major crystal orientations of the outer and inner walls of the uncorroded Zr-4 alloy tube are shown in Fig. 4. In Fig. 4(a, b), the grain size of the inner wall of the tube was larger than the outer wall. The average grain size of the outer and inner walls of the Zr-4 alloy tube were about 3.15 and 4.58 μm in diameter, respectively. From Fig. 4(c, d), it can be observed that a large number of $\{11\bar{2}0\}$ planes in the outer and inner walls were parallel to the RD, since the pole exists in the centre of $\{11\bar{2}0\}$ pole figure. However, most of the outer wall grains had the c-axis perpendicular to the AD, but the c-axis of the inner wall grains resided nearly 35° and 48° away from the TD, as shown in Fig. 4(c-f). In other words, the grain size and microtexture varied from outer to inner wall after pilger rolling.
Fig. 4.

Fig. 4.
(a, b) IPF maps of the grains in the outer and inner walls of the Zr-4 alloy tube, respectively. (b, d) the {0001}, $\{11\bar{2}0\}$ and $\{10\bar{1}0\}$ pole figures of (a, b), respectively. (e, f) the three-dimensional (3-D) model of the main crystal orientation of the outer and inner walls of the Zr-4 alloy tube, respectively.
3.2. SEM result of the CS
Only the SEM micrographs of CS are shown in this article since the corrosion behavior of suface (SRD) was nearly the same as that of CS. The SRD is perpendicular to RD. Fig. 5 shows the SEM morphologies of the oxide films formed on the CS of the Zr-4 alloy tube after corroded for 3 and 30 days. Small cracks in the CS can be seen in Fig. 5(a-b) where width and thickness of corrosion layer were measured to be approximately 50 and 6 μm, respectively, i.e. after 3 days the thickness of corrosion layer was of the order of one grain diameter (near 3 μm) and the morphology could be regarded as nodules. In Fig. 5(c-d), the width and thickness of the wide nodules (after 30 days) were estimated to be 360 and 24 μm, respectively, i.e. nearly 4 times of the size of nodules formed after 3 days of corrosion. In other words, the tube had corroded at least three layers of grains (near 12 μm) after corrosion for 30 days. In addition, it can be observed that a large number of cracks were observed in nodular oxide, while few cracks were observed in uniform oxide (Fig. 5b). Meanwhile, it can also be noticed that the narrow nodules ①, ② and ③ blended into each other and formed a larger nodule (Fig. 5a).
Fig. 5.

Fig. 5.
The SEM micrographs of the oxide film formed on the CS of Zr-4 alloy tube after exposure to corrosion environment for 3 days (a and b) and 30 days (c and d).
3.3. Texture characteristics of the CS after 3 days of corrosion
The EBSD observation region was chosen in the CS near the outer wall of the Zr-4 alloy tube which included the nodular and uniform corrosion region after corrosion for 3 days. The IPF map, phase distribution map, pole figures and three-dimensional (3-D) schematic diagrams of the main crystal orientation in the CS are shown in Fig. 6. In Fig. 6(a), it can be observed that the grain size was increased from outer to inner walls of the Zr-4 alloy tube, as the yellow arrow shows in (a), which is consistent with the result of Fig. 4. From Fig. 6(b), the grains in the CS were recrystallized in α phase. In addition, high pole density in the center of $\{11\bar{2}0\}$ and $\{10\bar{1}0\}$ pole figures shows that a large number of $\{11\bar{2}0\}$ and $\{10\bar{1}0\}$ planes were perpendicular to the AD in the CS, as shown in (c-d). However, the c-axis of the most grains in the CS was not parallel to the TD (near 26° and 54° away from the TD). Alternatively, the microtexture varied from the outer to inner wall of the Zr-4 alloy tube.
Fig. 6.

Fig. 6.
(a) Combination of IPF map and SEM image of grains in the CS. (b) Combination of phase map and SEM image of grains in the CS. (c) 3-D schematic diagrams of the main crystal orientation in the CS. (d) {0001}, $\{11\bar{2}0\}$ and $\{10\bar{1}0\}$ pole figures of α-Zr grains in the CS, respectively.
4. Discussion
4.1. The formation of larger nodules
The preferred grain orientations and corrosion behavior of the Zr-4 alloy tube were combined schematically in Fig. 7 in order to further elaborate the nodular corrosion process of the CS. In Fig. 7, it can be observed that the cracks were formed in the oxide layers of both samples. The cracks possibly formed due to different oxidation kinetics of matrix and second phase particles which developed stresses in the oxide layer. With the increasing of oxide thickness, the stress increased in the oxide film [[34], [35], [36], [37]]. The formation of cracks can be an evidence of stress relaxation in oxide. Furthermore, the oxidation of second phase particles could lead to the formation of tensile stress (perpendicular to the growth direction of oxide film) in matrix, which resulted in the formation of cracks parallel to the metal/oxide (MO) interface [[8], [9], [10],13,[38], [39], [40]]. Thus, it can be deduced that the cracks are nearly parallel to MO interface due to the tensile stress in oxide layer, which will increase the corrosion rate along the MO interface. It is consistent with the references [37,39,39,40]. Owing to the formation of cracks parallel to the MO interface, the matrix was oxidized faster along TD than RD. According to the SEM results, it can be observed that the multiple narrow nodules blended into each other, resulting in a larger nodule. The cracks play an important role to promote blending of the narrow nodules. Hence, it can be speculated that the wide nodules evolved from the narrow nodules as the oxidation time was prolonged.
Fig. 7.

Fig. 7.
Schematic diagram of the wide nodules formation in the CS of Zr-4 alloy tube with corrosion time.
4.2. The effect of microtexture on the nodular and uniform corrosion region
According to the result of Fig. 4, it can be found that the grain size as well as microtexture varied from the outer to inner walls of Zr-4 alloy tube. The outer wall had undergone severe deformation as compared to the inner wall, thus, the grain size was increased from the outer to inner walls after cold rolling. In addition, many studies have reported that the grain orientation would affect the anisotropic growth of oxide layers [[27], [28], [29], [30], [31]]. Combining the SEM result, near four layers of grains (12 μm) under the nodular and uniform regions (3 days) were chosen to analyze the effect of microtexture, as shown in Fig. 8.
Fig. 8.

Fig. 8.
(a, b) Combination of IPF map and SEM image of the CS in oxidized Zircaloy-4 sample; (c, d) pole figures of (a and b), respectively; (e) three-dimensional schematic diagrams of the main crystal orientation in CS; (f) three- dimensional schematic diagram of green plane perpendicular to the Y direction (yellow arrow), Y direction belongs to the sample coordinate system.
In Fig. 8, it can be observed that the microtexture under the nodular and uniform regions was different. In nodular corrosion region, the angles between c-axis of main crystal orientation and TD were 26°, 48°, 54° and 64.3° (Fig. 8c), respectively. However, the angles between c-axis of main crystal orientation and TD were only 37.8° and 80° in the uniform corrosion region (Fig. 8d). Hence, different microtexture in nodular and uniform corrosion regions maybe played an important role in the formation of wide nodules from 3 to 30 days. Moreover, according to the matrix transformation method, it can be deduced that when calculated direction was parallel to the Y direction (sample coordinate system), the green plane was the calculated plane, as shown in Fig. 8(f). Furthermore, for the angles 0°, 26°, 48° and 90°, the calculated planes were $\{10\bar{1}0\}$, near $\{10\bar{1}2\}$, near $\{10\bar{1}4\}$ and {0001}, respectively.
According to the result of Fig. 5, it can be found that only one layer of grains (near 3 μm) were corroded after 3 days. Thus, the grains in the first layer were selected to characterize the effect of microtexture. The relationship between the thickness of oxide and crystal orientation was shown in Fig. 9. In Fig. 9, it can be observed that the microtexture of the first layer of grains was different in the nodular and uniform regions. The thickness of oxide layer (nodular corrosion region) was detected on the grains with c-axis distributed in the range of 40° around TD (Fig. 9 c), which was close to the study by Zhou et al. [31]. However, the thin oxide layer (uniform corrosion region) was detected on the grains with c-axis distributed in the range of 68° around TD (Fig. 9d). Meanwhile, it can be found that the different crystal planes have the different corrosion rate, in particular, the high corrosion rate planes (grains 1-21# in nodular region) as shown in Figs. 9(e). Hence, the formation of nodules was related to the crystal orientation.
Fig. 9.
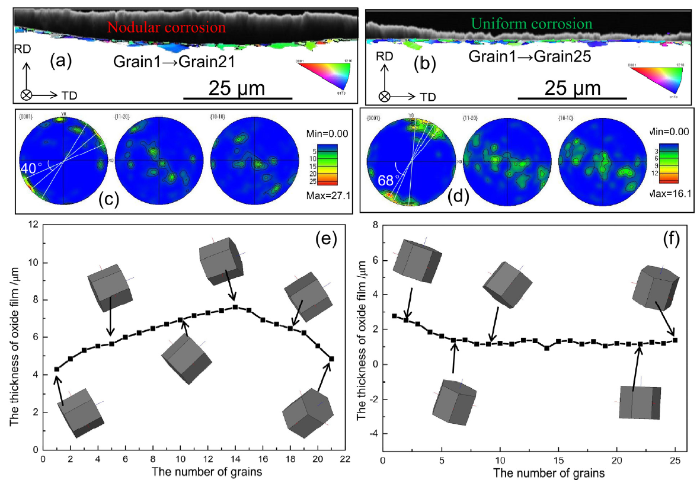
Fig. 9.
(a, b) Combination of IPF map and SEM image of nodular and uniform corrosion region in the CS of the oxidized Zircaloy-4 sample, respectively; (c, d) pole figures of the grains in (a, b), respectively; (e, f) the thickness of oxide film and three-dimensional schematic diagram of grains in the nodular and uniform corrosion region, respectively.
4.3. The anisotropic growth of oxide layers
In order to deeply understand the effect of microtexture on the formation mechanism of nodules, an inverse pole figure Y (IPFY) (Fig. 10) was developed depicting all the 21 and 25 planes in the nodular and uniform corrosion region based on the matrix transformation method and EBSD result. In Fig. 10, it can be observed that the thickness of oxide layer was divided into two ranges, 0.92-2.76 μm (uniform corrosion region) and 4.3-7.6 μm (nodular corrosion region), respectively. It is clear that the orientation of the crystal planes were different in the nodular and uniform corrosion region. Alternatively, different crystal planes corresponded to the different thickness of oxide layer (Fig. 9). Hence, the anisotropic growth of oxide layer was caused by the different orientation of crystal planes such as the grains (1-21#) in nodular corrosion region. According to the result of Fig. 9, it can be found that the microtexture was associated to these grains (1-21#) under nodular corrosion region. Thus, it can be concluded that the anisotropic growth of oxide layer was caused by the change of microtexture of the Zr-4 alloy tube, and this anisotropic growth of oxide layer contributed to the nodules formation.
Fig. 10.

Fig. 10.
The relationship between the thickness of oxide layer and the crystal orientation in Zr-4 alloy tube. Different color and shape of the markers in the inverse pole figure denote the different grains. Two lines with different thickness are used to link the markers having a same range of oxide layer thickness.
5. Conclusions
In summary, the influence of microtexture on the formation mechanism of nodules in Zr-4 alloy tube was systematically studied by matrix transformation method and EBSD technique. Our study reveals that the microtexture was different over the uniform and nodular corrosion regions. Major conclusions obtained are:
(1) The microtexture in the nodular corrosion region favored the corrosion rate. The thick of oxide layer (nodular corrosion region) was detected on the grains with c-axis distributed in the range of 40° around TD. The thin oxide layer (uniform corrosion region) was detected on the grains with c-axis distributed in the range of 68° around TD.
(2) The thickness of oxide layer in uniform and nodular corrosion regions was divided into two ranges of 0.92-2.76 μm and 4.3-7.6 μm, respectively.
(3) Anisotropic growth of oxide layers was existed in nodular corrosion region. The anisotropic growth of oxide layer was caused by the change of microtexture of the Zr-4 alloy tube, and this anisotropic growth of oxide layer contributed to the nodules formation.
Reference

 WeChat