

1. Introduction
Laser-powder bed fusion (L-PBF) is a newly developed additive manufacture (AM) technology, also known as selective laser melting (SLM). As a layer-wise manufacturing process, selective laser melting is developed from the selective laser sintering (SLS) [1]. L-PBF method could fabricate complex components with high accuracy that can hardly be achieved by conventional ways such as casting and forging [2]. Consequently, L-PBF technology has a good prospect of being popularized in a wide range of industries, such as nuclear plants [3], medicine implant [4,5], aerospace [6,7] and so forth.
Plentiful investigations concerning the effects of process parameters [5], heating of the building platform [9], building orientation [10,11], part placement strategy [12], post-treatment [13,14], etc. on the mechanical behavior of L-PBF materials. At the same time, the laser scan strategy also determines the microstructures as well as mechanical properties of L-PBF parts. Different combination of strength and elongation of L-PBF Ai-12Si were achieved by alternating laser scan strategy [15]. Gu et al. [16] found improved overlapping regions by employing stagger laser scan strategy. Metallic parts with refined microstructures can be obtained by laser-powder bed fusion (L-PBF) technology exhibit comparable or even enhanced quasi-static mechanical properties by contrast with counterparts fabricated by conventional ways [17,18]. However, fatigue resistance is still the major challenge against widespread acceptation of L-PBF parts [19]. Distinct from fracture under quasi-static loading, fatigue failure occurred under cyclic loading is a progressive and localized phenomenon that has great relevance with inhomogeneous microstructures and impurities (inclusions, porosity and second phase). L-PBF process utilize laser beams to melt and consolidate metallic powders to form parts and the process is similar to powder metallurgy (PM). As a consequence, defects are generally observed in L-PBF materials. Defects in L-PBF can be categorized as porosity (keyhole and balling) and cracking (solidification crack and liquation crack) [20], which cause stress concentration and lead to premature failure under cyclic loading. Moreover, interactions between high-energy laser beam and metallic powders during L-PBF induced unfamiliar microstructures, such as cellular structures [[21], [22], [23], [24], [25]] and melt pool boundaries (MPBs) [26]. The cellular structure has been proposed to be dislocation tangles associated with segregation element of Mo and Cr [27], which maintains its shape and slows down the ambulation of dislocation. Solute segregation along cellular-structure walls can also promote twinning and gain pinning of dislocations [28]. The anisotropic tensile properties of L-PBF parts derive from slipping from MPBs [29], the vertically built sample shows higher elongation to failure due to more slipping surface per unit length during tensile tests.
Powder-heat source interactions and the layer by layer nature of additive manufacturing also result in a vast number of deposited tracks or layers that are subjected to repetitious heating and re-melting during the build, creating susceptibility to defects such as porosity, lack of fusion, all of which could serve as fatigue crack initiation sites and influence fatigue damage behavior dramatically.
To sum up, multitudinous studies focus on the relationship between mechanical behavior and process parameters (laser power, hatching space, laser velocity, etc.). however, little previous studies pay much attention to the effect of laser scan strategy on fatigue performance of L-PBF 316 L stainless steel, as well as the fatigue crack initiation and propagation process interact with typical nonequilibrium solidification-induced features (nanoscale cellular networks and melt pool boundaries). Therefore, in this study, the fatigue behavior of 316 L stainless steel samples fabricated via different laser strategy (zigzag strategy and cross-hatching strategy) was studied. The microstructure features of L-PBF 316 L stainless steel and the influences on fatigue behavior were analyzed and discussed.
2. Materials and methods
2.1. Austenitic stainless steel powder
AISI 316 L stainless steel powders (EOS Finland, Turku, Finland) were gas atomized to obtain a predominant spherical morphology and good flowability. The median diameter of raw powders is 25 μm. The morphology and cross-section of raw powders are illustrated in Fig. 1(a) and (b). The chemical composition of virgin austenitic powders is given in Table 1.
Fig. 1.

Fig. 1.
Micromorphologies of 316 L stainless steel powders: (a) dispersive distributed powders; (b) cross-section of a single powder with a diameter of 30 μm; (c) schematic of the laser scan strategies: scanning direction rotated 67° between successive layer (cross-hatching sample) and laser scanning without rotation (zigzag sample); (d) illustration of sampling direction and build direction, outline dimensional drawing of specimens for mechanical tests.
Table 1 Chemical composition of raw 316 L stainless steel powder (wt%).
| Cr | Mo | Ni | Mn | C | Si | P | N | Fe |
|---|---|---|---|---|---|---|---|---|
| 17.49 | 2.36 | 12.84 | 0.47 | 0.01 | 0.41 | 0.013 | 0.09 | Bal. |
2.2. L-PBF fabrication process
The specimens for mechanical tests were fabricated by EOSINT M 280 system (EOS GmbH, Krailling, Germany) equipped with a continuous wave Nd: YAG fiber laser with a wavelength of 1060 nm and the diameter of local spot size is 70 μm. The volume energy density (VED) of laser power employed was approximately 110 J mm-3. To ensure the 316 L stainless steel could be densely formed, laser parameters of L-PBF process were verified by metallographic examination and measurement of density by Archimedes method. The laser power was 195 W, the scan speed of the laser beam was 1083 mm/s, the powder thickness was 20 μm, the hatch distance was 90 μm. Two laser scan strategies, laser scan direction rotated 67° between successive layer (cross-hatching strategy) and without rotation (zigzag strategy), were employed in this study. The two laser scan strategies were illustrated in Fig. 1(c). The loading direction was perpendicular to building direction as illustrated in Fig.1d. It should be noted that cutting the samples from build platform relieved the residual stress and eliminated the influence of residual stress on fatigue performance.
2.3. Mechanical tests
Specimens for tensile and fatigue tests were cut into a dog-bone shape by electric discharge machining with gauge dimensions of 10 mm × 6 mm × 5 mm as specified in Fig. 1(d). The strain rate of tensile tests was 10-3 s-1. The total stress-controlled axial fatigue tests were carried out on an Instron 8801 machine with a frequency of 30 Hz and the mean stress equal zero (stress ratio R=‐1). Before mechanical tests, all specimens were ground and electro-polished in a solution of 90% ethyl alcohol plus 10% perchloric acid under a voltage of 20 V for 45 s, in order to generate a scratch-free and stress-free surface. Both tensile and fatigue tests were carried out at room temperature.
2.4. Characterization
A TESCAN MIRA 3LMH scanning electron microscope (SEM, TESCAN, Brno, Czech Republic), equipped with an electron backscatter diffraction (EBSD) detector (Oxford Instruments, Oxford, UK), and HKL Nordlys orientation imaging microscope system was employed to characterize the morphology of precursor metallic powders, microstructures of as-built specimen, grains orientation features, surface deformation and fracture surface of specimens after mechanical tests.
3. Results and discussion
3.1. Hierarchical microstructures
The inhomogeneous microstructures of laser-powder bed fusion 316 L stainless steel are displayed in Fig. 2. As shown in Fig. 2(a), the formation of the micrometer-scale melt pool on account of the energy distribution of a Gaussian laser beam and result in the typical half-cylindrical contours. Fig. 2(b) shows the morphology of cellular structure on both sides of the melt pool boundary, it is found that cells grow directly from the melt boundary without forming a planar zone. However, this observation has a difference with the study in Ref. [30], an obvious planar growth mode occurred and then transited to cellular/dendritic mode when grains developed at the bottom of the melt pool. In this study, the laser beam velocity is sufficiently high during L-PBF process that planar growth condition is not favorable. The morphology of cells on both sides of the melt pool boundary is different. Irregularity even existed on the morphology cell structure on the same side and no transition areas are observed between cell structures with different configurations. Fig. 2(c) shows the longitudinal cross-section of the ZZ sample. The morphology of the melt pools of the ZZ sample in each layer is nearly the same due to unchanged laser scan direction as well as the similar temperature field. At the same time, coarse columnar grain grew cross several layers could be observed in the ZZ sample, as shown in Fig. 2(d). The long axis direction of the columnar grain is approximately parallel to build direction and the width of columnar grain is tens of micron.
Fig. 2.

Fig. 2.
Rapid solidification-resultant microstructures of laser-powder bed fusion 316 L stainless steel: (a) longitudinal cross-section of the CH sample; (b) melt pool boundary and cellular structures; (c) longitudinal cross-section of the ZZ sample; (d) columnar grain.
Fig. 3 shows the grain morphology and distribution characteristic on the top side of L-PBF 316 L stainless steel fabricated via different laser scan strategies: laser scan direction rotated 0° (ZZ sample, Fig. 3(a) and (c)) and 67° (CH sample, Fig. 3(b) and (d)) between successive layer. Neatly grains arrange along the central region of laser track and a large number of small grains with arbitrary shape located the edge region of melt track due to complex local temperature gradient and re-melting of adjacent fusion track [31], the length between two laser tracks is approximately equal to hatching space, as shown in Fig. 3(a). Complicated thermal history is induced by employing layer-wise rotated laser scanning strategy during the L-PBF process. As shown in Fig. 3(b), the grains are completely randomly distributed, the size and shape are also disorderly. Due to the layer-wise build process of L-PBF, there exists an inherent nature of heat flow, in the opposite direction to build direction, which leads to a significant tendency of epitaxial growth of grains. Fig. 3(c) and (d) indicates the microstructures as well as their distribution on the lateral side of the ZZ and CH samples. In the ZZ sample, elongated columnar grains with a length of up to ~ 1 mm are found arranged parallel to the building direction, which becomes more fragmentary in CH sample because the rotation of the laser scan direction between successive layer led to complex thermal history. The grain size of the CH and ZZ samples are 12.17 μm and 21.30 μm measured by linear intercept method in Fig. 3(a) and (b), the intercept lines are perpendicular to build direction.
Fig. 3.

Fig. 3.
Inverse pole figures (IPF) showing grain morphology and orientation of L-PBF 316 L stainless steel sample fabricated via different laser scanning strategy: (a) top side of the ZZ sample; (b) top side of the CH sample; (c) lateral side of the ZZ sample; (d) lateral side of the CH sample.
Low-angle grain boundaries (LAGBs) and high-angle grain boundaries (HAGBs) superimposed are shown in Fig. 4. As shown in Fig. 4(a) and (b), the L-PBF 316 L SS contains a large fraction of LAGBs. According to the measurement of the local average misorientation (LAM), as shown in Fig. 4(c) and (d): LAGBs account for 47.71% and 48.72% of total GBs in the CH and ZZ samples. It can be seen that the existence of the LAGBs is an intrinsic feature of the L-PBF 316 L SS, and its content does not change significantly with the change of the scanning strategy. However, by comparing the morphology of grain boundaries in the two samples, it can be found that the distribution of LAGBs in the CH sample is similar to that of the HAGBs, and exhibits an irregular distribution; while in the ZZ sample, the LAGBs and HAGBs all show a relatively regular distribution. There are a large number of GBs entanglements (including LAGBs and HAGBs) at the overlapping of the melt tracks. The LAGBs and HAGBs inside the melt pool both exist in a form perpendicular to the scanning direction.
Fig. 4.

Fig. 4.
EBSD images with low-angle grain boundaries (LAGBs, 5°-15°, red line) and high-angle grain boundaries (HAGBs, >15°, blue line) of L-PBF 316 L stainless steel fabricated with two laser scan strategy: (a) top side of the CH sample; (b) top side of the ZZ sample; misorientation distribution of (c) the CH sample and (d) the ZZ sample.
3.2. Mechanical properties
Fig. 5 shows the stress-strain curves of CH and ZZ sample. The tensile properties of CH and ZZ samples were given in Table 2. The number of cycles to failure against stress amplitude in double logarithmic coordinate, i.e. the S-N curves are presented in Fig. 5. In high-cycle regions (number of cycles to failure > 105), the CH sample shows enhanced fatigue strength than the zigzag sample, the fatigue limits for the CH and ZZ samples are 230 MPa and 190 MPa, respectively. The S-N curves indicate that the CH sample has a higher fatigue limit than the ZZ sample, even though the ZZ sample has an enhanced fatigue strength in low-cycle regions (stress amplitude>350 MPa). The higher fatigue strength of the ZZ sample could be explained by the Basquin equation, the fatigue strength is primarily determined by monotonic strength under high-stress amplitude [32]. On the other hand, process-induced defects play an essential role in the fatigue strength at low stress amplitude, the fatigue initiation site, and fatigue crack initiation mechanism would be discussed in the following section.
Fig. 5.

Fig. 5.
Engineering stress-strain curves of CH and ZZ sample.
Table 2 Tensile properties of L-PBF 316 SS fabricated by different lasser scan strategies.
| Sample | Ultimate tensile strength (MPa) | Elongation to failure (%) |
|---|---|---|
| CH | 680.8 | 44.3 |
| ZZ | 705.5 | 46.3 |
Fig. 6 shows the S-N curves of the CH sample in this study and 316 L SS fabricated with other conventional methods. It can be seen that the fatigue performance of L-PBF 316 L SS is better than that of the coarse-grain 316 L stainless steel and satisfying the ASME fatigue design curve. The result indicates that the fabrication of 316 L SS with superior fatigue property could be achieved by the L-PBF technology.
Fig. 6.
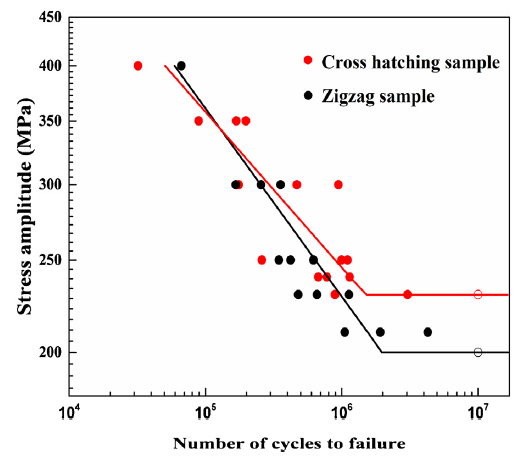
Fig. 6.
S-N curves of L-PBF 316 L stainless steel fabricated with different laser scan strategies.
3.3. Fatigue damage morphologies
Surface damage morphologies near fatigue fracture surface of the ZZ and CH samples cyclically deformed at various stress amplitudes are shown in Fig. 7, it can be seen that the fatigue cracks generally initiate from persistent slip bands (PSBs) or grain boundaries (GBs) after certain fatigue cycles. Slip band (SB) traces with intrusions and extrusions on the surface of the ZZ and CH samples are shown in Fig. 7(a) and (d). Primary slip bands are activated in adjacent grains with different orientations and GBs definitely block the propagation of PSBs. As shown in Fig. 7(b), fatigue crack initiated from the well-developed SBs on the surface of the ZZ sample and the crack propagated along with the slip band. However, crack initiated from SBs on the surface and propagate away from the slip direction, as shown in Fig. 7(e). GBs cracking morphologies are shown in Fig. 7(c) and (f). The fatigue crack connected the SB and GB and extend along a GB (Fig. 7(c)). Due to the shear and impingement effect of PSBs on GBs [35], straight and curved GB cracks are observed in Fig. 7(f).
Fig. 7.

The grain size determines the extent of strain localization and the slip length. As mentioned in Section 3.1, the grain size of the CH sample is smaller than that of the ZZ sample. The CH sample with smaller grain size tends to reduce the slip length and might lead to a higher fatigue strength of CH sample.
Interactions of particular rapid solidification-induced microstructures, such as MPBs and cellular networks, with PSBs as well as the fatigue cracks, are shown in Fig. 8. The nucleation of fatigue cracks on GB due to the pilling-up of dislocations could be observed. Meanwhile, the slip could transfer through melt pool boundaries continuously. Further observations reveal the slip deformation and fatigue cracking morphologies on the surface of L-PBF 316 L SS after cyclic deformation, as shown in Fig. 9. As shown in Fig. 9(a), primary slip bands activate inside the adjacent grains and transfer through the whole grain, and the movement of PSBs terminates at the GB. However, the PSBs could transfer through the melt pool boundary continuously, as shown in Fig. 9(b). Fig. 9(c) and (d) shows the fatigue cracking along PSBs and no fatigue crack nucleated along the melt pool boundary.
Fig. 8.

Fig. 8.
SEM images of fatigue damage morphologies on the surface of L-PBF 316 L SS: (a-c) ZZ sample (Δσ/2 = 230 MPa, Nf = 1,129,430.25 cycles); (d-f) CH sample (Δσ/2 = 400 MPa, Nf = 32,032.25 cycles).
Fig. 9.

Fig. 9.
Typical interfaces of L-PBF 316 L SS and fatigue damage morphology (ZZ sample, Δσ/2 = 400 MPa, Nf = 66,503.25 cycles).
Interfacial energy and strain incompatibility can reflect the ability of different types of interfaces to resist fatigue crack initiation [36]. SBs beside the melt pool boundary have a noticeable one-to-one correspondence across the melt pool boundary, demonstrating SBs could transfer through the MPB consecutively and good strain compatibility approaching the melt pool boundary. The degree of difficulty of slipping through the interface can be defined by the residual dislocations [37,38]:
where Δb1 and Δb2 are the vectors of the primary slip system in the grains on both sides of the interface. The value of Δb reflects the degree of obstruction of the interface for slip, and the smaller the value of Δb, the easier the PSBs transfer through the interface. The value of Δb actually depends on the misorientation of the interface.
In the L-PBF 316 L stainless steel, due to the existence of the epitaxial growth mechanism, the grain orientation difference between the two sides of the MPB is extremely small, so the melt pool exhibits better strain compatibility at the interface. Interactions of the PSBs with GB and MPB are illustrated in Fig. 10, the GB impedes the dislocation slip and PSBs could transfer through the MPB. Thus, MPB would not be the site for fatigue crack nucleation due to the disappearance of pilling-up of dislocations.
Fig. 10.

Fig. 10.
Slip morphologies on the surface of fatigued CH sample (Δσ/2 = 300 MPa, Nf = 468,790 cycles) beside the (a) grain boundary and (b) melt pool boundary; (c) fatigue cracking along PSB; (d) fatigue cracking near the melt pool boundary. The black arrow indicates the PSB cracking.
3.4. Fatigue cracking mechanism
Fig. 11 shows the representative fracture surfaces of the CH and ZZ samples fatigued at constant stress amplitude (Δσ/2) of 230 MPa. Fatigue crack initiation site, fatigue crack propagation region and instant rupture area can be manifestly distinguished on the fracture surface. Obviously, the fatigue cracks initiated from the surface or sub-surface of both samples; however, the fatigue initiation mechanism is different for these two samples atr the same stress amplitude. For the CH sample, the fatigue crack initiated from the surface of the specimen and intragranular fracture morphology could be observed at the fatigue crack initiation site. Meanwhile, fatigue crack of the ZZ sample initiated from a defect near the surface of the specimen. As is well known, PSBs/GBs and defects representatively compete together for initiating fatigue cracks by providing local strain concentration under cyclic loading. In the absence of dehiscent or debonded second phase particles/inclusions and pre-existing defects, the process of fatigue crack formation involves the localization of irreversible plastic strain within PSBs that normally lead to either the formation of intrusions/extrusions at surface grains or their impingement/shear effect on GBs. However, premature failure caused by process-induced defects seems to be the most fatigue life-limiting failure mechanism for L-PBF materials [11,39,40]. Laser scan strategy influences the defects formation and results in distinct fatigue performance of the ZZ and CH samples in high-cycle fatigue (HCF) regime. The influence of laser scan strategy on defect formation would be discussed in more detail later.
Fig. 11.

Fig. 11.
Illustration of the persistent slip bands (PSBs) morphology near the interface: (a) impingement and shear of PSBs on grain boundary (GB); (b) PSBs transfer through melt pool boundary (MPB).
Total fatigue lifetime and SEM images of fatigue crack initiation area of the ZZ and CH samples at stress amplitude of 230 MPa are shown in Fig. 12. Fatigue crack of the ZZ sample initiated from process-induced defect results in a dramatic decrease of the fatigue lifetime compared with fatigue cracks of the CH sample initiated from PSBs at the same stress amplitude (Δσ/2 = 230 MPa). As mentioned previously, the ZZ sample exhibits enhanced fatigue strength in low-cycle fatigue (LCF) regime while the CH sample exhibits enhanced fatigue strength in HCF regime. For the LCF regime (stress amplitude > 350 MPa in this study), the fatigue behavior principally is dependent on monotonic strength and not sensitive to pore defects. Nevertheless, in the HCF regime, crack initiation stage accounts for the most fatigue life (nearly 90%) of total fatigue lifetime [41], sensitivity to defects is more pronounced when compared to the LCF regime. In the HCF regime, fatigue crack of the ZZ sample preferentially initiated from process-induced defects and led to premature failure. Disturbances on oscillation of melt pool stems from comprehensive interplay of Marangoni convection, capillarity, recoil pressure as well as shear effect on gas-melt interface [42] and the formation of defects in L-PBF process is associated with the fluid flow inside the melt pool, Plateau-Rayleigh instability and oscillations of melt pool [[43], [44], [45]]. The pore defects are not completely or are partially filled with powders from the next layer due to the effect of surface tension [46].
Fig. 12.

Fig. 12.
Fractographs of fatigued L-PBF 316 L stainless steel at constant stress amplitude of Δσ/2 = 230 MPa: (a) CH sample, 1,045,360 cycles; (b) magnification of fatigue initiation area in (a); (c) ZZ sample, 480,027 cycles; (d) magnification of fatigue crack initiation area in (c).
Fig. 13.

Fig. 13.
Fatigue life of L-PBF 316 L stainless steel fabricated via different laser scan strategy under stress amplitude (Δσ/2) of 230 MPa.
To put it briefly, the laser scan strategy, on the one hand, determines solidification-resultant microstructures evolution and tensile properties (strength & ductility). On the other hand, it has an influence on the formation/propagation mechanism of pore defects. By employing zigzag strategy, the pore defect might extend over multiple layers and cross-hatching strategy is more effective in inhibiting pore defects by self-closing mechanism [47], which leads to enhanced fatigue strength of the CH sample in HCF regime. The typical defects observed on the surface of ZZ samples were shown in Fig. 14. A general correlation between the maximum size (l0) of non-propagating crack and static strength or hardness was a decrease in the value of l0 with increasing static strength or hardness [48]. This trend implies that with the increase of static strength or hardness, fatigue cracks of high-strength mostly initiate at imperfections such as defects or inclusions, rather than fatigue cracks nucleated at PSBs and GBs. Thus, eliminating imperfections (pore defects and inclusions) in L-PBF process has a high significance in order to obtain improved fatigue property. As shown in Fig. 13, a considerable reduction of fatigue life (number of cycles to failure) of the ZZ sample under constant stress amplitude of 230 MPa may be attributed to the initiation of a fatigue crack from pore defect.
Fig. 14.

Fig. 14.
Typical defects morphologies on the surface of L-PBF 316 L SS fabricated using zigzag strategy (ZZ sample).
4. Conclusion
Different laser scan strategies could modify solidification microstructures and defect characteristics, which are important factors affecting fatigue performance. Comparing with 316 L stainless steel manufactured by the non-rotation laser scanning strategy, the 316 L stainless steel manufactured by the layer-by-layer rotation strategy has fine grain size and fewer defects, resulting in high fatigue strength. In general, there are two competing mechanisms in the fatigue crack initiation of L-PBF 316 L stainless steels: fatigue cracks initiated from defects and fatigue cracks initiated from GBs or PSBs on the surface of the specimen. For the CH sample, fatigue cracks generally initiated from GBs or persistent slip bands (PSBs). However, for the ZZ sample, fatigue cracks initiated from defects at low-stress amplitude was observed. The melt pool boundary, as a unique interface formed during the laser-powder bed fusion process, has good strain compatibility and can be slipped by dislocations, thus would not be the initiation site of fatigue cracks.
Acknowledgments
This work was financially supported by the National Magnetic Confinement Fusion Science Program of China (No. 2014GB117000) and the Joint Funds of the National Natural Science Foundation of China (No. U1605243).
Reference

Methods. A multi-analytical approach has been employed by combining microscopic and bulk compositional tools with electrochemical techniques and chemical analyses of metals in biologically relevant fluids for three differently SLM fabricated CoCrMo alloys and one cast CoCrMo alloy used for comparison.Results. Rapid cooling and strong temperature gradients during laser melting resulted in the formation of a fine cellular structure with cell boundaries enriched in Mo (Co depleted), and suppression of carbide precipitation and formation of a martensitic epsilon (hcp) phase at the surface. These features were shown to decrease the corrosion and metal release susceptibility of the SLM alloys compared with the cast alloy. Unique textures formed in the pattern of the melting pools of the three different laser melted CoCrMo alloys predominantly explain observed small, though significant, differences. The susceptibility for corrosion and metal release increased with an increased number (area) of laser melt pool boundaries.Significance. This study shows that integrative and interdisciplinary studies of microstructural characteristics, corrosion, and metal release are essential to assess and consider during the design and fabrication of CoCrMo dental components of optimal biocompatibility. The reason is that the extent of metal release from CoCrMo is dependent on fabrication procedures. (C) 2014 Academy of Dental Materials. Published by Elsevier Ltd.]]>

 WeChat