Search for articles:
Yaqi Shan , Zengliang Shi
Corresponding authors:
Received: 2019-07-31
Revised: 2019-10-4
Accepted: 2019-10-9
Online: 2020-04-15
Copyright: 2020 Editorial board of Journal of Materials Science & Technology Copyright reserved, Editorial board of Journal of Materials Science & Technology
About authors:
1These authors contributed equally to this work.
More
Abstract
Surface-enhanced Raman spectroscopy (SERS) has been successfully applied to detect various biomolecules, but it is still in challenge to assay living cells or bacteria sensitively, selectively and quantitatively in complex environments. In this paper, 4-ATP and DTNB are assembled on Ag nanoparticle (NP) -decorated poly (styrene-co-acrylic acid) (PSA) nanospheres and then sealed by silica shells to form sensitive SERS labels based on the localized surface plasmon resonance of Ag NPs and large light scattering cross-sections of PSA nanospheres. They are further developed as encoding tags for dual detection of S. aureus and E. coli after assembling corresponding aptamers, which demonstrate ultralow detection limits of 8 cell L-1 for S. aureus and 2 cell L-1 for E. coli. Such a bioassay indicates a point-of-care strategy of ultrasensitively biomedical detections by encoding specific SERS tags.
Keywords:
The rapid, sensitive and accurate detections of cells and bacteria have attracted considerable attention in medical field, because they affect humans, animals and environment almost all the time [1]. Bacteria, such as Staphylococcus aureus (S. typhimurium) and Escherichia coli (E. coli), can lead to the hospital-acquired infections. Therefore, it is crucial to detect them for clinical diagnosis, biomedical research and environmental monitoring, since they have been listed in top five pathogens which caused foodborne illness [2]. Over the past two decades, numerous methods have been developed for the detection of various microbial species, such as polymerase chain reaction [3], enzyme-linked immunosorbent assay [4], fluorescence resonance energy transfer [5], inductively coupled plasma mass spectrometry [6] and colorimetric method [7]. However, they still have shortcomings in simultaneously ultrasensitive detections of multi-analyte in complex environments. Hence, it is essential to develop a simple sensing technology with high stability, sensitivity and specificity for simultaneous multi-analyte detection. In this regards, the surface enhanced Raman spectroscopy (SERS) as ‘whole-organism fingerprinting’ [8,9] can not only identify various biochemical compositions simultaneously, but also possess ultralow detection sensitivity [10].
However, the relatively instability based on SERS immunosensing hinders its promotion in complex environments and clinical diagnosis and affects its sensitivity. In general, to make further advances of SERS probes, one has to face the following two challenges: sensitivity and stability.
Firstly, metal nanostructures with tunable plasmons can be used as SERS active substrates to enhance Raman signal [11,12]. Ravindranath et al. [13] demonstrated that Au, Ag and Ag-Au core-shell nanoparticles can be used to target pathogenic species, and the detection limit ranging between 102 and 103 cfu mL-1. Wang et al. [14] demonstrated that amine-modified gold nanorods can be used for simultaneous detection of E. coli and S. typhimurium pathogens and simultaneous monitoring of bacterial pathogens at concentrations less than 102 cfu mL-1. Secondly, the increment in light scattering cross section is also an effective way to enhance the Raman signal. Poly (styrene-co-acrylic acid) (PSA) nanospheres have special properties, they are monodisperse and their particle size can be easily normalized. In this regards, the uniformity PSA nanospheres can increase the scattering cross section [[15], [16], [17]]. The coincidence of polymer nanospheres with hot spots of SERS can make a detection of few or single molecule possible. Nevertheless, it cannot satisfy the requirements of stability in practice. In response to this question, silica (SiO2) is put forward to offer a high surface area for the derivation of numerous functional groups which adsorbs biomolecules and provide the conditions for encapsulation of SERS encoding molecules [[18], [19], [20]]. The introduction of SiO2 make it possible to detect pathogens in complex environment.
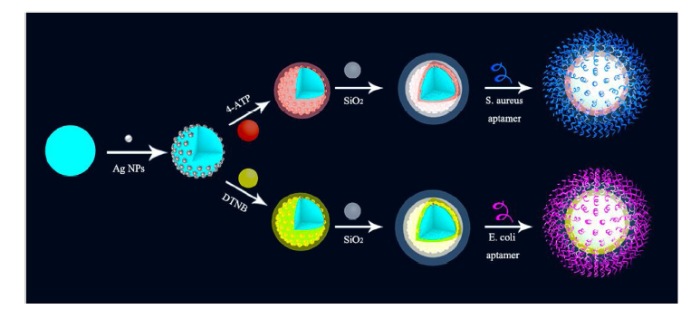
In order to achieve ultrasensitive detection of dual pathogens in complex biomedical environments, as shown in Scheme 1, the PSA nanosphere arrays with Ag NPs have been prepared for intensity enhancement in Raman scattering. The PSA/Ag NPs arrays achieved an enormous enhancement in Raman signals owing to the reasons of high light scattering cross-sections of PSA and local surface plasmon resonance of Ag NPs. The 4-ATP and DTNB have been used as encoded Raman signal molecules. A SiO2 shell prevented the Raman labels from leaching out which can conjugate with any biomolecules. As a proof of concept, we have realized ultrasensitive dual detection of S. aureus and E. coli in complex environments using two types of SERS tags. Our bioassay based on SERS-encoded nanocomposites, set a solid foundation for multiple analyte detection with point-of-care as well as sensitive performances.
Scheme 1. Schematic illustration of dual detection of S. aureus and E. coli based on SERS-encoded nanocomposites.
The acrylic acid (AA), styrene (St), potassium persulfate (KPS), polyvinyl-pyrrolidone (PVP), cetyl trimethyl ammonium bromide (CTAB) and aqueous ammonia solution (NH3⋅H2O) were obtained from Aldrich. The silver nitrate (AgNO3), 3-aminopropyltriethoxysilane(APTES), 5,5′-dithiobis(2-nitrobenzoic acid) (DTNB), 4-aminothiophenol (4-ATP), tetraethoxysilane (TEOS), and anhydrous ethanol were obtained from Shanghai Chemical Reagent Co., Ltd. (3-Glycidyloxypropyl) trimethoxysilane (GPTMS) was purchased from Sigma Aldrich. The carboxylation S. aureus aptamer and carboxylation E. coli aptamers were obtained from Shanghai Sangon Biological Science and Technology Company with following sequences:
S. aureus aptamer: 5′-COOH-GCA ATG GTA CGG TAC TTC CTC GGC ACG TTC TCA GTA GCG CTC GCT GGT CAT CCC ACA GCT ACG TCA AAA GTG CAC GCT ACT TTG CTA A-3′;
E. coli aptamers: 5′-COOH-ATC CGT CAC ACC TGC TCT ACT GGC CGG CTC AGC ATG ACT AAG AAG GAA GTT ATG TGG TGT TGG CTC CCG TAT-3′
The scanning electron microscopy (SEM) pictures were obtained by using a Carl Zeiss Ultra Plus field emission scanning electron microscopy. The transmission electron microscopy (TEM) pictures were captured by using a JEM-2100 F transmission electron microscope with an acceleration voltage of 200 kV. In this analysis, the dispersed samples with suitable concentration were dropped on a carbon-coated copper grid. The UV-vis spectra were recorded by using a Shimadzu UV-2600 spectrometer. The Raman spectra were recorded by using a PeakSeeker Pro 785E Raman spectroscopy system with 20× objective lens, 532 nm laser excitation and 10 s integration time. The infrared spectra were captured from Bruker Tensor 27 FT-IR spectrometer with KBr pellets. The distribution of particle sizes was conducted with Malvern Nano ZS Zetasizer. The crystal structure was recorded with an Ultima IV X-ray diffractometer using CuKα radiation.
In the presence of oxygen atmosphere, the S. aureus, E. coli, Listeria monocytogene, Vibrio Parahemolyticus, Salmonella, Shigella Bogdii and Campylobacter were cultured in Lysogeny broth (LB) about 24 h. The concentration of bacteria was determined by using a flow cytometry. According to our measurements, the concentration of both S. aureus and E. coli is on the order of 1 × 10⁸ cells mL-1.
We improve the quality of synthesized PSA nanospheres based on reported method in Ref. [21]. Firstly, the styrene, AA and H2O were filled into a four-necked flask containing a mechanical agitator and condenser. Secondly, the mixture was purified with N2 for 30 min to get rid of the oxygen. And then it was heated to 70 °C by oil bath. Thirdly, the dissolved KPS in H2O was added into the reaction solution dropwise under stirring until a polymerization was initiated. The polymerization reaction was heated continuously for 6 h. The consequent PSA nanospheres were centrifuged with deionized water for five times. In the end, they were dispersed in water for later use.
A typical procedure for the formation of PSA/Ag NPs composite nanospheres is described here. In the 50 mL one-necked flask, the AgNO3 aqueous solution was mixed with aqueous PSA dispersion. And then the dispersion solution was stirred magnetically about 4 h at room temperature. In the process, the silver ions were absorbed on the surface of PSA nanospheres through electrostatic adsorption between silver ions and carboxyl anions. After that, the PVP as a reducing agent [22] as well as stabilizer was injected into the reaction solution and stirred about more 10 h at 50 °C. The final composites were gathered through centrifugation. It was then redispersed in water for the following analysis.
The 4-ATP and DTNB were used as Raman reporter molecules, which serve as encodes of PSA/Ag NPs. In particular, the PSA/Ag NPs composite materials were added into the compound of ethanol solution, 10 % of APTES and 1 mM 4-ATP or DTNB at 4 °C for 12 h. Then, the resultant compounds were centrifuged with anhydrous ethanol about three times to remove the additional amounts of 4-ATP, DTNB and APTES. After that, the yielded nanospheres were coated with SiO2 by using an improved CTAB template method [23]. The TEOS and CTAB were used as silicon source and structure directing agent, respectively. The composite nanospheres were added into the mixture of CTAB, NH3⋅H2O, ethanol and deionized water. The blended solution was stirred for 0.5 h to constitute a homogeneous solution. In the condition of continuous stirring for 48 h, the TEOS was added to the mixture drop by drop to obtain a PSA/Ag NPs/SiO2 and further functionalized with epoxy groups after the addition of GPTMS in the process described above. Then, the resultant compounds were washed with water or ethanol for several times to remove the additional reagents. Finally, the products were diffused in water for later use.
The epoxylated PSA/Ag NPs/SiO2 composites were dispersed in probe aptamer of phosphate buffer solution (PBS) and stirred with magnetic bar at 25 °C for 4 h. The resulting SERS probes were centrifuged for several times and redispersed in PBS. After that, the products were dispersed in the solution of PBS with NaCl and stored at 4 °C for further usage. Then, the above obtained SERS probes were incubated with target S. aureus and E. coli in bacterial medium for 6 h at room temperature. Ag NPs has very less negative impact on detection due to the presence of a silica isolation layer. After that, the final composites were purified with PBS for several times in order to remove the excess SERS probes that didn’t link with targets and diffused in PBS. The preparation process of SERS probes is shown in Fig. 1.
Fig. 1. Diagrammatic drawing for the preparation process of SERS probe (PSA/Ag NPs/4-ATP/SiO2 and PSA/Ag NPs/DTNB/SiO2).
The PSA nanospheres have been synthesized by using a surfactant-free emulsion polymerization method and their SEM images are depicted in Fig. 2(a), (d) and (g). It shows that the diameter of PSA nanospheres were around 130 nm. Subsequently, using PVP as a reducing agent as well as stabilizer, the Ag NPs have been introduced on the surface of PSA nanospheres to form PSA/Ag NPs composite nanospheres. From the Fig. 2(b), (e) and (h), it can be observed that the particle size of Ag NPs was around 15 nm. In this work, the 4-ATP and DTNB have been selected as encoded Raman reporters to yield large cross-sections in the Raman scattering as well as distinct SERS intensities. Importantly, there is a strong affinity between the functional group of sulfur and the surfaces of Ag NPs. The self-assembled monolayers with encoded Raman reporter molecules were formed on the surfaces of Ag NPs. In the presence of silane coupling agents, they are stable in the subsequent deposition process of silica.
Fig. 2. SEM images of (a) PSA, (b) PSA/Ag NPs, and (c) PSA/Ag NPs/SiO2; TEM images of (d) PSA, (e) PSA/Ag NPs, and (f) PSA/Ag NPs/SiO2; Size distribution curves of (g) PSA, (h) PSA/Ag NPs and (i) PSA/Ag NPs/SiO2.
When the self-assembling of 4-ATP or DTNB on the surfaces of Ag NPs was completed, the PSA/Ag NPs composite nanospheres have been coated by using an improved CTAB template method to prepare a PSA/Ag NPs/SiO2 SERS substrate. The SEM, TEM images and size distribution curve can be indicated that a size of silica shell is about 20 nm as shown in Fig. 2(c), (f) and (i), respectively.
The XRD patterns of PSA nanospheres, PSA/Ag NPs composities and PSA/Ag NPs/SiO2 composities are displayed in Fig. 3. A wide diffraction peak of PSA is captured at 20° which indicates a typical amorphous nature of polymer in the pure PSA nanospheres, PSA/Ag NPs composite and PSA/Ag NPs/SiO2 composities [24]. It can also be observed that the other diffraction peaks of cubic phase of Ag at 38.1°, 44.3°, 64.4°, 77.3° and 81.4° are corresponding to the crystal planes of (111), (200), (220), (311) and (222) (JCPDS card No. 04-0783), respectively [25]. Silica has a hump in the range of 2θ from 15° to 30° [26], which overlaps with the XRD of PSA, so the hump of PSA/Ag NPs/SiO2 composite has a significantly enhanced compared with PSA/Ag NPs composite.
Fig. 3. XRD patterns of PSA nanospheres, PSA/Ag NPs composites and PSA/Ag NPs/SiO2 composites.
The UV-vis absorption spectroscopy is one of the useful techniques to analyze the optical properties of metal nanoparticles. Fig. 4 depicts the UV-vis absorption spectra for PSA, PSA/Ag NPs and PSA/Ag NPs/SiO2. It can be noticed that the bare PSA nanospheres haven’t any obvious UV-vis absorption. Meanwhile, it is clear that an intense absorption band appeared at around 443 nm after the deposition of Ag. This is in good agreement with characteristic surface plasmon resonance band of Ag NPs [27]. On the basis of Mie theory for perfect spherical NPs [28], only one strong and symmetric absorption peak should be expected. So the observed surface plasmon resonance at 443 nm indicates a nearly spherical shape of Ag NPs [29]. Interestingly, as depicted by the blue line, after the introduction of SiO2 shell layer, an obvious red-shift emerged from 443 nm to 456 nm. Such a phenomenon can be attributed to the size increasement of nanoparticles as discussed in Ref. [30]. Hence, the spectra we observed in PSA/Ag NPs/SiO2 demonstrate that the successful growth of SiO2 shells.
Fig. 4. Absorption spectra of PSA nanospheres, PSA/Ag NPs composites and PSA/Ag NPs/SiO2 composites.
The FTIR spectra of PSA nanospheres, PSA/Ag NPs composites and PSA/Ag NPs/SiO2 composites are represented in Fig. 5. By virtue of these spectra, we noted that the peaks at 3060 and 3025 cm-1 are corresponding to C-H stretching vibration of the benzene ring whereas the peaks at 2922 and 2851 cm-1 are belonging to stretching vibrations of saturated C-H. Moreover, the three peaks of 1600 cm-1, 1490 cm-1, and 1450 cm-1 are attributed to stretching vibrations for framework of benzene rings. The peaks at 756 and 697 cm-1 are obtained as a result of bending vibrations of mono-substituted benzene. Consider a PSA spectrum, the peak at 1710 cm-1 should belong to C=O stretching vibrations of carboxyl group. After the adsorption of Ag+ ions on the surface of PSA nanospheres through electrostatic adsorption between silver ions and carboxyl anions, the characteristic absorption peaks are disappeared. When introducing silica, the Si-O stretching vibration at 460 cm-1, Si-O-Si stretching vibration at 1080 and 1150 cm-1 and Si-OH stretching vibration at 960 cm-1 are found. It can be seen from SEM and TEM images that the three new peaks originate from silica on the actual PSA/Ag NPs/SiO2 composites, indicating the presence of silica shell [31,32].
Fig. 5. FTIR spectra of PSA nanospheres, PSA/Ag NPs composites and PSA/Ag NPs/SiO2 composites.
To demonstrate an enhancement effect in SERS of PSA hybrid structure, the Raman signals of 4-ATP, Ag NPs/4-ATP and PSA/Ag NPs/4-ATP have been collected and shown in Fig. 6. According to that, a significant increase of SERS intensity is captured in Ag NPs/4-ATP at 1436 cm-1 when compared to pure 4-ATP. This enhancement is mainly attributed to Ag NPs induced local field enhancement. Interestingly, the SERS signal is increased drastically in PSA/Ag NPs/4-ATP. The signal amplification is obtained obviously in PSA/Ag NPs as a substrate with calculated enhancement factor of 4 when compared to Ag NPs. This phenomenon is attributed from rough surface of PSA with deposition of Ag nanoparticles. Moreover, as hot spots in the midst of the nearby PSA microspheres, the Ag nanoparticles improved the success rate of target detection through plasmon resonance effect. The increasing of light scattering cross-section under laser excitation is the real reason of the SERS enhancement. The surface area of PSA/Ag NPs nanosphere and pure Ag NPs is S1 = 4πR2 and S2=πR2, respectively. The distinct representative Raman labels have been applied for the fabrication of promising encoded SERS labels. From Fig. 5, it can be noticed that the PSA/Ag NPs/DTNB nanocomposites are exhibited unique SERS spectra at 1323 cm-1 with minimum spectral overlap compared with PSA/Ag NPs/4-ATP. The ratios of the reporters DTNB and 4-ATP are 1:1. In addition, the structure has a same enhancement mechanism with PSA/Ag NPs/4-ATP. The encoded PSA/Ag NPs/4-ATP and PSA/Ag NPs/DTNB have been employed separately as characterized peaks for dual detection of S. aureus and E. coli.
Fig. 6. Raman spectra for 4-ATP, Ag NPs/4-ATP, PSA/Ag NPs/4-ATP/SiO2, PSA/Ag NPs/DTNB/SiO2, and mixtures of PSA/Ag NPs/4-ATP/SiO2 and PSA/Ag NPs/DTNB/SiO2.
The type specimens of S. aureus and E. coli with different concentrations between 1 cell mL-1 and 1 × 10⁸ cell mL-1 have been analyzed under the same experimental environment, and the sensing scheme was shown in Fig. 7. The experiment data indicated that the Raman signal intensity of PSA/Ag NPs/SiO2 with S. aureus and E. coli complex are different which allows differentiating the absence and presence of S. aureus and E. coli. It can be seen from Fig. 8 that the Raman signal intensity of PSA/Ag NPs/SiO2 is increased gradually when the concentration of S. aureus and E. coli increasing from 1 cell mL-1 to 1 × 10⁸ cell mL-1. The procured regression equation for S. aureus is I = 8302.91lgC+21.69. The correlation coefficient is 0.9947 and the limit of detection (LOD) is 8 cell L-1. Concomitantly, the yielded regression equation for E. coli is I = 4331.27lgC+3.67. The correlation coefficient is 0.9927 and the limit of detection (LOD) is 2 cell L-1. The LOD was calculated according to the following equation: DL = 3σ/K, where 3 is the factor at the 95 % confidence level, σ is the standard deviation of the blank measurements (n = 9), and K is the slope of the calibration curve.
Fig. 7. Schematic of the sensing scheme for simultaneous detection of S. aureus and E. coli based on SERS-encoded nanocomposites.
Fig. 8. (a) Raman spectra for S. aureus and E. coli with different concentrations which identified by PSA/Ag NPs/SiO2-Aptamer; (b) linear dependence of Raman peak intensity at 1436 cm-1 as a function of S. aureus concentrations (n = 5) and (c) linear dependence of Raman peak intensity at 1323 cm-1 as a function of E. coli concentrations (n = 5).
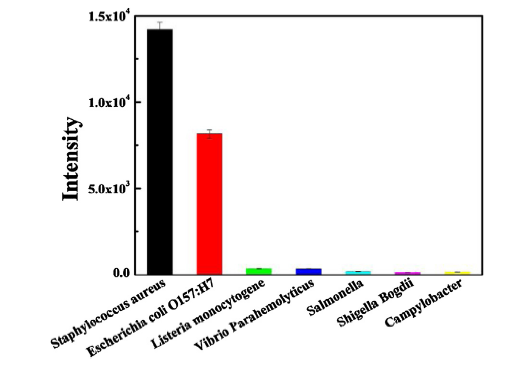
To justify the selectivity of our bioassay, other five pathogens i.e. Listeria monocytogene, Vibrio Parahemolyticus, Salmonella, Shigella Bogdii and Campylobacter were also tested in our experiments. Furthermore, to test repeatability, three different samples of the same pathogen were examined in triplicate and each experiment was tested back and forth five times. Our experimental results in Fig. 9 showed that an accurate identification of S. aureus and E. coli by encoded SERS nanocomposites with a very high Raman intensity, confirming an excellent specificity of encoded SERS nanocomposites to S. aureus and E. coli with no cross reaction with other pathogens.
Fig. 9. Selectivity of the dual pathogen bioassays based on SERS-encoded nanocomposites.
Based on the bioassay of S. aureus and E. coli we have demonstrated, many similar bioanalytical targets can be figured out by using the synthesized SERS encoded probe. Moreover, the SiO2 layer of core-shell nanospheres can be easily modified with a broad variety of surface physical chemistry to bind multitudinous probe molecules. Accordingly, the synthesized SERS probe has an enormous potential in recognizing widespread components of organisms with tremendous multiplexing capability, extraordinary sensitivity and exceptional selectivity. We emphasize that our technique is promising for greatly extending the practical applications of SERS, such as environmental monitoring, food safety and medical diagnosis.
In conclusion, an ultrasensitive bioassay of simultaneously detecting both S. aureus and E. coli was achieved by encoding SERS signals from PSA/Ag NPs-4-ATP/SiO2 and PSA/Ag NPs-DTNB/SiO2. Our encoding nanocomposites are facilitated by localized surface plasmon resonance of Ag NPs and high light scattering cross-section of PSA nanospheres. The dual-target bioassay in this work exhibited extremely high stability and reproducibility in complex environments with low background and interference. In addition, high sensitivity and wide detection range of our technique are experimentally confirmed. The detection limits of S. aureus and E. coli were measured to be about 8 cell L-1 and 2 cell L-1, respectively. Last but not the least, the convenient operation of our technique should be easily extended with specific SERS encoded labels for sensitive detections of other biomedical targets, such as other important pathogens and tumor markers.
This work was supported financially by the National Key Research and Development Program of China (Nos. 2018YFA0209101 and 2017YFA0700503), the National Natural Science Foundation of China (Nos. 11734005 and 61704024), the Science & Technology Project of Jiangsu Province (Nos. BE2016177 and BK20170696), the Fundamental Research Funds for the Central Universities, Zhishan Young Scholar Fund, and the Priority Academic Program Development of Jiangsu Higher Education Institutions. We thank the help of National Demonstration Center for Experimental Biomedical Engineering Education (Southeast University).

 WeChat
/
| 〈 |
|
〉 |


