Search for articles:
Jixin Yang , Zhiliang Ning
Corresponding authors:
Received: 2019-05-18
Revised: 2019-08-19
Accepted: 2019-09-9
Online: 2020-04-01
Copyright: 2020 Editorial board of Journal of Materials Science & Technology Copyright reserved, Editorial board of Journal of Materials Science & Technology
More
Abstract
Here, a near alpha-type Ti6.5Al2Zr1Mo1V alloy has been fabricated by electron beam selective melting (EBSM). Near-equiaxed grains existed in the first few layers, whereas elongated columnar prior β grains almost parallel to the building direction formed in the subsequent built layers. Interspacing of β phase gradually decreased as the build height increased. Martensite α′ with twins and dislocations emerged and microhardness value reached the maximum in the top region, whereas only α/β phase appeared in other regions in the EBSMed sample. Multiple phase transformations can be observed with the change of peak temperatures during each thermal cycle. With a sufficient dwell time, martensite α′ in the middle and bottom regions in-situ decomposed into α + β and coarsened by the heat conduction from the subsequent layers. Fine β precipitates nucleated heterogeneously inside α′ plates and at plate-plate interfaces during the subsequent EBSM process. Considering the phase transformation during the heating process and the cooling process, the existence time of different phases was combined with cycle heating and cooling to clarify the dynamic evolution of microstructure under complex thermal history of EBSM, favoring the fabrication of high-performance titanium alloy components.
Keywords:
Titanium alloys are widely used in engineering and biomedical fields due to their high specific strength and excellent corrosion resistance [1,2]. However, titanium alloys exhibit the intrinsic low fluidity and reactive nature with atmospheric agents at high temperatures. Therefore, several critical issues, such as oxidation and corrosion behaviors at high temperatures, limited formability for complex-shaped components, should be addressed, when titanium alloy are used in casting and forging [3,4]. As a kind of layer-by-layer advanced materials processing technologies, additive manufacturing (AM) can be considered as a powerful method to overcome the restriction of traditional processing methods. Titanium alloy components fabricated by AM have been successfully applied to biomedical, aerospace and automotive industries [[5], [6], [7], [8], [9]]. Powder bed fusion, one of the categories in AM, was divided into selective laser melting (SLM) and electron beam selective melting (EBSM) according to the applied energy source [10]. Working principles in these two processes are similar, except for the different working conditions [11,12]. EBSM in vacuum environment, without the risk of oxygen uptake, is a convenient approach overcoming the drawback of dimensional accuracy and oxidation [7,[13], [14], [15]]. More importantly, in the EBSM processing, the preheating step and minimized convection kept the powder bed at a high temperature, thus resulting in a low residual stress [[16], [17], [18]].
Numerous attempts have been devoted to fabricating titanium alloy components with excellent mechanical properties, and superior corrosion resistance via EBSM [[19], [20], [21], [22], [23], [24]]. However, the complicated thermal history during the process made it challenging to uncover the dynamic evolution of microstructure, hindering the fine controlling of the target performance. Depended on the thermal conditions during solidification, equiaxed grains and columnar grains were formed in different building stages [25,26]. Under rapid solidification, the bcc structure will transform into a hcp structure known as martensite (acicular) via a homogeneous transformation [27]. The resulting microstructure consists of ultrafine martensite α′ within columnar β grains [28], and phase transformation of α′ can be observed repeatedly during rapid heating and cooling [5,[29], [30], [31]]. Taking into account the characteristics of EBSM, in-situ decomposition of martensite α′ took place simultaneously when the temperature kept beyond the martensite start temperature. Different decomposition degrees of martensite have been noticed depending on the duration of heating time and temperature. The intrinsic heat-treatment involved in EBSM process also exerts a crucial role on the final phase composition. Meanwhile, the changing thermal environment during the whole heat transfer process causes the gradual change in the cooling rate and thus the microstructure feature, especially the lath thickness of α phase, along the building height [32,33]. Accordingly, hierarchical phase structure of different morphologies formed in the as-built samples, thus leading to their graded properties. However, regardless the description of the martensite transformation during rapid melting and cooling, there is still a lack of systematic research regarding the dynamic evolution of titanium alloy microstructure at different stages during EBSM. Therefore, the mechanisms of grain morphology evolution and martensite transformation associated with the thermal history should be further elucidated.
In this work, a near-α titanium alloy with a β-transition temperature of 970∼1010 °C [[34], [35], [36]], Ti6.5Al2Zr1Mo1V (TA15) was fabricated via EBSM. Microstructure characteristics of EBSM-built samples were examined. Moreover, the transformation mechanism of martensite α′ along the building direction was elaborated. The relationship between thermal history, microstructural evolution and mechanical properties of TA15 alloy was established during EBSM. It is expected that the obtained results will provide valuable insights into guiding EBSM processing routine of high-performance titanium alloys.
In this study, gas-atomized TA15 alloy powders were utilized for the EBSM fabrication. The chemical composition of the powders was analyzed by using ICP-OES Prodigy 7 and given in Table 1. Surface morphologies of gas-atomized powders were examined via field emission scanning electron microscope (SEM, Merlin Compact; 20 kV). Powder particles possess a spherical shape predominantly (Fig. 1a). The particle size distribution ranges from 45 μm to 105 μm, with an average particle size of ∼75 μm, as shown in Fig. 1b, measured by a laser particle size analyzer.
Table 1 Chemical composition (wt.%) of gas-atomized TA15 alloy powders.
| Elements | Ti | Al | Zr | Mo | V | O |
|---|---|---|---|---|---|---|
| Content | 87.62 | 6.50 | 2.04 | 1.63 | 2.08 | 0.13 |
Fig. 1. (a) SEM image, with inset highlighting the surface morphology, and (b) the particle size distribution of gas-atomized TA15 alloy powders.
The EBSM experiments were performed by a QbeamLab EBSM system developed by Tsinghua University [37] under a vacuum of ∼2 × 10⁻³ mBar in building chamber, which was controlled by using high purity helium as regulating gas in order to avoid oxidization. Firstly, preheating a stainless steel substrate with a 150 × 150 × 10 mm3 dimension to 1003 K prior to the selective melting was conducted with electron beam in order to avoid smoking caused by the electrostatic repulsion. Samples were fabricated with an accelerate voltage of 60 kV, a current of 9 mA, and a scan speed of 1400 mm/s. The nominal layer thickness was set to be 75 μm and the scan strategy was set as zigzag pattern, meaning that the scan direction will rotate 90° between the two adjacent layers [24], as shown in Fig. 2a, in which BD, LD and SD indicate the build direction, lateral direction and scanning direction, respectively. After pre-layer solidified, successive layers will be added until the whole process finished. Finally, the as-built samples with a 20 × 20 × 5.5 mm3 dimension (Fig. 2b) were taken out from the powder bed after cooled to 373 K in a vacuum surrounding.
Fig. 2. (a) Schematic illustration of the scan strategy and measurement locations for microstructural observations and XRD analysis, and (b) sample of a 20 × 20 × 5.5 mm3 dimension fabricated by EBSM.
TA15 alloy samples for microstructural characterization and hardness tests were electrical discharge machined from the as-built cubic sample. Five horizontal samples of a 5 × 1×5.5 mm3 dimension along the BD, numbered from S1 to S5, were selected to study the microstructural evolution (Fig. 2a). All the samples were prepared according to standard mechanical polishing procedures. Phase identification of each sample was characterized by using X-ray diffraction (XRD; PANalytical Empyrean) with a CuKα radiation, and a step size of 0.02° was adopted. The microstructure of as-built samples was examined by optical microscopy (OM; Leica DM4000 M), SEM (Merlin Compact; 20 kV) and transmission electron microscopy (TEM; Talors-F200x; 200 kV). Samples for SEM observations were etched in Kroll’s reagent (2 %HF, 6 %HNO3, and 92 %H2O) for 8 s. Energy dispersive spectrometry (EDS) was used to analyze the element concentration distribution along the BD. TEM thin foils were prepared by firstly grinding down to ∼50 μm thick, punching to a 3 mm disc, and finally ion milling to electron transparency. Quantitative image analysis was conducted using Image Pro Plus to accurately measure the width of α lath. Forty zones in each sample were counted to measure the width of adjacent β laths and the average values were adopted as the thickness of α plate. Vickers hardness tests were carried out on HVS-1000Z Vickers hardness tester. Twenty data collection points along the BD split the sample equally were selected to perform Vickers hardness tests at room temperature with a load of 200 gf and a dwell time of 15 s.
XRD patterns of the EBSM-built TA15 samples vertical to the BD are displayed in Fig. 3. As seen, microstructure of all the S1, S2, S3, S4, and S5 samples were dominated by α phases, together with a small amount of β phase (Fig. 3a). Peak broadening phenomena of α(100), α(002) and α(101) were observed from near the top surface of the as-built sample, i.e., S5, as shown in Fig. 3b and c. This suggests the presence of martensite α′ in S5, but α/β dual phase microstructure in other samples.
Fig. 3. Phase constitution of the EBSM-built TA15 samples in different regions: (a) XRD patterns of S1, S2, S3, S4, and S5, and (b) enlarged XRD patterns highlighting α(100), and (c) α(002) and α(101) peaks, indicating the existence of martensite α′ in S5.
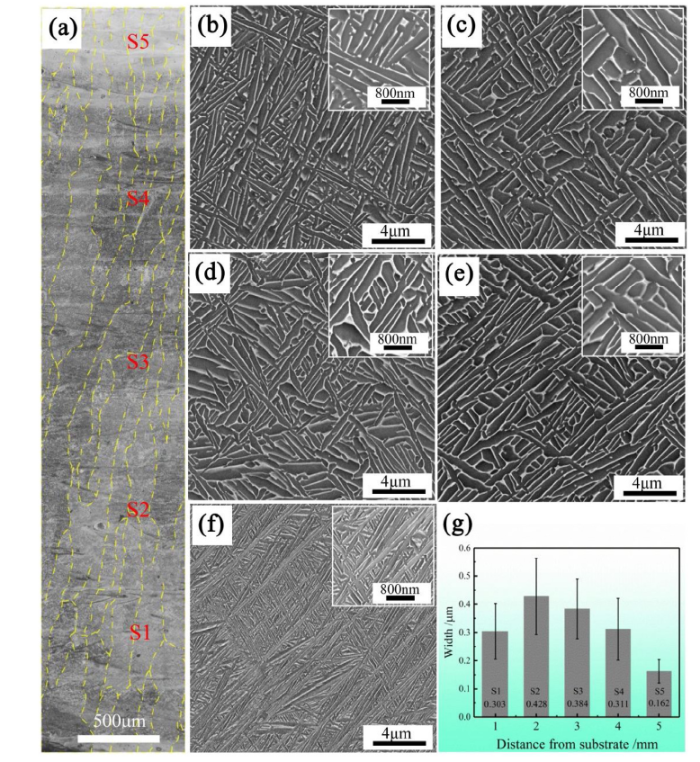
Fig. 4 shows the SEM images, and the width of adjacent β laths of EBSM-built TA15 samples in different regions along the BD. As shown in Fig. 4a, elongated columnar prior β grains were almost parallel to the BD and pass through multiple layers. All five samples show a mixture microstructure of rob-like white β phase embedded into continuous dark α phase (Fig. 4b-f). Along the BD, the phase morphologies of the as-built sample show a great difference. As the building height increases, the width of β phase increases firstly, and then decreases gradually, yielding the maximum value at S2 sample (See Fig. 4g). This means that S2 exhibits the coarsest microstructure, whereas the top region possesses the finest microstructure. S5 has numerous acicular α plates, indexed as martensite α′, with a high aspect ratio, consistent with the XRD patterns shown in Fig. 3.
Fig. 4. Microstructure of EBSM-built TA15 sample: (a) OM images showing the whole cross-sectional image of the as-built samples along the building direction, SEM images of (b) S1; (c) S2; (d) S3; (e) S4; (f) S5 samples, and (g) the average width of adjacent β laths in S1-S5.
Near-equiaxed prior β grains with a length of ∼200 μm (∼3 layers) formed in the region near the substrate, and equiaxed-to-columnar transition appeared in the subsequent built layers (Fig. 5a and b). EDS was adopted to analyze the element concentration tendency along the BD (Fig. 5c-g). As can be seen, the distribution of Ti, Al, V and Mo elements were uniform, whereas the concentration of Fe decreased as built height increases. The multiple melting in built layers caused the temperature and compositional gradients in melt pool, promoting the Marangoni convection. This facilitated the mass transfer and thus improved the element diffusion near the substrate [[38], [39], [40]].
Fig. 5. Microstructure and elements distribution near the bottom region: (a) SEM micrographs showing the near-equiaxed to columnar transition of β grains, and (b) magnified image of near-equiaxed grains; and element distribution along the building direction: (c) Ti; (d) Al; (e) V; (f) Mo; and (g) Fe.
The acicular martensite with a needle-like structure, consists of individual α plates and contains a high dislocation density and sometimes twins [41]. TEM results of S5 and S1 were displayed in Fig. 6, Fig. 7 to further examine the microstructures of EBSM-built samples. Martensite α′ in different aspect ratios, ranging from tens of nanometers to several micrometers, were observed in S5, and ultrafine β phase formed between adjacent martensite α′ (Fig. 6a and b). High density of dislocations and twins can be found in martensitic plates (Fig. 6c and 6d). These dislocations accommodate martensite transformation and further promote the formation of hierarchical structure [31,41]. The high-resolution TEM (HRTEM) observations demonstrated the shear transformation process during the martensitic transformation, which further confirmed the existence of martensite α′ (Fig. 6e and f).
Fig. 6. (a) TEM bright-field images showing the microstructural features in S5 of the EBSM-built TA15 sample and (b) HRTEM image of β phase; (c) high density dislocations and (d) twins in martensite α′; (e) magnified image of red ellipse in (d); HRTEM image of red rectangle area in (e), showing shear transformation process during martensitic transformation.
Fig. 7. (a) TEM bright-field images showing the microstructural features in S1 of the EBSM-built TA15 sample; (b) the high density dislocations in α phase; (c) α phase and β phase followed by Burgers orientation relationship; (d) α phase and adjacent β phase; (e-f) filtered HRTEM image taken from the red cycle 1 and 2 in. (d), showing the different orientation relationship in the adjacent α and β phases.
For S1 (Fig. 7a), relatively coarser α and β phases were observed from the TEM image, as compared with S5. High density of dislocations was also founded in S1 (Fig. 7b). The electron diffraction spots shown in Fig. 7c demonstrated that the transformation of β phase to α phase follows the classic Burgers orientation relationship. Fine β precipitates nucleated heterogeneously inside α′ plates and at plate-plate interfaces during the subsequent forming process, as shown in Fig. 7d. The atomic arrangement in β phase was inconsistent with the adjacent α phase when β phase nucleated at the interfaces (Fig. 7e). As β phase nucleated inside α′ plate, the atomic arrangement in β phase kept consistent with the adjacent α phase which was decomposed from α′ (Fig. 7f).
Vickers hardness tests were conducted from bottom region to top surface, and the results were shown in Fig. 8. Clearly, Vickers hardness remained almost unchanged within the area 0.27 mm-4.32 mm away from the substrate, corresponding to the initial 58 layers, but increased dramatically in the last 16 layers, yielding the maximum value of 439 HV. Relatively high hardness near the top surface suggested the formation of hard brittle phase, i.e., martensite α′, whereas α/β phases in different morphologies near middle region had an excellent plasticity. Compared with other regions, the smaller indentation mark of S5 shown in Fig. 8 inset also suggested its higher hardness. The continuous change in Vickers hardness also indicated the variation in the microstructure along the BD for EBSM-built TA15 alloy sample.
Fig. 8. Vickers hardness along building direction and corresponding indentation morphology (inset).
The microstructure of EBSM-built TA15 alloy sample was dominated by the melting process, subsequent repeated heating and cooling process. For each powder layer, the heat input was composed of electron beam energy during melting stage and heat conduction from the subsequent built layers. Under high vacuum, the absorbed thermal energy was mainly transmitted through radiation from the upper surface and heat conduction to the preceding solidified layers or the substrate [42]. To illustrate the energy driven phenomena, a combined parameter, energy density ε, composed of scanning velocity v, beam diameter R, scanning line spacing s and beam power P, can be described as follows [43],
$\varepsilon=\frac{P}{\pi R^{2}}\frac{2R}{v}\frac{2R}{s}$ (1)
According to the energy density equation, heat input provided by electron beam was supposed to be a constant for each built layer with the identical processing parameter during the melting stage. Due to the fast scan velocity, powders melt rapidly and melt pool formed. Heat loss through radiation from the melt pool to the ambient could be assumed to be a constant even though the ambient temperature elevated slowly because of the energy input [21,44]. The heat transfer rate ∂q/∂t can be described as follows [45]
$\frac{\partial q}{\partial t}=-kA\frac{\partial t}{\partial x}$ (2)
where q, k, A, ∂T, ∂x, and t represented the heat transfer, thermal conductivity of materials, cross section area of parts, the temperature difference between top surface and bottom, build height, and time, respectively. Since the local solidification condition vary with time and space, heat may transfer from the crystal into the undercooled melt (termed equiaxed structure), or transfer from the superheated melt into the cooled solid (termed columnar structure) [46,47]. To better understand thermal history during the printing process, a thermocouple was used to monitor the temperature change at the bottom of the substrate, as shown in Fig. 9a. During the initial 12 layers process, the temperature at the bottom of the substrate continued to decrease, and the temperature gradient between the adjacent layers was relatively high, within the range of point 1 and point 2. As the process continues, the temperature increased slowly and the temperature gradient between adjacent layers gradually decreased, within the range of point 2 and point 3. The schematic diagram of heat transfer during the process was illustrated in Fig. 9b, where qm, Qrad, Qcond-powder represent the energy input from electron beam, radiation from the top surface, and thermal conduct between parts and powders, respectively. Heat would conduct to the previously solidified layer from the subsequent layers and then transform to the former layers because of the existence of temperature gradient, leading to consecutive thermal cycles with a duration and amplitude [42]. The heat, composed of the heat from preheating stage in powder bed and latent heat during solidification, was difficult to dissipate through Qrad and Qcond-powder, and conducted quickly through the substrate, resulting in a cooling rate higher enough to form near-equiaxed grains [48,49]. After several layers built, the heat input from the subsequent layers and output into the previous ones could be reached a dynamic thermal balance in m-th layer because of the heat accumulation [50]. Both the ambient temperature and the as-built part temperature would continuously increase because of the heat accumulation, resulting in the increase of ∂x whereas the ∂T remains constant. Consequently, the cooling rate would continuously decrease, leading to the formation of columnar grains.
Fig. 9. (a)Temperature measured by a thermocouple attached to the bottom of the substrate. The insert graph is the enlarged view of point 2 to illustrate the local temperature change during the process; (b) Schematic diagram of heat transfer in EBSM.
Segments within the built part, except for the last layer, underwent a similar heat history including numerous thermal cycles of rapid reheating and cooling. As illustrated in Fig. 10, the thermal history during EBSM process could be divided into three stages, i.e., preheating of powders, cyclic melting and solidification, heat treatment from the subsequent built layers. In this figure, TP, TL, TS, Tβ, MS and AT represented the peak temperature, liquidus temperature, solidus temperature, β transus temperature, martensite start temperature and ambient temperature, respectively. The peak temperature (TP) in EBSM was ∼2973K [51], and the beta transus temperature (Tβ) of TA15 was in the range of 1243-1283 K [52]. Liquidus temperature(TL ∼1973 K)and solidus temperature(TS ∼1923 K) [53]could be obtain according to the Ti-Al binary diagrams. The martensite start temperature (MS) of TA15 was about 1147 K, which was calculated based on a thermodynamics-based model (Eq. (3)) [54]. The ambient temperature increased slowly as the process proceeded, as a result of the radiation of top sample surface. Phase transition temperature was supposed to be a constant during different thermal cycles.
$M_{S}=1104+1829X^{1.5}_{Al}-12615X^{1.5}_{V}-2018X^{1.5}_{Zr}-33776^{1.5}_{Mo}$ (3)
Fig. 10. Schematic diagram illustrating the different thermal cycle types of EBSM. Phase analysis indicates the existence time of each phase in different thermal cycles.
After spreading on the plate, powder layers were preheated up to a certain temperature, avoiding the smoking during the process [44,55]. After then, the cross sections were melted following a special path, and solidified within a few microseconds once the melting stage finished. For a sufficiently high energy density, temperature gradient was great enough to bring about a high cooling rate, facilitating the martensite transformation when untransformed β was cooled down below the MS rapidly. Due to the penetration depth of electrons reached few powder layers, the previous solidified layers would undergo melting and solidification several times [56]. As peak temperature above MS in each individual thermal cycle, reversible reaction β↔α′ can be observed cyclically during rapid heating and cooling, leading to the formation of hierarchical structure of martensite α′ in different morphologies [31,57]. As peak temperature decreased below MS, martensite α′ would decompose into α + β. Depending on the dwell time and temperature, the morphology and composition of phase would change a lot. The microstructure evolution in different thermal cycles was illustrated in Fig. 11.
Fig. 11. Schematic illustration of microstructural evolution during different thermal cycles (prior β and α′ are in cyan and faint yellow, α in deep yellow and β in brown). (a) Liquid phase and prior β grains as the peak temperature exceeds the liquidus temperature; (b-e) Martensitic transformation in different thermal cycles and a final microstructure consists of different morphologies; (f) martensite α′ decomposes to α and β under the annealing-like effect with the peak temperature under MS; and β precipitates nucleated heterogeneously inside and at plate-plate interfaces of martensite α′.
For thermal cycle 1, powders melted into liquid and then transformed to prior β grains as temperature decreased below Tβ, as seen in Fig. 11a. As temperature decreased below MS, acicular primary martensite α′ (marked as α1′) with twin substructures started to precipitate at the β grain boundaries, accompanied by the generation of dislocations (Fig. 11b). In thermal cycle 2 with peak temperature between TL and TS, primary martensite α′ transformed into a mixed structure of β and liquid phase. Furthermore, when cooled below Ms, β phase inherited from primary martensite α′ transformed into finer martensite α′ (α2′) [31], which were parallel or perpendicular to primary martensite α′ (Fig. 11c). As the peak temperature decreased below TS in thermal cycle 3 and 4, only solid-state phase transformations took place. The prolonged time and reduced peak temperature in each cycle resulted in slower phase transformation kinetics [58]. The β grain would break into several sub-grains and transform into finer martensite α′ (α3′) upon cooling (Fig. 11d) [5,59]. Some martensite α′, stemming from the previous cycles, may transform to metastable β phase with remnant dislocations. In the thermal cycle 5, martensite α′ formed during the previous thermal cycles would be retained and then underwent a coarsening during heating with peak temperatures below Ms. A small amount of martensite α′ transformed into β or (α + β) phases during heating under such non-equilibrium thermodynamic conditions. Much finer quartic martensite α′ (α4′) could be obtained from the dispersed β phases with a high density of dislocations (Fig. 11e).
As the temperature goes into (α + β) phase region, martensite α′ would decompose to α + β as a fine precipitate that was nucleated heterogeneously at internal structures or at martensite plate boundaries [41,60]. The decomposition degree depended on the initial building temperature and the temperature rise induced by thermal cycling. As the whole EBSM process may sustain for several hours, the heat treatment time accumulated from the thermal cycling was long enough for in situ decomposition of martensite α′. Owing to the insufficient dwell time and the thermal cycles with relatively low peak temperatures, residual martensite α' would be observed within the top region of the as-printed samples. During the phase transformation in titanium alloys, the crystallographic orientation between α and β followed the classic Burgers relationship. With prolonging heat treatment time, α coarsens and α lath spacing widens clearly through the coalescent and coarsening of β precipitates when the temperature was lower than Ms [[61], [62], [63]]. The β phase could recrystallize simultaneously, and grains gather around the original orientation [52,64], as shown in Fig. 11(f).
Near α-type Ti6.5Al2Zr1Mo1V titanium alloy powders were used to fabricate bulk samples via EBSM. The microstructure evolution and mechanical properties were systematically studied by SEM, TEM, XRD and Vickers hardness. Relationship between microstructure characterization and thermal history was also established. The following conclusions can be drawn:
(1) Inhomogeneous microstructure along the building direction can be attributed to the difference in the thermal history for each power layer. Near-equiaxed grains close to the substrate was observed and a transform from near-equiaxed to columnar grains occurred within the as-printed sample. The cooling rate was high enough to obtain a near-equiaxed structure in the initial three layers, and then gradually decreased as the built height increased.
(2) Martensite α′ could form during EBSM, and transform for several times in different thermal cycles. Residual martensite α′ were found in the last few layers because of the lack of energy input and decomposition time, leading to a higher Vickers hardness than other locations.
(3) Martensite α′ decomposed into lamellar α + β phase in situ because of the annealing-like effect from the subsequent layers. Microstructure in the as-built layers coarsened by the heat transfer from the subsequent layers, and the β rod interspacing gradually decreased as the build height increased.
The authors would like to acknowledge the financial support from The National Key Research and Development Program of China (2018YFB1105200).

 WeChat
/
| 〈 |
|
〉 |


