Search for articles:
C. Yang , D.R. Ni, B.L. Xiao
Corresponding authors:
Received: 2019-06-26
Revised: 2019-08-22
Accepted: 2019-10-22
Online: 2020-03-15
Copyright: 2020 Editorial board of Journal of Materials Science & Technology Copyright reserved, Editorial board of Journal of Materials Science & Technology
More
Abstract
In the present work, 80 mm thick 6082Al alloy plates were successfully double-side welded by friction stir welding (FSW). The relationship between the microstructures and mechanical properties was built for the double-side FSW butt joint with more attention paid to the local characteristic zones. It was shown that a phenomenon of microstructural inhomogeneity existed in the nugget zone (NZ) through the thickness direction. The grain size presented an obvious gradient distribution from the top to the bottom for each single-pass weld, and the microhardness values decreased from both surfaces to the middle of the NZ. The lowest hardness zone (LHZ) exhibited a “hyperbolical”-shaped distribution extending to the middle of the NZ. Similar tensile properties were obtained in the three sliced specimens of the FSW joint, and the joint coefficient reached about 70% which achieved the same level as the conventional FSW Al alloy joints. Finite element modeling proved that the “hyperbolical”-shaped heat affected zone (HAZ) was beneficial to resisting the strain concentration in the middle layer specimen which helped to increase the tensile strength. Based on the analysis of the hardness contour map, tensile property and microstructural evolution of the joints, an Isothermal Softening Layer (ISL) model was proposed and established, which may have a helpful guidance for the optimization on the FSW of ultra-thick Al alloy plates.
Keywords:
6xxx series (Al‒Mg‒Si) Al alloys, have good formability, moderate strength, outstanding corrosion resistance and good weldability, which brings them a wide application in aerospace, auto-motive, shipbuilding and transportation industries [1]. Especially with the development of high-speed train industry, there is an increasing demand for thick plates of 6xxx series Al alloys in the manufacture of train body structure. Taking thick Al alloy plates as substitutes for thick steel plates can achieve a 50% weight reduction while guarantee the safe strength [2,3]. Among various 6xxx series Al alloys, 6082 Al alloy is regarded as a desirable material for high-speed train body structure, due to its high specific strength, excellent formability [4].
The structural application of Al alloys unavoidably involves the welding and joining processes, which is quite challenging using the conventional fusion welding method, especially for thick Al alloy plates. Fusion welding of thick Al alloy plates usually involves multi-pass welding due to its limited fusion penetration ability. Therefore, the formation probability of the welding defects, like porosity, thermal crack will be increased greatly compared to that of the single-pass welding process. Moreover, the repeated intense welding thermal cycles and large temperature gradient are more likely to produce during the multi-pass welding, resulting in the significant softening and nonuniform properties of the joints [[5], [6], [7]].
Friction stir welding (FSW), as a solid state joining technique, has acquired prominent progress in joining Al alloys since it was invented by TWI in 1991 [8,9]. FSW can avoid the defects encountered in fusion welding of Al alloys, which makes it the fastest welding technology to apply in the industry from its invention [10]. Over years, FSW has been developed to a mature stage and many process variations have been developed to acquire excellent properties of optimized microstructures [[11], [12], [13], [14], [15]] in specific materials [16,17]. FSW, till now, has been successfully applied in various industries, such as aerospace, shipbuilding and rail transit areas [15]. Recently, there is a high expectation for FSW in joining thick Al alloy plates considering its excellent performance in welding thin and medium thick Al alloy plates [18].
Compared to the FSW of thin and medium thick Al alloy plates, there are some significant differences during FSW of thick Al alloy plates. Firstly, it takes much higher demand for the welding tool, due to the complex and enhanced force and torque during FSW of thick plates. Therefore, a double-side FSW method is usually used when ultra-thick Al alloy plates are welded. Secondly, because of the insufficient material flow and the requirement of the large axial force, the welding parameter is always limited in a very narrow window. Usually, low rotation rates less than 600 rpm and low welding speeds less than 200 mm/min are used for FSW of ultra-thick Al alloy plates. Thirdly, the temperature field and flow field become more complex and nonuniform as the thickness of the plate increases, resulting in the significant differences in the microstructure and the mechanical properties in different regions of the whole joint, especially along the thickness direction of the plates. The existence of the above characteristics makes it difficult to achieve high quality FSW joints of thick Al alloy plates [[19], [20], [21]]. Therefore, the study on the FSW of thick Al alloy plates is of great significance from both scientific research and engineering application perspectives.
At present, thick Al alloy plates, joined by FSW, has been successfully applied in some key areas as components. For instance, 25 mm thick Al alloy plates have been friction stir welded to replace riveting in structural components of Ariane 5 launch vehicle. Airbus Company has successfully accomplished the FSW of 40 mm thick Al alloy plates as structural parts in the manufacture of A340 aircrafts [22]. Despite these successful applications, there are still many technical problems to be solved. The relationship between microstructural evolution and mechanical properties is still unknown for the ultra-thick (larger than 50 mm) plates for more efforts were focused on Al alloy plates less than 30 mm thick based on open publications. Although Guo et al. [23] have conducted the FSW on a 108 mm thick 5xxx Al alloy plate, void defect was observed in the shoulder-affected zone, and more details on the microstructure and mechanical properties were still lacking. Especially, the investigation of 6082Al ultra-thick plate is limited, so a further study is still needed considering its wide applications.
In the present work, the double-side FSW on an ultra-thick plate (80 mm in thickness) of a heat-treatable 6082Al alloy (as a typical 6xxx series Al alloy thick plates) was conducted for the first time based on the existing reports. The microstructural inhomogeneity and the mechanical properties of the joint were investigated in detail. The aim of this study is to reveal the microstructural characteristics and construct the relationship between the microstructural evolution and mechanical properties for an FSW joint of ultra-thick Al alloy plates.
In the present work, as-extruded plates of 6082Al-T4 alloy were adopted as the base material (BM) with a dimension of 2000 mm × 800 mm × 80 mm. The chemical composition of the BM is listed in Table 1.
Table 1 Chemical composition of the 6082Al BM (wt%).
| Mg | Si | Zn | Cu | Fe | Mn | Cr | Ti | Al |
|---|---|---|---|---|---|---|---|---|
| 0.90 | 0.89 | 0.017 | 0.045 | 0.19 | 0.60 | 0.042 | 0.021 | Bal. |
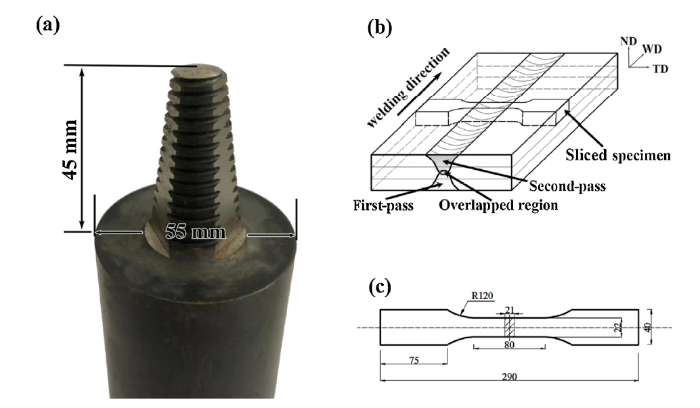
Double-side butt welding was carried out using an HT-JM50 × 40-1 type FSW machine manufactured by Aerospace Engineering Equipment (Suzhou) Co. Ltd., and the welding direction was parallel to the extruding direction of the BM. The double-side welds were completed in sequence. The welding tool consisting of a concave shoulder 55 mm in diameter and a cone-shaped pin 23 mm in diameter at root and 45 mm in length was used and the image of the welding tool was presented in Fig. 1(a). An optimized welding parameter, 400 rpm in rotation rate and 100 mm/min in welding speed (abbreviated as 400-100), was selected in the present study. The as-welded plates were subjected to post-weld artificial aging with a temperature of 175 °C for 7 h.
Fig. 1. (a) Image of the welding tool, schematics of (b) sampling position and (c) sliced tensile specimen.
Microstructural observations were conducted by optical microscopy (OM, Axiovert 200 MAT), scanning electron microscopy (SEM, ZEISS SUPRA 55), transmission electron microscopy (TEM, FEI TECNAI F20) and electron backscattered diffraction (EBSD, HKL Channel 5 System). Specimens for OM observation were machined perpendicular to the welding direction, then ground, polished, and etched with a Keller’s reagent (HNO3:HCl:HF:H2O = 2.5:1.5:1:95, vol.%). Specimens for TEM observation were prepared by twin-jet electro-polishing with a solution of 30% nitric acid and 70% methanol at -30 °C and 15 V. Specimens for EBSD were prepared with grinding and mechanically polishing, followed by electro-polishing in 10% perchloric acid and 90% ethanol solution for 1 min at -25 °C and 12 V.
Hardness measurement was conducted on the cross-section of the weld perpendicular to the welding direction using an automatic testing machine (Leco, LM-247AT) under a load of 300 g with a holding time of 15 s. The hardness distribution maps were acquired by measuring 14 lines on the cross-section with an interval of 4 mm between lines. In each line, 41 indentations with 1.5 mm intervals were performed, which included the whole sub-zones of the joint, i.e. nugget zone (NZ), thermo-mechanically affected zone (TMAZ), heat affected zone (HAZ) and BM.
The tensile specimens were machined perpendicular to the FSW direction, and the joint was divided into three layers on average along the thickness (i.e. the first-pass layer, the second-pass layer and the middle layer including overlapped region) with a gauge scale of 80 mm × 22 mm × 21 mm for each layer. The size and position of the tensile specimens are schematically shown in Fig. 1(b) and (c). The specimens were electrical discharge machined and ground with SiC papers up to grit #800 to achieve a smooth surface. The tensile test was conducted using an SANS CMT 5205 testing machine at room temperature with an initial strain rate of 1 × 10⁻³ s-1 and a testing speed of 4.8 mm/min. Three specimens were tested for each layer to obtain the average results.
High quality weld with sound surface was achieved under the selected welding parameter in this study. Fig. 2 shows the cross-sectional macrostructure of the double-side FSW joint. Like conventional FSW joint of Al alloys, the joint exhibited obvious four microstructural zones i.e. NZ, TMAZ, HAZ and BM. As can be seen, the whole weld presented a dumbbell shaped structure, which consisted of two single-pass welds. Besides, there was an overlapped region in the middle of the weld with a thickness of about 10 mm, which was highlighted with the blue dotted line. The NZ of each single-pass weld can be divided into two parts: shoulder-affected zone (SAZ) and pin-affected zone (PAZ), which is similar to that reported in previous studies for common plates [24].
Fig. 2. Cross-sectional macrostructure of the double-side FSW joint (AS: advancing side; RS: retreating side).
A new phenomenon should be noted that the NZ showed an inhomogeneous pattern. For each single weld, “onion ring” structure developed at the upper region of the PAZ. Then, at the lower region of the PAZ, a full “onion ring” structure was hard to detect and a banded structure was clearly observed, especially at the bottom. The banded structure mainly developed on the retreating side (RS) of each single-pass weld. The overlapped region consisted of the bottom regions of both single-pass NZs, where two obvious white zones were observed on the RS. Moreover, the “S” line became more distinct in the lower region of each single-pass NZ, and went across the overlapped region.
The “S” line was well documented to be originated from the broken oxide layer of the butting surface and usually presented a continuous distribution at low welding speeds [[25], [26], [27]]. It can be seen that the “S” line was continuous and more obvious at the lower region of the PAZ in each single-pass weld (Fig. 2), which was distinctly different from that of the thin plate welds. Under the intense material flow and sufficient material mixing effects at the upper region, the original oxide layer could be broken and dispersed effectively, so the “S” line was discontinuous and hard to detect. However, at the lower region, the material flow was too weak to make the broken oxide particles disperse sufficiently, resulting in the formation of a continuous wavy “S” line.
Fig. 3 shows the EBSD maps of the grain structure at different regions of the NZ. The black line represented the high angle grain boundaries (HAGBs, ≥15°), while the white line indicated the low angle grain boundaries (LAGBs, <15°) in the images. It can be seen that there was an obvious grain size gradient from the top to the bottom for each single-pass NZ. The average grain size in different regions corresponding to I, II, III, IV and V in Fig. 3, were 13.1, 11.1, 5.6, 9.9 and 14.2 μm, respectively. The grain size of the top region was the largest in each single-pass NZ and the finest grains appeared at the overlapped region. It is also revealed that, in the overlapped region, the grain morphology exhibited an incompletely recrystallized fine grain structure, and a high fraction of LAGBs was obtained (37%, as shown in Fig. 4(c)).
Fig. 3. EBSD maps of different regions in NZ: (a) top region and (b) middle region in the second-pass NZ, (c) overlapped region, (d) middle region and (e) top region in the first-pass NZ.
Fig. 4. Misorientation angle distribution in different regions in NZ corresponding to
Clearly, the grain size gradient in the NZ was more obvious compared with that in the conventional FSW joints of thin and medium thick plates, where a relatively homogeneous equiaxed fine grain structure was achieved [8,11,14,28]. It should be attributed to the great temperature and strain gradient along the thickness direction during welding of the ultra-thick plate. It is well accepted that the peak temperature was the dominant factor for the grain size in the NZ of the FSW joints [8,29]. At the top region of each single-pass weld, the material was heated mainly by the shoulder, which resulted in a higher peak temperature and a longer duration at high temperature in this region. Therefore, it would result in relatively coarser recrystallized grains at the top region. Moreover, the co-action of the shoulder and pin led to a sufficient material flow and the grains exhibited elongated morphology (Fig. 3(a) and (e)).
On the other hand, less heat produced by the shoulder was transferred to the bottom of each single-pass weld. In this case, the main heat source was the fictional heat between the material and the pin, and also the heat from material deformation. Therefore, the peak temperature of the thermal cycles decreased and the duration at high temperature became shorter, so finer grains were acquired. Furthermore, the weakest material flow appeared at the bottom of each single-pass weld, where the material was only driven by the tip of the pin, resulting in an incompletely recrystallized fine grain structure (Fig. 3(c)).
Fig. 4 shows the misorietation angle distribution in different regions of the NZ. It can be seen that the top and middle regions in both single-pass NZs had a LAGB fraction of around 30%, whereas the fraction of the LAGBs was larger than 37% in the overlapped region. During the dynamic recrystallization (DRX) process, the misorientation angle distribution always exhibited one typical peak that below 15° under high plastic strain [30,31], as shown in the top and middle regions of each single-pass NZ (Fig. 4(a, b, d and e)). However, the misorientation angle distribution in the overlapped region presented two-peak distribution, which were below 15° and between 45°‒60° (Fig. 4(c)). When the second-pass welding was conducted, the recrystallized grains would experience a second thermal cycle and deformation in the overlapped region. It would induce the occurrence of the dynamic recovery (DRV), and the rearrangement of dislocations developed into LAGBs, which increased the fraction of LAGBs. Meanwhile, parts of the medium angle grains further transformed into HAGBs during the second DRX process [32,33].
To reveal the precipitate evolution after post-weld artificial aging, the second-pass NZ was subjected to the TEM observation and the incident direction of the electron beam was parallel to the 〈100〉 zone axis of the Al matrix. Fig. 5 shows the bright-field TEM images of different regions in the NZ together with the BM for comparison. As can be seen, the BM was characterized by a high density of fine-needle shaped precipitates approximate 50 nm in length (Fig. 5(a)), whereas the density of the precipitates in the NZ exhibited a decreased tendency through the thickness direction. At the top region, the precipitates were relatively coarser and longer compared with those in the BM (Fig. 5(b)). In the middle region, the precipitates were coarsened further with obviously decreased density (Fig. 5(c)), and the lowest density of the precipitates appeared at the overlapped region, as shown in Fig. 5(d).
Fig. 5. Bright-field TEM micrographs of (a) BM, (b) top region and (c) middle region of the second-pass NZ, (d) overlapped regions.
For Al‒Mg‒Si alloys, the precipitation sequence during aging was well documented as follows: supersaturated solid solution (SSS) → Mg and Si cluster → β” precipitate → β' precipitate → β-Mg2Si [34]. β” precipitate was characterized by fine-needle shape with the length of 20-50 nm, which was an effective strengthening phase. Therefore, the fine needle-shaped precipitates in this study should be β” phase on the basis of previous reports [[35], [36], [37]].
Because of undergoing the thermal cycles and plastic deformation during FSW process, the precipitates in NZ went through a complex evolution involving precipitation, dissolution and reprecipitation before being subjected to artificial aging [8,[37], [38], [39], [40]]. For the top region in each single-pass NZ, the solutes totally dissolved into the Al matrix due to the high peak temperature, while part of them precipitated during the cooling process in the thermal cycles.
With increasing the thickness from the surface, the peak temperature in the thermal cycle decreased but with a slow cooling rate especially in the middle of the NZ (overlapped region), which resulted in more solutes precipitated. When the FSW joint was subjected to post-weld aging, the β” precipitation occurred in the top region to a great extent. However, a low density of β” phase with coarsened ones was observed in the overlapped region (Fig. 5(d)).
Fig. 6 shows the Vicker’s microhardness profiles on the cross-section of the weld. The testing indentation positions are presented with the schematic diagram in Fig. 6(a). As can be seen in Fig. 6(b), the hardness curve of the centre line through the thickness direction in the NZ exhibited a “V” shape. The hardness of the top and bottom regions of the whole NZ had a high value of about 105 HV and gradually decreased to a very low value of approximate 60 HV in the middle region. The hardness profiles of the traverse cross-section are presented in Fig. 6(c) and (d). For each single-pass weld, the hardness profiles along the thickness direction exhibited the similar distribution tendency. The BM had the highest value of ∼115 HV, and the lowest hardness zone (LHZ) was located at HAZ with a very low value of ∼57 HV at the bottom and it increased to ∼64 HV in the LHZ of the upper zone for each single-pass weld.
Fig. 6. Microhardness profiles of the joint: (a) testing position sketch; (b) hardness profile along centre line through thickness direction; (c) hardness profile on the cross-section in the second-pass weld; (d) hardness profile on the cross-section in the first-pass weld.
The hardness distribution of FSW joint was a reflection of the co-action of grain size, dislocation and precipitation [41]. However, for precipitate-strengthened Al alloys, the hardness was mainly dominated by the precipitates. In the present study, the BM was characterized with high density of β” phase (Fig. 5(a)), so that a high hardness value was obtained. While at the top region of the each single-pass NZ, similar hardness value was acquired due to the nearly same density of the precipitates (Fig. 5(b)). From the middle to the lower regions, the hardness decreased as a result of the remarkable decrease of the precipitate density and slight coarsening of the precipitates (Fig. 5(b-d)).
To reveal the hardness distribution trend more directly, the hardness contour map is presented in Fig. 7. The hardness exhibited a symmetrical distribution with the weld centre line. The LHZ was clearly observed to exhibit a “hyperbolical” type, resulting from the two connective welds after the two-pass FSW process. Furthermore, what should be noted is that the LHZ extended to the middle zone of the weld, which is far different from that of the conventional FSW Al alloy joints [37,38].
Fig. 7. Hardness contour map of the cross-sectional double-side FSW joint.
In the study of FSW 6061Al thin plates, Liu and Ma [37] and Zhang et al. [42] regarded the NZ as a heat source that exerted certain thermal exposure on the LHZ with approximately the same temperature history independent of welding parameters and tool dimensions, which has been proved with experimental and modeling results. However, in this study, each single-pass welding was semi-penetration, which differentiated distinctly from the full penetration for the welding of thin plates. Therefore, an “Isothermal Softened Layer” (ISL) model is proposed for the present double-side FSW of ultra-thick plates and the schematic diagram is presented in Fig. 8.
Fig. 8. Diagrammatic feature of the proposed Isothermal Softening Layer model.
When the welding tool moves along the butting line during FSW, there is a special zone that experienced the same thermal cycles due to the heat source exposure effect from the NZ, which can result in obvious dissolution/coarsening of the precipitates. As a result, the lowest hardness values were obtained in this zone, i.e. the LHZ. In this case, it can be defined as ISL in this study, shown as the orange layer in Fig. 8. After the first-pass FSW, an “U” shaped ISL can be acquired around the NZ due to the semi-penetration welding characteristic. However, the bottom part of the first “U” shaped ISL was broken when the second-pass FSW process was conducted, on account of the stirring and re-heating effects. Meanwhile, a continuous “U” shaped ISL was reserved in the second-pass weld, which caused the extended LHZ in the middle zone of the NZ as shown in Fig. 7.
The tensile result histogram of the three sliced specimens of the joint and the BM is presented in Fig. 9(a). Similar UTS of 230, 225 and 223 MPa were achieved for the second-pass weld specimen, the middle layer specimen and the first-pass weld specimen, respectively. The mean value of the UTS of the three sliced specimens was 226 MPa, which reached ∼70% of the BM (320 MPa). Compared with the conventional FSW joints of 6xxx series Al alloy thin plates with joint efficiencies of 60%-80% [43,44], the same level joint strength was acquired for the double-side FSW joint of ultra-thick plate by using an optimized welding parameter. The elongation of the first-pass and the second-pass weld specimens was about 5% and it increased to 7% for the middle layer specimen, which was due to the more obvious necking deformation in the widened softening zone of the middle layer specimen, as shown in Fig. 9(b).
Fig. 9. (a) Tensile result histogram of the double-side FSW joint and BM; (b) optical micrographs showing the fracture position of the sliced tensile specimens.
From the observation of the failed tensile specimens in Fig. 9(b), the first-pass and the second-pass weld specimens fractured with an inclination of ∼45° to the weld centre line, but the fracture path of the middle layer specimen exhibited a curve shape. By measuring the distance from the fracture path to the centre line, it is revealed that fracture exactly occurred along the LHZ randomly on the AS or RS, which had a good match with the hardness distribution.
Associating with the microhardness values, the middle layer specimen had a lowest hardness value of 57 HV in its LHZ, and the lowest values for the other two sliced specimens were 64 HV. However, the UTS of the middle layer specimen was just 5 MPa lower (it should be ∼21 MPa theoretically) than the second-pass weld specimen, and even a little higher than the first-pass weld specimen. To explain this phenomenon, the second-pass weld and the middle layer specimens were taken to conduct a finite element modeling (FEM) of the tensile process.
As shown in Fig. 10(a) and (c), two finite element models of the tensile specimens are built to study the influence of the HAZ structure on the tensile strength of the double-side FSW joint. Tensile loading of 1.25% strain was performed and the linear work hardening equation was used. The stress σ is represented as:
σ=σy+Kεp (1)
where σy is the yield stress, K is the strength coefficient and εp is the plastic strain. The Young’s modulus and the strength coefficient K of all the three parts (BM, NZ and HAZ) were configured as 72 GPa and 415 MPa according to experimental results, respectively. The yield stress σy of the BM and NZ were assumed to be 285 MPa uniformly. The yield stress of the HAZ in the two specimens was assumed the same (190 MPa) based on the experimental results. Fig. 10(b) and (d) shows the maximum principal strain field of the specimens after tensile loading. The strain concentration in the second-pass weld specimen (Fig. 10(b)) is much more serious than that in the middle layer specimen (Fig. 10(d)). Moreover, the modeled stress‒strain curves (Fig. 10(e)) show that the yield stress of the middle layer specimen was higher than that of the second-pass weld specimen. In conclusion, the “hyperbolical”-shaped structure of the HAZ in the middle layer decreased the strain concentration and increased the strength, i.e. the “hyperbolical”-shaped structure in the middle layer compensated the loss of the theoretical strength corresponding to the low hardness, so that the nearly same UTS was acquired for the middle layer specimen compared with the other two sliced specimens.
Fig. 10. FEM model of (a) the second-pass weld and (c) middle layer specimens. The maximum principal strain field after 1.25% strain tensile loading was performed on (b) the second-pass weld and (d) the middle layer specimens. (e) The modeled stress-strain curves of the second-pass weld and middle layer specimens.
Different from the conventional FSW joints, an obvious microstructural inhomogeneity was observed in the NZ. What are of interest are the white zones in the overlapped region and the banded structure in the NZ. To reveal the microstructures of these characteristic zones in detail, magnified metallographic image and EBSD maps are presented in Fig. 11. According to the calculation of the EBSD software, the mean grain sizes of zones A, B and C were 3.3, 2.8 and 4.1 μm, respectively, while it was 5.6 μm in zone D (center of the overlapped region, Fig. 3(c)). Based on the subtle differences in the grain sizes between zones A, B, C and zone D, it can be concluded that the grain size was not the dominant factor for causing the different characteristic microstructures in the overlapped region.
Fig. 11. (a) Metallographic image of the weld; (b) magnified metallographic image of the overlapped region; EBSD maps of (c) zone A, (d) zone B and (e) zone C in (b).
To further illuminate the morphologies of the precipitates in the banded structure (zone C) and white zones (zones A and B), the TEM observation was conducted. As shown in Fig. 12(a), zone A was characterized by coarsened precipitates and a few fine needle-shaped β” precipitates (marked with blue rectangles). Differently, zone B was characterized by only coarsened precipitates (Fig. 12(b)). However, the β” precipitates were still the dominant strengthening phases in zones C and D, but some of them were coarsened in zone C (marked with yellow ellipses in Fig. 12(c)).
Fig. 12. Bright-field TEM micrographs of (a) zone A, (b) zone B and (c) zone C in
The coarsened precipitates in zones A and B mainly had three kinds of shapes: coarsened lath-shaped phase (marked with black arrow), polygonal platelet-shaped phase (marked with blue arrow) and spheroidal phase (marked with white arrow), as shown in Fig. 12(b). The EDS analysis was conducted under STEM mode to confirm the element components of these coarsened precipitates, as shown in Fig. 13. It is clear that Mg and Si elements concentrated at the position corresponding to the coarsened lath-shaped precipitate, while the polygonal platelet-shaped precipitate was Fe/Mn/Si-rich phase. Furthermore, the spheroidal phase was the Mg/Si-rich precipitate according to the previous studies [[45], [46], [47], [48]]. Therefore, it can be concluded that the lath-shaped and the spheroidal precipitates were coarsened Mg2Si, whereas the polygonal platelet-shaped precipitate should be α-Alx(FeMn)ySi phase based on the EDS results and previous studies [46,47].
Fig. 13. EDS spectrum under STEM mode of the precipitates in zone B.
As marked in the specific zones, the hardness values had a good match with the precipitation evolution as shown in Fig. 11(b). The hardness value in zones A, B, C and D was 64, 53, 69 and 75 HV, respectively. Therefore, the coarsening of the precipitates was the dominant reason for the dropped hardness values, which also resulted in the white characteristic zones with relatively higher etching resistance. To further reveal the relationship between the microstructure and tensile property in the characteristic zones, small-size tensile specimens were prepared and the positions of the specimens are schematically shown in Fig. 14(a). Seen from the engineering stress-engineering strain curves in Fig. 14(b), the UTS of the middle region of the second-pass NZ was 332 MPa, and the elongation was 20%. By comparison, zones A and B exhibited much lower strengths of 213 MPa and 186 MPa, with elongations of 15% and 25%, respectively. Clearly, the UTS was even lower than that of the sliced specimens of the double-side FSW joint which fractured in the HAZ due to the obviously coarsened precipitates.
Fig. 14. (a) Sampling position of the small size tensile specimens; (b) engineering stress‒strain curves of different zones.
As is known, thermal field and material flow are two key factors that affected the microstructure evolution of the FSW joints. In this work, the inhomogeneous material flow was definitely the dominant reason for the formation of onion ring and banded structure. For the SAZ in each single-pass weld, the material was driven by the shoulder so that it was sufficient to form cyclic movement. While for the PAZ, the material was driven by the pin and the material flow intensity decreased dramatically from the root to the tip of the pin. In the upper region of the PAZ, the material flow was intense and the material mixed sufficiently, so a series of onion rings developed. With increasing the depth, the shear force that exerted on the material which dominated the traverse movement, was smaller than the downward axial force [25,49]. Therefore, the material exhibited an intense downward tendency that made it hard to form onion rings, resulting in the formation of the banded structure, which was indicated with the white dotted lines in Fig. 11(a).
Zone A was located at the bottom of the first-pass weld and firstly underwent a thermal cycle of the ISL induced by the first-pass welding. As a result, almost all the precipitates coarsened in zone A. Then, when the second-pass welding was conducted, it experienced a stirring effect and another thermal cycle similar to that in the bottom NZ. Therefore, some of the precipitates redissolved, and precipitated as fine ones with the coarsened ones retained in the subsequent artificial aging.
Zone B was located at the bottom of the second-pass weld. It firstly experienced a stirring effect induced by the first-pass welding, and then underwent a thermal cycle induced by the second-pass welding. The precipitation occurred as fine ones after the first-pass welding, and then coarsened thoroughly due to the thermal cycles of the ISL induced by the second-pass welding. The coarsened ones were kept or further coarsened during the post-weld artificial aging, resulting in the lowest hardness value. In this case, the LHZ extended to the middle of the NZ, and a “U” shaped LHZ formed in the second-pass weld.
In this study, 80 mm thick 6082Al alloy plates were successfully double-side welded using FSW method for the first time. The relationship between microstructures and mechanical properties was built and the local microstructures and mechanical properties were investigated in detail. The conclusions are drawn as follows:
(1)NZ was characterized by fine grain structure with the grain size decreasing from the top to the bottom for each single-pass NZ, and the density of β'' phase decreased with increasing the depth from the surface in each single-pass NZ.
(2)The LHZ was located in the HAZ and presented a “hyperbolical” type. Furthermore, the LHZ extended to the middle zone of the NZ, and it was well explained by an ISL model proposed for the FSW of ultra-thick Al alloy plates.
(3)The tensile properties of the whole joint were tested with three sliced specimens, and similar UTS of 230 MPa, 225 MPa and 223 MPa were achieved in the second-pass weld, the middle layer and the first-pass weld specimens, respectively, which reached ∼70% of the BM. The increased tensile strength of the middle layer specimen was due to the weakened strain concentration induced by the “hyperbolical”-typed HAZ, which was proved with the finite element modeling.
(4)The local mechanical properties had a good match with the microstructures. The UTS of the small-size tensile specimen in the middle region of the second-pass NZ was 332 MPa, and zones A and B exhibited very low strengths of 213 MPa and 186 MPa, respectively, due to the obviously coarsened precipitates.
This work was supported by the Youth Innovation Promotion Association of the Chinese Academy of Sciences (2017236) and National Natural Science Foundation of China under grant No. U1760201.

 WeChat
/
| 〈 |
|
〉 |


