Search for articles:
Hexiong Zhang, Xinfang Zhang
Corresponding authors:
Received: 2018-12-4
Revised: 2019-01-18
Accepted: 2019-01-18
Online: 2020-01-01
Copyright: 2020 Editorial board of Journal of Materials Science & Technology Copyright reserved, Editorial board of Journal of Materials Science & Technology
More
Abstract
Cylindrical Al-Zn-Mg alloys were processed by electroplastic compression with forced air cooling. Compared to a simple compression process, an unequal intensity of {110} <1$\bar{1}$1> was obtained, and other textures were eliminated by electroplastic compression, that is, electroplastic compression can promote a uniform texture. The various textures formed in different regions along the radial direction under a simple compression process were illuminated by analyzing the relationship between the crystal rotation and stress state. Furthermore, the interaction between the electrons and dislocations was studied in electroplastic compression. The electrons enhanced {110} <1$\bar{1}$1> by promoting slipping of the dislocations when the Burgers vectors of the dislocations were parallel to the drift direction of the electrons. However, the electrons also inhibited crystal rotation by pinning the dislocations with the Burgers vectors perpendicular to the drift direction of the electrons. Therefore, textures other than {110} <1$\bar{1}$1> have difficulty forming under electroplastic compression. The effect of the current energy on the texture (enhancement or attenuation) was in accordance with the law of conservation. The results provided reasonable explanations for the test phenomena.
Keywords:
Recrystallization and rotation-deformation of the grains affect the texture type and intensity in metals during the plastic deformation process [1,2]. The change of the grain state and its influence on texture is an important topic in crystal plastic deformation research. It is divided into two aspects: dynamic recrystallization and the relationship between the stress state and grain behavior. Studies on the effect of dynamic recrystallization on the evolution of texture during thermoplastic deformation, such as hot rolling and hot extrusion [[3], [4], [5]], have shown that dynamic recrystallization nucleation occurs in areas where stress and strain are concentrated (for example, the shearing band). Recrystallized grains are generally equiaxed grains of several micrometers, and with grains growing and phagocytizing, the textures are weakened. Therefore, recrystallization promotes plastic deformation; however, the uniformity of the texture in the materials is reduced. Moreover, in the study of the relationships between the stress state and grain behavior, scholars found that the shearing band can refine the grains, and deformation-rotation of the grains in the shear band is more violent, resulting in inhomogeneity of the material properties and texture [6,7]. In-depth studies on the stress state in the local regions of the materials and deformation-rotation of the grains have been investigated, and the relationship between the stress state, grain deformation-rotation, and texture evolution has been clarified [8,9]. Materials will form the texture gradient along a certain direction owing to the different deformation mechanisms in various parts of the material although under the same deformation process [[10], [11], [12]]. Studies on the change of the grain state and its effect on texture during the traditional plastic forming process have been comprehensive.
Electroplastic forming is a special process based on the electroplastic effect of metal. Since the electroplastic effect was studied by Troitskii in 1963 [13], in-depth studies on its mechanism have been conducted. When the electron drifting rate is higher than the dislocation slipping rate, the electron wind can promote slipping of the dislocations [14]. Scholars have studied test-calculation methods of the effects of skin, pinch, Joule heating, and pure electron wind on electroplastic forming [15], and a further study on the linear relationship between electron wind and current density was performed. Several calculation methods of a proportional coefficient were provided [16]. For static deformation, scholars have also studied and determined calculation models for the influence of electron wind on stress relaxation [17]. Comprehensive studies on the electroplastic effect theory have prompted studies on its applications, such as electroplastic extrusion and electroplastic drawing [18,19]. Recently, with the development of microstructural analysis methods, studies on electroplastic effects have focused on the analysis of current-induced flow stress reduction and microstructure evolution (such as, structural uniformity, structural type, and intensity of texture) in electroplastic deformation [[20], [21], [22], [23], [24]]. The studies on electroplastic forming are comprehensive; however, compared with the achievements of conventional forming, studies on the relationships between the local stress state, grain deformation-rotation, and its impact on texture during electroplastic forming have rarely been reported.
In the process of electroplastic deformation, the current-dislocation force forms a coupling force field with an external load, providing a more complicated stress state than that of conventional forming. The stress state of each part of the material is different, and obvious textures are formed. In this study, the characteristics of the non-uniform deformation in the cylinder compression process were used. The effects of the coupling force field of the current-dislocation force and external load on the grain rotation-deformation and texture in different regions along the radial direction in the cylindrical samples were studied. With no current, obvious textures were formed in different regions owing to an uneven stress in the material. With a current, a portion of the texture was eliminated; therefore, the same type of texture with different intensities was formed (homogenization of texture). This study will provide additional information in the field of electroplastic forming.
Three φ 8 mm × 10 mm cylinders were obtained from the Al-Zn-Mg hot rolled plate with the dimensions of 30 mm × 30 mm × 10 mm. The base surfaces of the cylinder were parallel to the hot rolled plate ND (normal direction) surface. The following three sets of compression tests at a strain rate of 2 × 10⁻⁴ s-1 were performed: (a) compression at room temperature (25 °C) until the sample failed, recorded as sample A, and (b) symmetrically clamping the sample using two 100 mm × 25 mm × 0.5 mm stainless steel plates (as the electrodes). The central portion of the universal chuck was applied with a pressure of 5 N to fix the sample and electrodes. The ends of the electrodes were connected to a current pulse generator. The peak value of the pulse current was Id = 150 A. The pulse width was 200 μs, and the frequency was 500 Hz. The current pulse generator was initiated when compression started, and forced air cooling was performed until the sample failed. This was denoted as sample B. For (c), test (b) was repeated. After pulse and air cooling were initiated, a thermocouple and an infrared imager were used to measure the stable temperature under the same conditions, and this sample was labeled C. A schematic view of electroplastic compression is shown in Fig. 1(a).
Fig. 1. Schematic of the experimental setup and analyzed regions: (a) schematic of the experimental setup, (b) EBSD analyzed regions, and (c) TEM analyzed regions.
Three points were selected equidistantly from the crack to the edge of the sample along the radial direction and recorded as point 1 (A1 for sample A and B1 for sample B), point 2 (A2 for sample A and B2 for sample B), and point 3 (A3 for sample A and B3 for sample B), as shown in Fig. 1(b). The texture of the selected points was analyzed using electron backscatter diffraction (EBSD). A dislocation analysis was performed using transmission electron microscopy (TEM) in sample A and sample B with the same strain of 0.2. The electrons were incident along the <111> crystal axis. To improve the accuracy of the dislocation statistics, each sample was analyzed around the hole (center of specimen for TEM) with approximately four points of symmetry (top, bottom, left, and right of the hole), as shown in Fig. 1(c).
To determine the relationship between the crack direction and RD (rolling direction) of the hot rolled plate, before performing simple compression or electroplastic compression, the RD of the cylinder sample was marked. Then, simple compression or electroplastic compression was performed, and an optical analysis of samples A and B was performed from the edge to the crack along the radius of the cylinder. The stress state of different parts of the sample was evaluated according to the flow direction and deformation degree of the grains in the simple compression and electroplastic compression processes. To determine the stress state of the sample along the radius, optical analyses of samples A and B were performed in the longitudinal section of a cylinder perpendicular to the crack.
The skin depth can be approximated by the following formula.
δ= $(πfμ \frac{1}{ρ})^{- \frac{1}{2}}$ (1)
where δ is the skin depth, f is the frequency, μ is the permeability and ρ is the resistivity of the specimen. Typical values for the parameters are as follows: f=500Hz, μ=4π×10-7H/m, ρ=5.22×10⁻⁸Ω⋅m. The calculated skin depth for this study is 5.14 mm, which is larger than the sample radius (4 mm). That is to say, the current can pass through the sample evenly during the tests, and the skin effect has no obvious effect on the microstructure evolution for the investigated samples.
The compressive true stress-strain curves for samples A and B are shown in Fig. 2. Similar to previous studies [[25], [26], [27]], sample B showed improved plasticity with a reduced flow stress. The compression ratios of samples A and B were 0.25 and 0.4, respectively. The compression ratio of sample B was 60% higher than that of A.
Fig. 2. Compressive true stress-strain curves of samples A and B.
Because the current density selected in this study was low, and the electroplastic compression process was equipped with an air-cooling device, the temperature increase of the sample during electroplastic compression was minimal. The thermocouple showed a stable temperature of 45 °C after the sample was energized, as shown in Fig. 3(a), and the infrared imager showed that the stable temperature under the same conditions was 40 °C, as shown in Fig. 3(c). The results of the two methods were similar, and assuming the thermocouple was accurate, the temperature increase of sample B was ΔT ≈ 20 °C.
Fig. 3. Temperature rise of sample B: (a) temperature rise detected by the thermocouple, (b) temperature rise of the entire system detected by the infrared imager, (c) temperature rise of sample B detected by the infrared imager, and d temperature rise of the stainless steel electrodes detected by the infrared imager. Simultaneous use of the thermocouple and infrared imager avoided large measurement errors and facilitated the analysis of sample heating mechanisms.
Crystal orientation analyses of A1, A2, and A3 were performed by EBSD and were compared with the hot rolled plate texture, as shown in Fig. 4(a-d). Fig. 4(a) shows pole figure (PF) and inverse pole figure (IPF) maps of the hot rolled plate. Fig. 4(b-d) shows the PF and IPF maps of A1, A2, and A3 in sample A, respectively. Fig. 4(a) shows that the hot rolled plate was a {110} <1$\bar{1}$1> texture. Fig. 4(b-d) shows that the {110} <1$\bar{1}$1> texture of the sample weakened or disappeared, and the hot rolled plate grains were broken after simple compression. Fig. 4(e-g) shows the PF and IPF maps of B1, B2, and B3 in sample B after electroplastic compression, respectively. Sample B had the same type of texture {110} <1$\bar{1}$1> as the original sample, and the grains in the hot rolled plate were not broken after electroplastic compression.
Fig. 4. IPF and PF maps of the hot rolled plate, sample A, and sample B: (a) maps of the hot rolled plate, (b) maps at A1 in sample A, (c) maps at A2 in sample A, (d) maps at A3 in sample A, (e) maps at B1 in sample B, (f) maps at B2 in sample B, and (g) maps at B3 in sample B. A1, A2, A3, B1, B2, and B3 are all shown along the radius, equidistant from the crack to the edge.
The test samples were subjected to a TEM analysis according to the method in Fig. 1(c), as shown in Fig. 5. Fig. 5(a-d) shows the dislocations in the hot rolled plate, indicating a certain degree of dislocation tangle. After a simple compression treatment, sample A was obtained, and the degree of dislocation tangle was higher than that of the hot rolled plate, as shown in Fig. 5(e-h). After the hot rolled plate was treated by electroplastic compression, sample B was obtained, and there was dislocation tangle; however, the scale of the entanglement was significantly lower than that of sample A. In addition, the dislocations presented a parallel arrangement, as shown in Fig. 5(i-l). Fig. 5(m-n) and (o-p) shows the dislocation accumulation at the grain boundary of sample A and B, respectively. The degree of dislocation accumulation at the grain boundary of sample B was significantly lesser than that of A.
Fig. 5. Evolution of the dislocation in the hot rolled plate, sample A, and sample B: (a-d) dislocation in the grains of the hot rolled plate, (e-h) dislocation in the grains of sample A at a 0.2 strain, (i-l) dislocation in the grains of sample B at a 0.2 strain, (m-n) dislocation near the grain boundary of sample A at a 0.2 strain, and (o-p) dislocation near the grain boundary of sample B at a 0.2 strain. Selecting multiple random points for each sample for analysis can effectively improve the statistical results of TEM and increase its reference value.
Before performing simple compression or electroplastic compression, the RD of the cylinder sample was marked. Then, simple compression or electroplastic compression was performed. The resulting crack direction was perpendicular to the RD of the hot rolled plate, as shown in Fig. 4. To evaluate the accuracy of the conclusion, optical analyses of samples A and B were performed from the edge to the crack along the radius of the cylinder, as shown in Fig. 6. Fig. 6(a) shows the optical images of sample A. The crack direction was perpendicular to the original plate RD after the simple compression. This was verified by the elongated grain (red ring 1) and elongated precipitates (dark phase in red ring 2), which were away from the crack. Similarly, the electroplastic compression was analyzed, as shown in Fig. 6(b). After the electroplastic compression, the crack direction of sample B was also perpendicular to the RD of the hot rolled plate. This was verified by the elongated grain (red ring 3) and elongated precipitates (dark phase in red ring 4).
Fig. 6. Relationship between the crack and hot rolled plate RD: (a) crack direction, grain deformation direction, and precipitates distribution direction of sample A, from the crack to the edge, in the radial direction, (b) crack direction, grain deformation direction, and precipitate distribution directions of sample B, from the crack to the edge, in the radial direction. The optical image reflects the crack direction perpendicular to the hot rolled plate RD. SCP represents a simple compression process and EPC represents electroplastic compression.
Fig. 7 shows the cut surface of the RD-ND (hot rolled plate) of sample A and sample B. Three points were analyzed radially from the center of the cut surface (near the crack) to the edge. The sample A points were recorded as A-1, A-2, and A-3, and the OM images are shown in Fig. 7(b-d). The points for sample B were denoted as B-1, B-2, and B-3, and the OM images are shown in Fig. 7(e-g).
Fig. 7. Deformation degree and direction of the sample A and B grains: (a) analysis location map, (b) deformation degree and direction in A-1 of sample A, (c) deformation degree and direction in A-2 of sample A, (d) deformation degree and direction in A-3 of sample A, (e) deformation degree and direction in B-1 of sample B, (f) deformation degree and direction in B-2 of sample B, and (g) deformation degree and direction in B-3 of sample B. Based on the degree and direction of deformation of the grains, the relative magnitude and direction of the stress at different regions in the sample can be qualitatively determined.
Comparing Fig. 7(b-d), the grain direction of A-1 was parallel to the ND direction, and the grain of A-2 was deflected from ND to RD by 7°. The A-3 grains were deflected from ND to RD by 12°; therefore, the radial tensile stress of the sample gradually increased from the crack to the edge during the simple compression process, and the tensile stress near the crack was approximately 0 MPa. There was an axial elongation trend in the grains at A-1, A-2, and A-3; thus, there was axial compressive stress at A-1, A-2, and A-3, and the force was the main factor of grain deformation. The grain deformation at A-1, A-2, and A-3 became smaller in turn, and the axial compressive stress of the sample was gradually reduced from the crack to the edge during simple compression. Similarly, comparing Fig. 7(e-f), the force state of the electroplastic compression sample was similar to that of simple compression.
Comparing Fig. 7(b) and (e), (c) and (f), as well as d and g, the radial deflection of the grains at B-1 and A-1 was 0°. The radial deflections of the grains at B-2 and A-2 were 4° and 7°, respectively, and the radial deflections of the grains at B-3 and A-3 were 7° and 12°, respectively. The radial deflection of the sample B grains was lesser than or equal to that of sample A. The radial tensile stress in the same region of the electroplastic compression sample was lesser than that of simple compression.
4.1.1. Temperature increase
The adiabatic temperature increase of sample B can be calculated using Eq. [2], showing ΔT ≈ 15 °C, which was lower than the measured ΔT ≈ 20 °C, as shown in Fig. 3(a). The resistance of the stainless-steel electrodes was large, resulting in a higher temperature, and heat conduction occurred from the electrodes to the sample, as shown in Fig. 3(b-d).
ΔTmax=$\frac{∫I{ e }^{2}Rdt }{ MC_{ P } }$ (2)
Here, △Tmax is the adiabatic temperature rise; Ie is the effective current; R is the resistivity of the specimen; M is the sample quality, and CP is the specific heat of the specimen.
4.1.2. Changes in the mechanical properties
A temperature increase of 20 °C would contribute to the increase of plasticity, as shown in Fig. 2. The mechanical properties of some alloys are sensitive to the temperature and strain rate. Studies had shown that the tensile elongation of Al-Zn-Mg (T6) alloy, obtained at 50 °C with the strain rates of 1 s-1, 1.9 × 10⁻² s-1, and 3.3 × 10⁻³ s-1, was increased by 8%, 15%, and 10%, respectively, compared with that at room temperature [[28], [29], [30]]. The above research showed that the elongation of the Al-Zn-Mg alloy was partially increased at 50 °C compared with that at room temperature, and the strain rate sensitivity was not obvious. The actual temperature of the Al-Zn-Mg alloy in electroplastic compression was approximately 45 °C. The strain rate was 2 × 10⁻⁴ s-1, and the elongation was 63% higher than that with simple compression. Therefore, the temperature increase of 20 °C in electroplastic compression promoted plasticity improvement of the alloy; however, because of the lower temperature increase and enhanced plasticity promotion, the electric current improved the plasticity. The interaction between the current and dislocation was assumed to promote the increased plasticity. TEM was used to show evidence of this speculation.
Studies have shown that current can interact with dislocations, quench dislocations, open dislocation tangles, and promote the climb of dislocations at grain boundaries [[31], [32], [33]]. Fig. 5(a-p) shows the dislocation configuration of a hot rolled plate, sample A and B. As shown in Fig. 5(a-h), simple compression caused a large amount of plastic deformation of sample A, resulting in dislocation density increases, and the degree of dislocation tangle became large. Fig. 5(e-l) shows that the interaction of the current with the dislocations opened a certain number of dislocation tangles. Annihilation and climbing of the dislocations occurred. Directional electrons enhanced the driving force of the dislocations sliding in some directions, making the dislocations appear in a parallel arrangement. The interaction between the electric current and dislocation can be expressed by the following expression [16].
$\frac{f_{ ew } }{ l }=\frac{ bC_{ed}J }{\bar{M }} $ (3)
Here, $\frac{f_{ ew } }{ l }$ is the phenomenological force acting on the dislocations of unit length; b is the unit Burgers vector; Ced is the action coefficient; J is the current density, and $\bar{M }$ is the Taylor orientation factor.
Fig. 5(m-p) shows the dislocation accumulation at the grain boundary of sample A and B. The current in the electroplastic compression caused partial dislocations at the grain boundary in sample B to climb into the grain boundary, and some dislocations were quenched. The current reduced the dislocation density at the grain boundary of sample B, resulting in less dislocation accumulation at the grain boundary than that of sample A. The mathematical expression of current-promoted dislocation climbing is as follows [33].
v=4πacoDV $\frac{fV_{ a } }{ lK_{0}T }$ (4)
Here, v is the climbing rate of the dislocations; a is the atomic transition distance; co is the vacancy concentration of the perfect crystal; DV is the vacancy volume diffusion coefficient; $\frac{f}{ l }$ is the climbing force on the dislocations of unit length; Va is the atomic volume; K0 is a constant, and T is temperature. Electron wind can increase DV and $\frac{f}{ l }$, thus increasing the rate of dislocation climbing.
Comparing the results of Fig. 5 with previous studies [[31], [32], [33]], the current interacted with the dislocations in sample B during the electroplastic compression, and the electron wind reduced the flow stress and increased the plasticity of sample B.
Fig. 2 shows that sample B had a lower strength than that of sample A; however, the plasticity was improved. The above phenomenon can be explained by combining the difference in the dislocation density and tangle between sample A and sample B (Fig. 5), and the dislocation accumulation model (Fig. 8). As shown in Fig. 5, the dislocation density and accumulation in sample A were higher than that of sample B. During the simple compression process, when the accumulation of the dislocations in the grain and grain boundary of sample A reached a certain level, the grains broke from the released concentrated stress, as shown in Fig. 8(a-b). Fig. 8(a) shows the dislocation accumulation in the hot rolled plate. As compression progressed, the dislocation accumulation became more severe, breaking the sample A crystal grains. The number of dislocations in the smaller crystal grains became less, and then, the concentrated stress at the grain boundary was released, as shown in Fig. 8(b). In electroplastic compression, owing to the electron wind, the dislocation accumulation and tangle in sample B were opened. In addition, dislocation climbing and annihilation occurred. Then, the dislocation density in the grains decreased. During electroplastic compression, the grains of sample B did not show an obvious fracture, and its grain size was the same as that of the hot rolled plate. Therefore, the number of dislocations accumulated in the single grain of sample B decreased, as shown in Fig. 8(a) and (c). The number of crystal grains and single grain plugging dislocations in sample B were lesser than that of sample A, as shown in Fig. 8(b-c), resulting in a decrease in the flow stress and an increase in plasticity.
Fig. 8. Dislocation accumulation model of simple compression and electroplastic compression: (a) dislocation accumulation in the hot rolled plate, (b) degree of dislocation accumulation increase and broken crystal grains after simple compression, (c) after electroplastic compression, degree of dislocation plugging reduction with no broken crystal grains. The number of dislocations in a single grain was reduced, and the grain size and quantity were not significantly changed. Compared with sample A, fewer grains and a lower dislocation density and degree of accumulation in a single grain resulted in a decrease in the stress and an increase in the plasticity of sample B.
Simple compression destroyed the original {110} <1$\bar{1}$1> texture because of the shear stress from Fig. 4(a-d). The large crystal grains with a strong {110} <1$\bar{1}$1> crystal orientation in the original plate were broken up, and the original texture is destroyed. Breakage and refinement of the grain is shown in the IPF maps in Fig. 4(a-d). Comparing Fig. 4(b-d) and (e-g), electroplastic compression promotes {110} <1$\bar{1}$1> texture formation. Based on Fig. 2 and previous results and analysis, the following two corollaries were obtained: (1) The shear stress generated by simple compression could break the grains and then destroy the {110} <1$\bar{1}$1> texture in the hot rolled plate. (2) Electroplastic compression could significantly increase the plasticity of the sample, enhance the rheological ability, and then reduce grain breakage owing to the stress concentration, which enhances the ability of the sample to maintain and increase the original texture. Therefore, electroplastic compression could be considered favorable for promoting {110} <1$\bar{1}$1> formation, although the texture intensity between B1, B2, and B3 were different. Electroplastic compression could promote homogenization of the texture in the entire sample. Electroplastic compression promoted homogeneity of texture the owing to the following reasons.
An in-depth study of simple compression and electroplastic compression requires the introduction of ODF for a quantitative analysis of the texture intensity and type, considering the direction of the current, stress state, and crystallographic slip system of fcc metals. These three factors can be used to analyze the mechanism of simple compression and electroplastic compression. Here, the Φ2 = 45° ODF section was selected for analysis, as shown in Fig. 9.
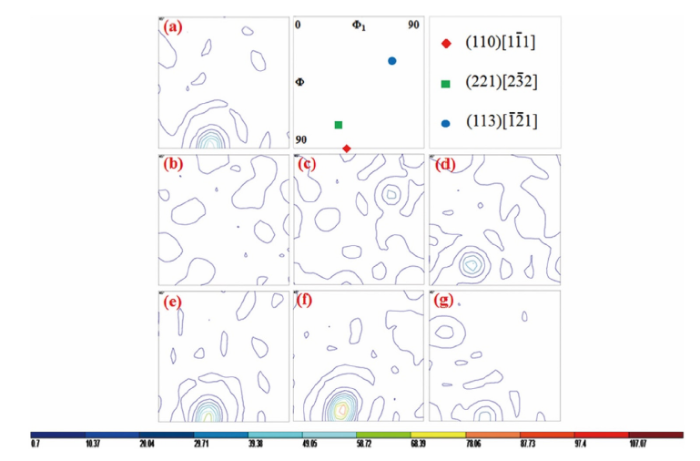
Fig. 9. Φ2 = 45° ODF cross section diagram: (a) Φ2 = 45° ODF cross section diagram of the hot rolled plate, (b) Φ2 = 45° ODF cross section diagram at A1 of sample A, (c) Φ2 = 45° ODF cross section diagram at A2 of sample A, (d) Φ2 = 45° ODF cross section diagram at A3 of sample A, (e) Φ2 = 45° ODF cross section diagram at B1 of sample B, (f) Φ2 = 45° ODF cross section diagram at B2 of sample B, and (g) Φ2 = 45° ODF cross section diagram at B3 of sample B. ODF can more accurately reflect the type and intensity of the texture, which is required for an in-depth analysis.
Fig. 9(a) shows the Φ2 = 45° ODF section of the hot rolled plate; Fig. 9(b-d) shows the Φ2 = 45° ODF section diagrams of A1, A2, and A3; and e-g shows the diagrams of B1, B2, and B3, respectively. The textures reflected in Fig. 9(a-g) are similar to those in Fig. 4(a-g), respectively. Therefore, the Φ2 = 45° ODF section is reasonable for the analysis in this study.
4.2.1. Relationship between the stress state and texture in the simple compression
As shown in Fig. 9(b-d), (110) [1$\bar{1}$1] of A1, A2, and A3 nearly disappeared in comparison to that of the hot rolled plate, and A1 did not produce an obvious texture. A2 produced weak (113) [$\bar{1}$$\bar{2}$1], and A3 produced a stronger (221) [2$\bar{3}$2]. The different texture formations at A1, A2, and A3 were because the three points had different stress states during the simple compression, as shown in Fig. 10(a). For A1, there was only axial compressive stress $\vec{σ}_{CS1}$. The radial tensile stress was $\vec{σ}_{TS1}$≈0MPa; A2 was simultaneously subjected to axial compressive stress $\vec{σ}_{CS2}$ and radial tensile stress $\vec{σ}_{TS2}$; A3 was simultaneously subjected to axial compressive stress $\vec{σ}_{CS3}$ and radial tensile stress $\vec{σ}_{TS3}$. The axial compressive stress at the three points satisfied $\vec{σ}_{CS1}$>$\vec{σ}_{CS2}$>$\vec{σ}_{CS3}$, and the radial tensile stress satisfied $\vec{σ}_{TS3}$>$\vec{σ}_{TS2}$>$\vec{σ}_{TS1}$≈0MPa. The above texture features were formed at A1, A2, and A3 owing to the following reasons. A1 was subjected to a strong axial compressive stress ($\vec{σ}_{CS1}$>$\vec{σ}_{CS2}$>$\vec{σ}_{CS3}$), and $\vec{σ}_{CS1}$ broke the grains to eliminate (110) [1$\bar{1}$1]. For $\vec{σ}_{TS1}$≈0MPa, the broken grains did not show a rotational orientation, and no textures were formed. At A2, for the axial compressive stress of $\vec{σ}_{CS2}$<$\vec{σ}_{CS1}$, the grain fracture was weakened; therefore, a certain intensity of (110) [11(-)1] was retained. For $\vec{σ}_{TS2}$>$\vec{σ}_{TS1}$≈0MPa, a directional rotation of the broken grains occurred, forming a certain intensity of (113) [1(-)2(-)1]. At A3, the axial compressive stress $\vec{σ}_{CS3}$ and the strong radial tensile stress ($\vec{σ}_{TS3}$>$\vec{σ}_{TS2}$>$\vec{σ}_{TS1}$) worked together, and a large number of directional rotations occurred simultaneously with the grain breakage. Therefore, (110) [1$\bar{1}$1] disappeared, and a strong (221) [23(-)2] was formed.
Fig. 10. Characteristics of the external load and electron wind stress and the rotation law of the crystal grains under the coupled stress field: (a) stress state in different regions during simple compression, (b) relationship between the stress state and grain rotation at A3 in sample A during simple compression, (c) relationship between the stress state and grain rotation at A2 in sample A during simple compression, (d) stress state and grain rotation angle at A3 in sample A during simple compression, (e) stress state and grain rotation angle at A2 in sample A during simple compression, (f) coupled stress field and grain rotation at B3 in sample B during electroplastic compression, and (g) coupled stress field and grain rotation at B2 in sample B during electroplastic compression.
In Fig. 9(a), the hot rolled plate RD was perpendicular to the (1$\bar{1}$1) plane. After a simple compression, the crystal plane at A3 rotated, making RD perpendicular to the (23(-)2) plane. Fig. 10(b) and (d) shows that the hot rolled plate (1$\bar{1}$1) rotated ∠D3E3C3≈11.5° (Fig. 10(d)) along the radial tensile stress $\vec{σ}_{TS3}$ (Fig. 10(b), [$\bar{1}$1$\bar{1}$] crystal orientation) with axis A3B3 (Fig. 10(d), [101(-)] crystal orientation). The rotation of the crystal plane at A2 was analyzed by the same method as A3. With reference to Fig. 10(c) and (e), the (1$\bar{1}$1) plane in the hot rolled plate rotated ∠B2I2E2≈61.9° (Fig. 10(e)) along the radial tensile stress $\vec{σ}_{TS2}$ (Fig. 10(c), [$\bar{1}$1$\bar{1}$] crystal orientation) with axis G2H2 (Fig. 10(e), [12(-)3(-)] crystal orientation), making the hot rolled plate RD perpendicular to (1(-)2(-)1). At A2, the axial compressive stress was $\vec{σ}_{CS2}$>$\vec{σ}_{CS3}$, resulting in a deflected rotary axis B2G2H2≈41.4° (Fig. 10(e)) from A3B3 (Fig. 10(d)) to G2H2 (Fig. 10(e)) along the axial compressive stress $\vec{σ}_{CS2}$ (Fig. 10(c), [$\bar{1}$$\bar{1}$0] crystal orientation), where, $\vec{σ}_{TS3}$>$\vec{σ}_{TS2}$ and ∠B2I2E2>∠D3E3C3. The texture intensity at A3 was higher than that at A2. Thus, although the rotation angle was small, $\vec{σ}_{TS3}$ caused more grains to rotate, explaining the phenomenon of ∠B2I2E2>∠D3E3C3 for $\vec{σ}_{TS3}$>$\vec{σ}_{TS2}$. The relationship between the grain rotation and stress state that occurred at A2 and A3 conform to the mechanical laws of grain rotation.
4.2.2. Effect of the current on the texture in electroplastic compression
The textures at B1, B2, and B3 formed (110) [1$\bar{1}$1] with different intensities after electroplastic compression. The texture intensity of B1 was higher than those of B2, and B3. Compared with sample A, a strong (110) [1$\bar{1}$1] texture existed at B1 and was not present at A1. The (110) [1$\bar{1}$1] intensity of B2 was higher than that of A2; however, the (113) [$\bar{1}$$\bar{2}$1] texture, which existed at A2, was lost at B2. There was a strong (110) [1$\bar{1}$1] at B3, and there was no (110) [1$\bar{1}$1] texture at A3; however, (221) [2$\bar{3}$2], which existed in A3, was lost at B3. In summary, the current enhanced (110) [1$\bar{1}$1] and favored the suppression of other textures, except (110) [1$\bar{1}$1].
For B1, B2, and B3, the current direction was parallel to the axial compressive stress, and parallel to the (1$\bar{1}$1) plane. The direction was [$\bar{1}$$\bar{1}$0]. Thus, the current direction was parallel to the {1$\bar{1}$1} <110> slip system of sample B (fcc). According the Troitskii study [13], the direction of the electron motion parallel to the crystal slip system increases the crystal plasticity. As shown in Fig. 10(f-g), the electrons interacted with dislocations d3 and d2 in the slip system to generate $\vec{σ}_{ew3}$ and $\vec{σ}_{ew2}$, promoting the dislocations to slip and climb, which enhanced the coordination ability of the crystal grains. Therefore, the crystal grains are not easily broken during the deformation process, thereby improving crystal plasticity. For the RD-ND, the {1$\bar{1}$1} <110> texture was enhanced, and for the ND-RD, the {110} <1$\bar{1}$1> texture was enhanced.
For B3 and B2, the sample was subjected to a radial tensile stress. If there was no current (at A3 and A2), the crystal would deflect along the radial tensile stress and dislocations d3 and d2 would rotate to d3ʹ and d2ʹ, respectively. Therefore, the moving directions of d3 and d2 were perpendicular to the current direction at B3 and B2, as shown in Fig. 10(f-g). According to the Troitskii study [13], the electron motion direction is perpendicular to the slip system, i.e., when the electrons are perpendicular to the dislocations on the slip system, the crystal plasticity will be significantly reduced. When the moving direction of the electrons is perpendicular to the plane formed by the dislocations and their Burgers vectors, the electrons will hinder the movement of the dislocations, similar to the pinning of the dislocations by precipitates. As shown in Fig. 10(f), the current was approximately perpendicular to the plane formed by d3 and d3ʹ. The current acts as an obstacle to the movement of the dislocations; thus creating the pinning effect of the current on the dislocations. The pinning stress was $\vec{σ}_{ed3}$, parallel to the radial tensile stress $\vec{σ}_{TS3}$ in the opposite direction. Similarly, the pinning force of the current on the d2 dislocation was $\vec{σ}_{ed2}$, which was parallel to the radial tensile stress $\vec{σ}_{TS2}$ in the opposite direction, as shown in Fig. 10(g). For B3 and B2, the current dissipated part of the energy used for dislocation pinning, resulting in pinning forces $\vec{σ}_{ed3}$ and $\vec{σ}_{ed2}$ that suppressed the dislocation movement along with radial tensile stresses $\vec{σ}_{TS3}$ and $\vec{σ}_{TS2}$. Then, the grain rotation was suppressed, and (221) [23(-)2] at A3 and (113) [1(-)2(-)1] at A2 were eliminated.
4.2.3. Energy conservation of texture promotion and weakening by the current in electroplastic compression
The impact of electroplastic compression on the texture can be split into simple compression and current, thus electroplastic compression = simple compression + current, as shown in Fig. 11. At point 1, the change in the (110) [1$\bar{1}$1] intensity caused by $\vec{σ}_{CS1}$ of simple compression was Δf(g)1-P-1=-59.18, and the change in the (110) [1$\bar{1}$1] intensity caused by the current during electroplastic compression was Δf(g)1-E-1=67.02. At point 2, the change in the (110) [1$\bar{1}$1] intensity caused by $\vec{σ}_{CS2}$ and $\vec{σ}_{TS2}$ of simple compression was Δf(g)2-P-1=-46.32. The change in the (113) [$\bar{1}$$\bar{2}$1] intensity caused by $\vec{σ}_{TS2}$ was Δf(g)2-P-2=12.41, and the changes in the (110) [1$\bar{1}$1] and (113) [$\bar{1}$$\bar{2}$1] intensities caused by the current during electroplastic compression were Δf(g)2-E-1=38.88 and Δf(g)2-E-2=-12.41, respectively. At point 3, the changes in the (110) [1$\bar{1}$1] and (221) [2$\bar{3}$2] intensities caused by $\vec{σ}_{CS3}$ and $\vec{σ}_{TS3}$ of simple compression were Δf(g)3-P-1=-59.18 and Δf(g)3-P-2=25.06, respectively. The change in the (110) [1$\bar{1}$1] and (221) [2$\bar{3}$2] intensities caused by the current during electroplastic compression were Δf(g)3-E-1=23.8 and Δf(g)3-E-2=-25.06, respectively.
Fig. 11. Texture intensity changes in A1, A2, and A3 of sample A and B1, B2, and B3 of sample B.
The changes of the {110} <1$\bar{1}$1> intensity by the current in electroplastic compression to point 1, point 2, and point 3 were Δf(g)1-E-1=67.02, Δf(g)2-E-1=38.88, Δf(g)3-E-1=23.8, and Δf(g)1-E-1>Δf(g)2-E-1>Δf(g)3-E-1, respectively. The changes of the other texture intensities by the current in electroplastic compression at point 1, point 2, and point 3 were |Δf(g)1-E-2|=0, |Δf(g)2-E-2|=12.41, |Δf(g)3-E-2|=25.06, and |Δf(g)1-E-2|<|Δf(g)2-E-2|<|Δf(g)3-E-2|, respectively. The intensity changes by the current during electroplastic compression at points 1, 2, and 3 were Δf(g)1-E, Δf(g)2-E, and Δf(g)3-E, which can be calculated as shown in Eq. (5).
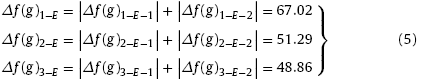
Eq. (5) indicates that the difference between
Δf(g)1-EΔf(g)2-EΔf(g)3-E
is not significant. The total amount of texture intensity changes caused by the current of electroplastic compression in different regions of the sample is assumed to be constant, and then the sum of HE1 and HE2 is constant, where HE1 is the current energy used for increasing the intensity of (110) [11(-)1]. HE2 is the current energy weakening the other textures. Then, Eq. (6) can be obtained
HE1+HE2=C (6)
Here, HE1 and HE2 are increasing functions of the intensity of {110} <1$\bar{1}$1>, and the other textures changed owing to the current during electroplastic compression.
According to the Conrad study [16], the plastic strain rate ε˙p can be expressed by Eq. (7).
$\dot{ε}_{ p } =\dot{ε}_{ o} exp${-$\frac{ΔH(σ)}{ kT }$} (7)
Here, ΔH(σ) is the activation energy of plastic deformation, which is a decreasing function of the effective stress σ. For B1, B2, and B3, the crystal does not rotate with the radial tensile stresses $\vec{σ}_{TS1}$, $\vec{σ}_{TS2}$, and $\vec{σ}_{TS3}$, because of complete pinning by $\vec{σ}_{ed1}$, $\vec{σ}_{ed2}$, and $\vec{σ}_{ed3}$ from the current. According to the mechanical balance, Eq. (8) is expressed as:
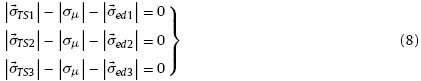
where σμ is the long-range stress, and the plastic deformation rate with the directional deflection in electroplastic compression can be expressed as follows.
$\dot{ε}_{P} =\dot{ε}_{0}$ exp{-$\frac{ΔH(0)}{ kT }$ }≈0 (9)
Eq. (9) shows that there was no directional rotation of the crystal, and no other textures were formed at B1, B2, and B3. The current energy used for suppressing crystal rotation and restraining generation of other textures can be expressed as follows.
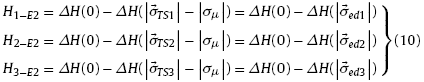
Here, H3-E2>H2-E2>H1-E2 can be derived from $\vec{σ}_{TS3}$>$\vec{σ}_{TS2}$>$\vec{σ}_{TS1}$. Combined with Eq. (6) at B1, B2, and B3, the current energy used for enhancing {110} <1$\bar{1}$1> can be expressed as follows.
Here, H1-E1>H2-E1>H3-E1 can be derived from H3-E2>H2-E2>H1-E2. Therefore, the effect of the current during electroplastic compression on the textures showed Δf(g)1-E-1>Δf(g)2-E-1>Δf(g)3-E-1 for {110}<1$\bar{1}$1> and |Δf(g)1-E-2|<|Δf(g)2-E-2|<|Δf(g)3-E-2| for the other textures.
(1) Compared to simple compression, electroplastic compression can reduce the flow stress, relieve work hardening, and improve the plasticity of the sample.
(2) The stress state of the sample is similar in electroplastic compression and simple compression. The axial compressive stress of the sample is gradually reduced from the center (the crack) to the edge of the sample; the radial tensile stress is gradually increased from the center to the edge of the sample.
(3) In electroplastic compression, current can promote uniformity of sample texture. The slip system texture is enhanced by promoting the slip of the dislocation, of which the Burgers vector is parallel to the direction of electron motion in the slip system. The other texture is suppressed by pinning dislocations of which the Burgers vector perpendicular to the direction of electron motion in the slip system.
(4) In electroplastic compression, the current energy used to influence texture is conserved, that is, the sum of the current energy used to enhance or weaken textures is constant. The current energy consumed by changing texture is an incremental function of the changed texture intensity, that is, the greater the changed texture intensity caused by electric current, the greater the current energy consumed by changing texture.
The data that support the finding of this study are available from the corresponding author upon request.
The work was financially supported by National Natural Science Foundation of China (51601011, 51874023, U1860206), Fundamental Research Funds for the Central Universities, and Recruitment Program of Global Experts.

 WeChat
/
| 〈 |
|
〉 |


