Search for articles:
Rongjian Shi , Xiaolu Pang
Corresponding authors:
Received: 2019-01-16
Revised: 2019-03-6
Accepted: 2019-04-3
Online: 2019-09-20
Copyright: 2019 Editorial board of Journal of Materials Science & Technology Copyright reserved, Editorial board of Journal of Materials Science & Technology
More
Abstract
A novel steel strengthened by nanoparticles was investigated in this study. A Fe-based high-strength steel was developed by the trace-element regional supply method during deoxidization to generate in situ nanoparticles with a high number density in the matrix. The results show that the endogenous nanoparticles are aluminum oxide (Al2O3) and titanium oxide (Ti3O5) formed in the liquid melt. Al2O3 functioned as a heterogeneous nucleation site for MnS during solidification; the size of the resultant complex inclusions was approximately 1-2 μm. Furthermore, 13 nm Nb(C,N) precipitates grew with the Ti3O5 during the tempering process. These in situ nanoparticles strongly affected refining of the grain and inclusions. The investigated steel was strengthened more than 200 MPa by precipitation strengthening and more than 265 MPa by grain refinement strengthening according to the Ashby-Orowan mechanism and the Hall-Petch relationship, respectively.
Keywords:
High-strength low-alloy (HSLA) steels are designed to provide excellent mechanical properties, including high-strength and high toughness, through alloying with trace elements such as Ti, Al, Nb, and V [1]. Low-carbon Cu-containing HSLA steels (such as HSLA-100) were developed to overcome the poor weldability and low impact toughness of HY steels, which are consequences of both its high carbon content and high carbon equivalent values [2]. The formation of Cu-rich precipitates (i.e., the Cu-rich core and a B2-Ni-Al shell, usually) is induced to increase the strength of steel via the Ashby-Orowan mechanism [2]. Decreasing the content of carbon and other alloying elements improves weldability. At the same time, the precipitates help compensate for the loss of strength due to the reduction in carbon equivalent values.
Nanostructured materials have numerous applications in steels and alloys; examples include oxide dispersion-strengthened (ODS) steels [3], Cu-strengthened HSLA-100 steels [4], ultrastrong steel via Ni(Al, Fe)-precipitates [5], and other nanoparticle-strengthened steels [[6], [7], [8]]. However, the ductility of ODS steels can be reduced by the generation of porosity during the annealing process [9]. The Cu precipitates change from circular particles to rod-shaped with loss of coherency [[10], [11], [12]] and usually suffer from rapid coarsening during annealing or tempering in Cu-bearing HSLA steels, leading to a loss of toughness [13]. Moreover, most nanoparticles in steels are generated via thermomechanical processing, which is almost the final process and may result in an unstable product.
Precipitation strengthening is an important strengthening component of HSLA steel. With the addition of microalloying elements such as titanium, niobium, and molybdenum, nanoscale carbides formed during the γ/α transformation or during tempering can result in strengths approaching 100-300 MPa, as reported in recent studies [[14], [15], [16], [17]].
On the basis of previous research [[18], [19], [20], [21], [22]], we have adopted a new method to generate nanoparticles in a liquid melt before casting. With this process, the nanoparticles, which have an average diameter of several nanometers, share a semi-coherent relationship with the ferrite matrix. These nanoparticles contribute to a substantial increase in strength without reducing the toughness and plasticity of the steel.
In this work, we employed a novel steel based on HSLA-100 and investigated the microstructure evolution of in situ nanoparticles and their effects on the steel’s mechanical properties. The strengthening mechanism of the nanoparticles in terms of solid-solution strengthening, grain refinement strengthening, and precipitation strengthening are systematically evaluated.
As shown in Table 1, the investigated steel in this study was prepared with alloy compositions based on those of HSLA-100 steel [23,24]. In addition, the oxygen concentration in the investigated steel is 16 ppm by weight, where the oxygen exists in oxide nanoparticles uniformly dispersed in the matrix. The steel was melted in a vacuum melting furnace. Notably, the Al and Ti alloying elements were added to the melt via the trace-element regional supply method in the form of Al and Ti compound twisted wires (1 mm in diameter) using a wire feeder while argon was bottom-blown before the final stage of casting. Details of this addition method can be found elsewhere [18]. The as-cast ingot was austenitized at 1100 °C for 2 h and then hot-rolled into 30-mm-thick plates in 11 passes, followed by slow cooling in a burial pit. The hot-rolled plate was subsequently cut from several locations into blocks 110 mm long (rolling direction), 30 mm wide, and 15 mm thick. These blocks were maintained at 860 °C for 1 h, immediately water quenched, maintained at 760 °C for 1 h, secondarily water quenched, and then finally tempered at 480 °C for 1 h. Specimens corresponding to both the as-cast state and the tempered state were studied.
Table 1 Alloy compositions of the steels studied (mass. %).
| Steel | C | Si | Mn | P | S | Ni | Cr | Mo | V | Nb | Al | Ti | Cu | Fe |
|---|---|---|---|---|---|---|---|---|---|---|---|---|---|---|
| This study | 0.05 | 0.30 | 1.10 | 0.007 | 0.0015 | 3.50 | 0.53 | 0.50 | 0.03 | 0.05 | 0.05 | 0.05 | / | Bal. |
| HSLA-100 [2] | 0.057 | 0.38 | 0.99 | 0.010 | 0.001 | 3.42 | 0.67 | 0.60 | / | 0.036 | 0.024 | / | 1.66 | Bal. |
Specimens for microstructure observations were ground to 5000 grit, mechanically polished, and finally etched with 4% nital solution. The microstructure of and inclusions in the steel were observed by optical microscopy (OM) and scanning electron microscopy (SEM). The microstructure and nanoparticles were further characterized by transmission electron microscopy (TEM, JEOL JEM-2100, operated at 200 kV). The TEM samples were thin foils prepared by twin-jet electropolishing, and carbon extraction replicas. Thin TEM foils were thinned at a low temperature in a 10 vol.% HClO4-methanol electrolyte. The precipitates observed as carbon extraction replicas were extracted using 10% acetylacetone-tetramethylammonium chloride-methanol and filtered through a Cu mesh; these particles were dispersed onto a microgrid coated with a carbon film for TEM observation. The structure of nanoparticles was calibrated by digital micrograph software through fast Fourier transform (FFT).
Quantitative X-ray analysis was performed using a type TTR III diffractometer. Before X-ray analysis, the specimens were electrochemically polished to relieve deformed zones on the surfaces. The X-ray diffraction (XRD) analysis was performed with Cu Kα radiation (wavelength, λ = 0.1542 nm). Normal focus tubes were used (40 kV, 30 mA). The diffraction patterns were recorded from 2θ = 40 to 120° with a step of 0.01° to cover the diffractions of the (110), (200), (211), and (310) planes. The Williamson-Hall (WH) method was used to determine the dislocation density.
Small-angle X-ray scattering (SAXS) and the Fit2d software were used to estimate the radius and volume fraction of the precipitates. SAXS experiments were carried out at the SAXS station at beamline 1W2A of the Beijing Synchrotron Radiation Facility. The distance from the sample to the detector (Mar165 CCD) was fixed at 1635 mm. The incident X-ray wavelength was 0.154 nm.
Tensile experiments and Charpy impact specimens were prepared from tempered samples. Tensile experiments were conducted on round bar specimens with dimensions of 25 mm × ⌀5 mm at a 10-3 s-1 strain rate using an FPZ 100 tensile-testing machine. Standard V-notch (2-mm depth) specimens machined from tempered samples were used for the Charpy impact tests, which were conducted at -50 °C with a ZDC2452-B machine. At least three specimens were prepared for each experimental condition.
displays the microstructure of the as-cast steel and the tempered steel. Fig. 1(a) shows that the grains in the as-cast steel are almost equiaxed and that the grain size is approximately 40 μm. After hot-rolling and heat treatment, the grains were refined to 5 μm on average, as indicated in Fig. 1(c). High-magnification SEM micrographs showing the microstructures of the as-cast steel (Fig. 1(b)) and the tempered steel (Fig. 1(d)) reveal granular bainite (M/A islands shown by red arrows and ferrites shown by white arrows) and tempered martensite, respectively.
Fig. 1. Low-magnification OM and high-magnification SEM images of microstructures of (a, b) the as-cast steel and (c, d) the tempered steel.
Fig. 2(a) and (b) shows the distribution and morphology of inclusions observed by SEM. The inclusions are all D-type (spherical oxide) inclusions with an average diameter of 2 μm according to standard GB/T 10561-2005. Energy-dispersive X-ray spectroscopy (EDS) was used to determine the elemental composition of the inclusions. The EDS results indicate that they are Al-Ti-Mg-O-Mn-S complex inclusions, as shown in Fig. 2(c). Fig. 2(d) and (e) shows the EDS results of inclusions A and B in Fig. 2(b). The EDS results indicate that the complex inclusions have a core-shell structure in which the core is mainly Al2O3 and the shell is predominantly MnS. The two complex inclusions 1-2 μm in size in Fig. 2(f) and (g) confirm that the complex inclusions have an Al2O3-core and MnS-shell structure. The EDS results for the inclusions in Fig. 2 are summarized in Table 2. The core of the complex inclusion is mainly Al2O3 (with a small quantity of Ti), whereas the shell is MnS with a small amount of CaS. The Mg and Ca in the inclusions are contaminants from the firebricks in the furnace used in the steelmaking process.
Fig. 2. Typical (a) distribution and (b) morphology of inclusions in the as-cast steel; (c) corresponding EDS spectrum of the complex inclusion in (b). (d) EDS spectrum of A and (e) EDS spectrum of B shown in (b), (f), and (g) are spectra of two typical inclusions; the insets show the EDS spectra corresponding to the core and shell.
Table 2 EDS results of inclusions in
| Inclusion in given figure | Part | O | Al | Mg | Ti | S | Mn | Ca | Total |
|---|---|---|---|---|---|---|---|---|---|
| Fig. 2(b) | Core | 58.80 | 24.45 | 11.12 | 1.90 | 1.89 | 1.21 | 0.63 | 100.00 |
| Shell | 19.07 | 6.79 | 10.55 | 0.00 | 33.13 | 26.65 | 3.81 | 100.00 | |
| Fig. 2(f) | Core1 | 59.52 | 20.58 | 11.60 | 0.24 | 4.16 | 2.09 | 1.81 | 100.00 |
| Core2 | 58.35 | 22.45 | 12.98 | 0.54 | 2.86 | 1.62 | 1.20 | 100.00 | |
| Shell | 31.41 | 12.69 | 11.21 | 0.00 | 22.12 | 15.38 | 7.19 | 100.00 | |
| Fig. 2(g) | Core | 62.23 | 21.56 | 12.76 | 1.16 | 1.34 | 0.66 | 0.29 | 100.00 |
| Shell | 9.48 | 9.26 | 17.11 | 0.81 | 37.35 | 18.29 | 7.70 | 100.00 |
Fig. 3 shows representative TEM and high-resolution TEM (HRTEM) micrographs of specimens in the as-cast condition. A bright-field image and dark-field image of the nanoparticles are presented in Fig. 3(a) and (b), respectively, with the corresponding selected-area diffraction pattern (SADP) in the inset. The diffraction spot analysis in Fig. 3(c) indicates that the second phase is Ti3O5 with a monoclinic structure [25], whereas the matrix is a body-centered cubic α-Fe structure. Fig. 3(d) is a magnified view of the nanoparticles in the matrix, and large numbers of nanoparticles are uniformly dispersed in the matrix; these nanoparticles are 5-10 nm in diameter. The HRTEM image of a typical large nanoparticle in Fig. 3(e) shows lattice fringes. This technique clearly reveals the specific crystal structure of the nanoparticles and the interface relationship between the matrix and the particles. The inset shows the SADP after FFT from the corresponding particle with a d-spacing of 0.2196 nm, corresponding to the (-204) plane (d-spacing of 0.2146 nm) of Ti3O5 [25].
Fig. 3. TEM and HRTEM images showing Ti3O5 nanoparticles in the as-cast steel: (a) Bright-field image and SADP with [-
Also, TEM observations using the thin foil and carbon replica technique reveal the presence of tempered martensite and nanoprecipitates with an average diameter of $\widetilde{1}$5 nm in the tempered steel, as indicated in Fig. 4. The matrix is bcc α-Fe, and the width of the martensite lath is approximately 300 nm, as indicated in Fig. 4(a). Fig. 4(b)-(h) shows representative TEM micrographs of nanoparticles with carbon extraction replicas. Numerous precipitates are distributed uniformly without forming clusters, and their average diameter is approximately 15 nm, as shown in Fig. 4(b). SADP analysis was conducted in the selected zone indicated by a dotted circle in Fig. 4(b). The corresponding diffraction results in Fig. 4(c) reveal two sets of spots. Table 3 summarizes the diffraction results for the precipitation. The d-spacings of 0.881 nm, 0.975 nm, and 1.083 nm measured from the diffraction spots correspond to the (314), (421), and (410) planes of Nb(C,N) [26], respectively. Also, the d-spacings of 1.458 nm, 2.058 nm, and 2.393 nm measured from the diffraction spots correspond to the (124), (-410), and (31-1) planes of Ti3O5 [25], respectively.
Fig. 4. TEM images of thin foil and carbon replica showing the presence of tempered martensite and nanoprecipitates in tempered steel. (a) bcc α-Fe matrix with martensite lath, (b) distribution of precipitates with carbon replica, (c) SADP of the region indicated by a dashed circle in (b), (d) morphology of several large precipitates, (e, f, g) the corresponding EDS spectra and a table of element contents for particles A, B, and C in (d), respectively; (h) schematic of marked SADP pattern showing Nb(C, N) (in red) and Ti3O5 (in blue).
Table 3 Diffraction results for the precipitation in
| Measured d-spacing (Å) | Precipitation types | Lattice plane | Corresponding d-spacing (Å) |
|---|---|---|---|
| 0.874 | Nb(C, N) | (314) | 0.8710 |
| 0.971 | (421) | 0.9691 | |
| 1.081 | (410) | 1.0771 | |
| 1.458 | Ti3O5 | (124) | 1.4595 |
| 2.058 | (-410) | 2.0524 | |
| 2.393 | (31-1) | 2.4022 |
To further analyze the composition and structure of the precipitation, we selected several large particles (A: 110 nm, B: 80 nm, C: 120 nm) in Fig. 4(d) for EDS analysis. A large number of precipitates with an average diameter of 10-20 nm are observed in Fig. 4(d). The EDS results indicate that the compositions of particles A, B, and C include C, N, O, Ti, Nb, and small amounts of Al and V, as shown in Fig. 4(e)-(g). The C and Cu peaks originate from the C film and Cu grid, respectively, and the Si is an impurity in the C film. Tabulated element contents after subtraction of the carbon are shown in the inset. These particles mainly contain 55% Nb, 18% O, and 10.5% Ti (all in at.%). The O-to-Ti atomic ratio is approximately 5:3, consistent with the formula Ti3O5. Also, given the SADP results for particle B, the diffraction spot analysis in Fig. 4(h) indicates that body-centered-cubic-structured Nb(C, N) (in red) and monoclinic-structured Ti3O5 (in blue) are present. The orientation relationship between Nb(C,N) and Ti3O5 is (-111)Nb(C,N)//(-3-10)Ti3O5. SADP and chemical composition analyses indicate that the precipitates in the tempered steel are mainly Nb(C,N) and Ti3O5. Nb(C, N) can nucleate on grain boundaries or dislocations in the absence of in situ nanoparticles [27,28]. After further TEM characterization, as shown in Fig. 5, we found a few simple Nb(C, N) precipitates without Ti and O. Therefore, Ti3O5 nanoparticles and dislocations have combined effects on the formation of Nb(C, N) precipitates.
Fig. 5. (a) Presence of nanoprecipitated NbC in a thin foil sample of tempered steel; (b) the corresponding EDS spectrum with a table of the element contents in the region indicated by the circle in (a).
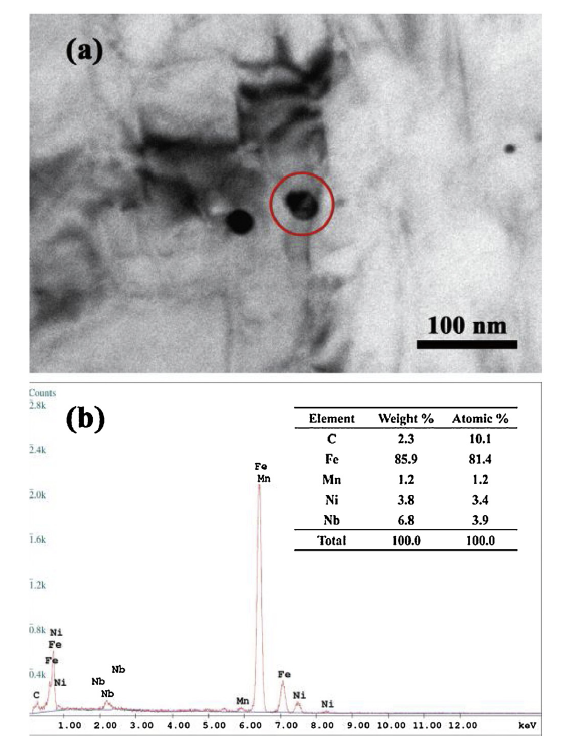
The mechanical properties of steel in this study and the HSLA-100 in Ref. [2] are shown in Table 4. Fig. 6 shows the interaction between nanoparticles and dislocations (nanoparticles shown by arrowheads and dislocations shown by arrows). Precipitation hardening resulting from the interaction between nanoparticles and dislocations occurs because the particles impede dislocation movement. After tempering at different temperatures, compared with steel HSLA-100 in Ref. [2], the ultimate strength, yield tensile strength, and elongation of steel in this study are similar. However, the Charpy V-notch energy (CVN) increases from 32 J to 115 J, as shown in Table 4. The Charpy impact energy of steel in this study is obviously improved at the same strength level. Meanwhile, when the CVN in Ref. [2] is increased to 120 J, the yield strength and ultimate tensile strength are 634 MPa and 813 MPa, respectively. SEM images of the fracture morphology in the tensile specimen and the Charpy impact specimen are shown in Fig. 7. The ductile fracture surfaces of the tensile specimen and Charpy impact specimen have mainly dimples, as indicated in Fig. 7(b) and (d), respectively. Hence, the mechanical properties of the investigated steel are superior to those of Cu-strengthened steel.
Table 4 Mechanical properties of the steel used in this study and the HSLA-100 reported in Ref. [
| Steel | Yield strength, (MPa) | Ultimate tensile strength (MPa) | Elongation (%) | CVN at -50 ℃ (J) |
|---|---|---|---|---|
| This study | 1008 | 1047 | 18 | 115 |
| HSLA-100 [2] | 1068 | 1103 | 17 | 32 |
| 634 | 813 | 24 | 120 |
Fig. 6. TEM image showing the interaction between nanoparticles and dislocations.
Fig. 7. SEM images of the fracture morphology in (a, b) a tensile specimen and (c, d) a Charpy impact specimen.
Grains solidify with a coarse columnar structure under the usual casting conditions, and the finely dispersed precipitates promote the equiaxed transition to promote grain refinement during solidification [29]. Grain refinement is an effective approach to increasing strength without loss of ductility and toughness. Oxide metallurgy technology provides an approach to refining crystalline grains using heterogeneous nucleation sites such as dispersed fine nonmetallic inclusions [30]. Heterogeneous nucleation sites with increased toughness and a high melting point, such as Ti2O3, Ti3O5, and Al2O3, can substantially refine grains by promoting the formation of ferrite [[30], [31], [32]]. In this study, the Ti3O5 and Nb(C,N) nanoparticles are heterogeneous nucleation sites that refine the grain in the process of casting and tempering, respectively. Fig. 10 shows a schematic of the trace-element regional supply method and the microstructure evolution during the casting and tempering processes.
Inclusions adversely affect the mechanical and corrosion properties of steel. Pit formation is initiated at sulfide nonmetallic inclusions, usually MnS [33,34]. Control of the sulfide shape contributes to a marked improvement in the toughness and formability of steel [35]. As shown in Fig. 2, Fig. 10(a) and (b), after Al wire was fed, a large number of small Al2O3 particles with sizes on the order of a few hundred nanometers are formed in the melt. MnS (including a small quantity of Mg) grows with Al2O3 as the core during the solidification process; the size of the complex inclusions is 1-2 μm, and their shape is spherical or elliptical. These complex inclusions control the shape and size of MnS, avoiding the detrimental effects of nonmetallic inclusions.
A high content of [Ti] will react with [O] to form Ti3O5 when Al-Ti wires are added into the melt, and nanoparticles will not grow or coarsen any further under the effect of a convection field, as shown in Fig. 10(a) and (b). This process and its thermodynamic mechanism are demonstrated in Refs. [18] and [19]. Meanwhile, Ti3O5 particles are stable, with a fine particle size in the convection field [19]. Nb(C,N) precipitates then grow with the Ti3O5 core during the tempering process, and the precipitates with a Ti3O5-Nb(C, N) core-shell structure are formed, as indicated in Fig. 10(c). Nb(C, N) particles nucleated on grain boundaries or dislocations are also shown in Fig. 10(c).
Microstructure and CVN impact properties are closely correlated [2,36]. Grain refinement has been shown to greatly enhance absorbed impact energies via a ductile fracture mechanism [37]. However, poor low-temperature toughness is usually due to coarse inclusion particles, and avoiding the formation of coarse particles during melting and solidification is critical [38,39]. The average grain size in this study was refined to 5 μm after hot-rolling and heat treatment, as shown in Fig. 1(c); the inclusions are spherical, and the average diameter is 2 μm for the Al2O3-MnS core-shell structure in Fig. 2. Hence, the microstructure and inclusion refinement caused by the aluminum and titanium oxidation reaction in the melt can improve the CVN impact properties greatly. Hence, the Charpy impact energy of steel in this study is obviously improved at the same strength level, as shown in Table 4.
Before any attempt is made to estimate precipitation hardening quantitatively, all contributions must be considered. The strengthening mechanisms in the investigated steels were comprehensively analyzed. On the basis of the primary strengthening mechanisms, the relationship between microstructure and mechanical properties was carefully evaluated. The main strengthening components contributing to the yield strength in this study are precipitation hardening, grain-size strengthening, solid-solution hardening, and dislocation hardening. The grain size and the dislocation density are indicated in Fig. 1(c) and 6, respectively.
The relationship between the microstructure and yield strength can be calculated as follows:
σy=σ0+σs+σg+σd+σp (1)
where σy is the yield strength, σ0 is lattice friction stress ($\widetilde{4}$8 MPa) [40], and σs, σg, σd, and σp are the strengthening effects caused by solid-solution formation, grain refinement, dislocation, and precipitation, respectively.
First, solid-solution strengthening of the alloying elements can be calculated by the following empirical equation [41]:
σs=5000[%C]+5000[%N]+32[%Mn]+84[%Si]+680[%P]+38[%Cu]+11[%Mo]+33[%Ni]-30[%Cr] (2)
where [%Xi] is the mass% of alloying elements in solution and [%N] is zero because all of the nitrogen atoms formed nitrides [42] such as Nb(C,N). Also, because most of the carbon atoms forms carbides and Cottrell atmosphere [43], the increase in solid-solution hardening is very low. Moreover, phosphorus, as an impurity that segregated mainly at grain boundaries, does not participate in solid-solution hardening. For the investigated steel, the alloying elements in the matrix contributed to a 170 MPa increase in the yield strength by solid-solution strengthening.
In addition, the dislocation hardening can be calculated with the following equation [44]:
σd=αMGbρ1/2 (3)
where α is a constant (α = 0.3), M is the average Taylor factor (M = 3), b is the Burger’s vector (b = 0.25 nm), G is the shear modulus (G =64 GPa), and ρ is the dislocation density in the steel. The average ρ is measured by XRD. The results of the measurement and analysis of the dislocation density by XRD are shown in Fig. 8. The XRD pattern of the investigated steel in Fig. 8(a) indicates that they are composed entirely of tempered martensite. The full-width at half-maximum was analyzed among four XRD peaks. The XRD peak width is related to the strain through the following Williamson-Hall (WH) equation [45]:
δhklcosθhkl/λ=1/D+4esinθhkl/λ (4)
Fig. 8. Measurement and analysis of the dislocation density by XRD: (a) XRD patterns of the investigated steel; (b), (c), (d), and (e) are XRD peaks corresponding to the (110), (200), (211), and (310) planes, respectively; (f) Williamson-Hall plots for the diffraction patterns of the investigated steel.
where θhkl, λ, e, and D are the diffraction angle at the selected peak position, X-ray wavelength, effective mean microstrain, and the mean size of the coherently diffracting domains, respectively. In addition δhkl is measured on a scale of 2θhkl. The dislocation density, ρ, is then calculated by the following equation [46]:
$\rho=14.4\frac{e2}{b2}$ (5)
where b is the Burger’s vector (b = 0.25 nm). The variation of the diffraction peaks corresponding to the (110), (200), (211), and (310) planes is shown in Fig. 8(b), (c), (d), and (e), respectively. Plotting δhklcosθhkl/λ vs. 4sinθhkl/λ should generate a straight line with a slope providing a value for e. The WH plots for the tempered specimen are shown in Fig. 8(f). The dislocation density, ρ, was calculated to be 3.3 × 10¹⁴ m-2, where the effective mean microstrain, e, was 1.2 × 10⁻³ on average. Hence, dislocation hardening contributes 260 MPa to the yield strength.
The relation between yield strength and grain size was calculated by the Hall-Petch equation [47,48]:
σg=kyd-1/2 (6)
where ky is the strengthening coefficient, ky is approximately 600 MPa μm1/2 in low-carbon steels [49], and d is the average grain diameter. As measured from the microstructure, d is 5 μm. Thus, grain-size refinement contributes approximately 265 MPa to the yield strength.
The contribution of precipitation strengthening to the yield strength was also calculated. The Ashby-Orowan model was applied to estimate the precipitation hardening effect [50]:
$\sigma_{p}=(0.538GBf\frac{1}{2}/X)ln(X/2b)$ (7)
where G is the shear modulus (MPa), b is the Burgers vector (mm), f is the volume fraction (%) of particles, and X is the real diameter of the particles (mm). The average real diameter and the volume fraction of nanoparticles was analyzed by SAXS, which is widely used in the analysis of steel and aluminum alloys [51,52]. The results of the analysis of the diameter and the volume fraction of nanoparticles by SAXS are shown in Fig. 9. The absolute scattering intensity curve of the investigated tempered steel is shown in Fig. 9(a). I is the absolute scattering intensity of sample (cm-1), q is the scattering vector (nm-1). Under Guinier approximation, a polydisperse system is assumed to contain finite kinds of particles with different gyration radii, as shown in equation [54]:
$I=I_{e}Nn2exp(-R_{G}^{2}q2/3)$ (8)
Fig. 9. Analysis of the diameter and the volume fraction of nanoparticles by SAXS (a) Absolute scattering intensity curve of the investigated tempered steel: I vs. q; (b) Guinier curve: ln I vs. q2, (c) Iq2 vs. q, the inset is a partial enlargement.
Fig. 10. Schematic of the trace element regional supply method, and the microstructure evolution in casting and tempering process.
where Ie is the scattering intensity of an electron (cm-1), N is the total number of particles in the volume irradiated by X-rays, n is the total number of electrons in a particle, and RG is the radius of gyration of scattering particles. From the ln[I] vs. q2 plot, as shown in Fig. 9(b), the gyration radius Rg can be obtained from the slope coefficient of each tangent; Rg is approximately 10 nm after calculation. On the basis of the spherical shape of the particles, the value of X is obtained as 13 nm with the following equation [54]:
$X=\sqrt{5/3R_{G}}$ (9)
The volume fraction of nanoparticles is obtained with the equation [55]
$Q=\int\limits^{\infty}_{0}Iq2dq=2\pi V(c-c_{0})2f(1-f)$ (10)
where Q is integral invariant (nm-3 cm-1), V is the volume of sample irradiated by X-rays, (c - c0) is the difference in electron density between the particle and the matrix [53], and f is 0.95% after calculation. Thus, precipitation strengthening contributes to a 210 MPa increase in yield strength.
Finally, σy was 953 MPa in total, which is consistent with the actual σy (1008 MPa). The decrease ($\widetilde{5}$5 MPa) of the yield strength based on strengthening mechanisms is mainly because some alloying elements (carbon, in particular) are not considered by solid-solution strengthening. Hence, the hardening effects caused by solid-solution formation, grain refinement, dislocation, and precipitation are 170 MPa, 265 MPa, 260 MPa, and 210 MPa, respectively.
(1)A novel steel strengthened by nanoparticles was cast by feeding Al and Ti compound twisted wires into the melt to obtain high number densities of in situ endogenous nanoparticles of Ti3O5 and Al2O3.
(2)Large numbers of small particles of Al2O3, with sizes on the order of a few hundred nanometers, were formed in the melt. MnS grew with Al2O3 as the core during the solidification process, the size of the complex inclusions was 1-2 μm, and their shape was spherical or elliptical. These complex inclusions controlled the shape and size of MnS to avoid the detrimental effects of nonmetallic inclusions.
(3)The Ti3O5 particles with a fine particle size were stable in the convection field. The Nb(C,N) precipitation grew with the Ti3O5 core during the tempering process, and the precipitates with a Ti3O5-Nb(C,N) core-shell structure formed.
(4)The investigated steel was strengthened more than 200 MPa by precipitation strengthening and 265 MPa by grain refinement strengthening according to the Ashby-Orowan mechanism and the Hall-Petch relationship, respectively.
Data availability
The raw/processed data required to reproduce these findings cannot be shared at this time because of technical or time limitations.
The authors acknowledge the financial support received from the National Natural Science Foundation of China (No. 51771031).
The authors have declared that no competing interests exist.

 WeChat
/
| 〈 |
|
〉 |


