Search for articles:
Xumin Zhu , Runzi Wang
Corresponding authors:
Received: 2018-12-30
Revised: 2019-01-30
Accepted: 2019-03-5
Online: 2019-08-05
Copyright: 2019 Editorial board of Journal of Materials Science & Technology Copyright reserved, Editorial board of Journal of Materials Science & Technology
More
Abstract
GH4169 at 650 °C in atmosphere was investigated by using single edge notch tensile specimens. The number of main cracks and crack initiation mechanisms at the notch surface strongly depended on the grain size. The crack initiation life accounted for more percentages of the total fatigue life for the alloy with smaller grain size. The fatigue life generally increased with increasing crack initiation life. The small crack transited to long crack when its length reached $\widetilde{1}$0 times the grain size.
Keywords:
GH4169 is a precipitation strengthened Nickel-base alloy which has similar elemental composition and microstructure as Nickel-base 718 alloy [1]. This kind of alloy has been extensively applied in aviation industries on account of its good mechanical properties and formability, and high fatigue resistance [2,3]. The components made of GH4169 superalloy, such as aircraft turbine disks, are usually subjected to frequent cyclic loading at elevated temperatures, leading to low cycle fatigue (LCF) failure. Generally, there are four stages during fatigue failure: crack initiation, small crack propagation, long crack propagation, and final fracture.
Past decades have witnessed numerous efforts on the analysis of the influence of microstructure on crack propagation behavior and growth rate of 718 alloy. Previous work indicated that the changes of microstructure, particularly grain size, could produce enormous differences in crack growth rate at high temperatures [4]. For instance, it was generally believed that the fatigue crack growth rate (FCGR) in the long crack region at high temperatures for 718 alloy with fine-grained microstructure was much faster than that with coarse-grained microstructure [[5], [6], [7], [8]]. Two main reasons may lead to this phenomenon. Firstly, relatively fine-grained materials are inclined to more severe grain boundary oxidation resulting from more grain boundary area for stress-induced diffusion of oxygen, leading to grain boundary embrittlement [9]. Secondly, the enhanced slip reversibility as well as the reduction in grain boundary area would be generated in coarse-grained alloy [8]. Recently, Hu et al. developed a modified FCGR model including a distribution factor to describe the dependence of FCGR on grain size of GH4169 alloy [10]. It was found that the fine-grained alloy exhibited higher FCGRs than the coarse-grained alloy at different temperatures from room temperature to 550 °C due to plasticity induced crack closure. Their results indicated that the plasticity induced crack closure was more prominent for the coarse-grained alloy.
On the other hand, approximately 80% of the total fatigue lives were dominated by crack initiation and small crack propagation stages in Nickel-based alloys [11,12]. Therefore, it is of great importance to reveal the fatigue crack initiation and growth mechanisms for estimating the fatigue life of in-service components, as well as establishing the methodology for damage tolerance design. However, limited/little work considering crack initiation and early small fatigue crack growth in 718 or GH4169 alloy at elevated temperature has been published [13]. The three stages of fatigue crack initiation, propagation and coalescence were recorded by the method of acetate replica in terms of Inconel 718 notched specimens at 600 °C. It was revealed that oxidation of (Nb, Ti)C primary carbides was the main reason leading to crack initiation, and small crack growth rate remained almost constant over an extensive scope of crack lengths. The fatigue crack initiation mechanism of 718 alloy at 600 °C depended on the distribution of inclusion and the grain size [13]. With increasing grain size, crack initiation sites may change from inclusions to persistent slip bands (PSBs). More recently, Deng et al. found that the crack incubation period almost equaled to at least 90% of total fatigue lifetime of GH 4169 alloy at 650 °C in atmosphere [14]. In addition,the presence of δ phase along with grain boundaries was beneficial to extend the crack initiation life and consequently to prolonge the total fatigue lifetime. Generally, microstructure and environment played predominant roles in fatigue crack initiation and the following small crack propagation behavior at high temperatures [15]. However, for GH4169 alloy at 650 °C, few studies on the impact of grain size on small fatigue crack growth are available. The objective of this study was to explore the influence of grain size on the crack initiation and multi-scale crack growth behavior of GH4169 at an elevated temperature of 650 °C [16].
GH4169 superalloy was manufactured by two-stage procedures: hot rolling and vacuum induction melting. This alloy is prominent for high niobium and iron contents (see Table 1) and is composed of austenitic face-centered cubic-Ni matrix and the strengthening precipitated phases of γ' and γ” particles.
Table 1 Chemical compositions of GH4169 alloy (wt%).
| Ni | Cr | Mo | Al | Ti | Nb | Mn | Si | C | Fe |
|---|---|---|---|---|---|---|---|---|---|
| 53.02 | 19.05 | 3.00 | 0.50 | 0.93 | 5.11 | 0.03 | 0.10 | 0.033 | Bal. |
Three heat treatments (HTs) with different processing parameters were performed in a SX2-410 chamber electric furnace. The specimens with the size of 8 mm × 6 mm × 5 mm for microstructure characterization as well as cylindrical shaped specimens with dimensions of Φ17 mm × 210 mm for mechanical tests were put in the furnace with a stationary temperature. Each HT included the following two stages, the solution annealing and the two-stage aging. The processing parameters used in the HTs were selected according to the time-temperature-transformation diagram for 718 alloy [17]. The main differences among the three different HTS were the solution temperature and time, as shown in Table 2. Then, the solution-annealed specimens were subjected to standard ageing treatment: first-stage ageing treatment at 720 °C for eight hours followed by cooling to 620 °C at the cooling rate of 50 °C/h, and second-stage ageing treatment at 620 °C for the next eight hours. Eventually, the specimens were treated by air cooling till the room temperature. Same alloys with different HTs were respectively defined as HT1, HT2 and HT3 alloys.
Table 2 Processing parameters used in HTs (AC denotes air cooling).
| HT1 | 960 °C for 1 h, AC to 720 °C |
|---|---|
| HT2 | 1050 °C for 1 h, AC to 720 °C |
| HT3 | 1090 °C for 1 h, AC to 960 °C, 960 °C for 1 h, AC to 720 °C |
These cubic shaped specimens after HTs were subjected to cold mounting, during which epoxy resin and hardener were mixed in a certain proportion. Then, cross-sectional surfaces for microstructural characterization were ground by using 400, 600, 800, 1200, to 2000 grit SiC paper successively and polished by diamond paste of 1 μm. Then, the specimens were etched using Nimonic etchant [12]. Finally, the microstructures of the specimens after three HTs were examined by Scanning Electron Microscopy (SEM, Zeiss EVO MA15, Germany). The grain sizes of each treated specimen were statistically measured by Image-Pro plus (IPP) software.
For investigating the small fatigue crack behavior, the single edge notch tensile (SENT) samples with a notched radius of 3 mm were prepared, as shown in Fig. 1. On account of the local stress concentration at the notch, the small cracks would initiate at the root of the notch, where the elastic stress concentration factor is about 2.77 using finite element analysis. To guarantee the good finish degree of specimens, the notch surfaces were well polished and etched, as the same for heat-treated cubic shaped specimens.
Fig. 1. Shape and dimensions of SENT specimens used in fatigue testing.
The stress-controlled fatigue test was carried out on MTS 809 A/T testing system under sine-wave loading waveforms at 650 ± 2 °C in air environment. Fatigue testing frequency and stress ratio were 0.5 Hz and 0.1, respectively. Maximum loading stress at the center of each specimen was fixed to be 550 MPa.The stress applied was equivalent on the cross-section of the reduced area of the specimen. The area of the specimen in gauge-length was put within the constant temperature zone in the heating furnace to ensure the uniform distribution of temperature and control the temperature perturbation. The temperature of the sample surface during testing was monitored by a R-type thermocouple, which was connected with the middle of each specimen. Moreover, the samples were heated at 650 °C for 1 h to minimize the temperature difference inside of the samples before fatigue experiments.
The surface crack at the root of the notch was monitored by means of the method of two-part silicon based replica during the tests. The detailed replicating procedure can be found in previous work [1,12,16]. Fatigue tests for replicas were interacted in sequence with a determined cyclic interval when the fatigue specimens were cooled down to room temperature (RT) and a tensile stress of 80% of maximum fatigue stress was held to take replicas from the root of the notch. Above-mentioned cyclic interval was determined based on the number of cycles to failure of the parallel sample without replicas. All tests with replicas were terminated with the formation macroscopic crack, which was enough to lead to the final fracture. The macroscopic crack, or defined as the major crack, could be easily identified from the replicas. Then, by examining the replicas at these cyclic intervals, crack initiation at the root of the notch would be traced. By means of optical microscopy (OM) with a high-resolution of 0.1 μm, the crack morphology of the dried replicas were obtained. Herein, the projected crack length to the loading direction was regarded as the crack length. Then, the crack growth rate during fatigue testing was calculated by an so-called incremental polynomial method [1,12,16]. Following the fatigue test, the fracture appearance of each specimen was examined by SEM. The detected crack was similarly identified as a semielliptical surface crack. The stress intensity factor range, ΔK, was determined by the following formula [18,19]:
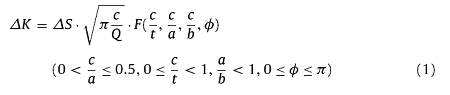
Q=1+1.464⋅($\frac{2c}{a}$)1.65(0<$\frac{2c}{a}$≤) (2)
where ΔS denotes applied stress range on the cross section, Q is shape factor, F means boundary-correction factor, a is crack length, c represents maximum crack depth determined through observing the fracture appearance, b and t represent the half width and thickness on the crosssection, respectively, and φ is the angular function. The calculation of the parameter of F can be referred to this work [18]. The purpose of ΔK in this manuscript is to verify whether the fatigue crack growth rate can also be correlated with ΔK at the initiation and propagation stages of small cracks.
The heat-treated microstructures of GH4169 alloys are shown in Fig. 2. The statistical measurements of the grain sizes of HT1 and HT2 alloys are respectively shown in Fig. 3(a) and (b) by IPP software. For HT1 alloy, the grain diameter is within the range of 5-21 μm, whose average value is about 12 μm. The average grain sizes of GH4169 alloys after different HTs are summarized in Table 3, where da and dr denote the average grain size and grain size range respectively. Obviously, the grain size increases gradually with raising the solution annealing temperature. Continuous needle-like δ phase precipitates uniformly along the grain boundaries in HT1 alloy, the volume fraction of which in HT 1 alloy is around 12%. However, almost no δ phase precipitates in HT2 and HT3 alloys. Plenty of δ phase precipitate along grain boundaries at about 871 °C and have the solvus temperature of 1020 °C [20]. The peak rate of the precipitation temperature is at a temperature around 900 °C. Therefore, the annealing treatment at 960 °C for 1 h results in this precipitation of δ phase in HT1.
Fig. 2. Microstructures of GH4169 alloys after different HTs: (a) HT1; (b) HT2; (c) HT3.
Fig. 3. Probability density functions of grain size of (a) HT1 and (b) HT2 alloys.
Table 3 Grain size and tensile properties of GH4169 alloys after different HTs.
| HT | dr (μm) | da (μm) | σuts (MPa) | σy (MPa) | e (%) |
|---|---|---|---|---|---|
| HT1 | 5-21 | 12 | 1189.1 | 1024.4 | 10.56 |
| HT2 | 29-82 | 48 | 989.5 | 833.8 | 26.88 |
| HT3 | 31-208 | 83 | 974.2 | 810.6 | 32.40 |
The ultimate tensile strength σuts, yield strength σy and elongation to failure e of the three treated GH4169 alloys are also listed in Table 3. The tensile strength increases and the elongation decreases with decreasing grain size.
Six SENT specimens are used in the fatigue tests and the fatigue life of each specimen are listed in Table 4. The replica and non-replica test conditions denote that fatigue tests with and without interruptions, respectively. Nf is the fatigue life, i.e. the number of cycles to final fracture, N0 is the number of cycles at which the first crack initiates, n is the amount of major cracks, and Nf-N0 is the number of cycles during the crack growth. Firstly, one can note that the fatigue life of GH4169 alloy generally decreases with increasing grain size. Secondly, when the specimens are subjected to the same HT condition, the fatigue life of the non-replica specimen is closely comparable to that of the replica specimen. Thus, the fatigue life repeatability of two parallel samples under the same loading condition could be acceptable. Therefore, in this study, the influence of the replica procedures on the fatigue crack propagation could be neglected. Thirdly, only one main crack can be found at the surface of HT1 specimen, while multi-cracks can be found at the surfaces of HT2 and HT3 specimens with relatively larger grain sizes.
Table 4 Fatigue lives and crack initiation lives of SENT specimens.
| Specimen | HT condition | n | Nf (cycle) | N0 (cycles) | N0 -Nf (cycle) | Test condition |
|---|---|---|---|---|---|---|
| 1 | HT1 | 1 | 19973 | 8000 | 11973 | Replica |
| 2 | HT2 | 6 | 5979 | 800 | 5179 | Replica |
| 3 | HT3 | 4 | 5705 | 400 | 5305 | Replica |
| 4 | HT1 | 21195 | No-replica | |||
| 5 | HT2 | 5838 | No-replica | |||
| 6 | HT3 | 5531 | No-replica |
In this work, the crack initiation sites and mechanisms are identified by examining the surface replicas which are taken at the early stage of the interrupted tests. Fig. 4, Fig. 5 respectively show the images from replicas taken at different cycle intervals of HT1, HT2 specimens. For the HT1 specimen, the main crack initiates from the second-phase particle after around 8000 fatigue cycles. Hence, the crack initiation life accounts for around 40.0% of the total fatigue life. Hence, there is a relatively long incubation period at the start of the test when no crack is observed. Then the crack propagates in an intergranular mode in the early stage, as shown in Fig. 4(a) and (b), the path of which is approximately perpendicular to the loading axis. To display the crack propagation mode in the early stage, the grain boundaries around the secondary phase were marked in white, as shown in Fig. 4(b). After 18,400 fatigue cycles, the crack quickly propagates, as seen in Fig. 4(d). There are in total six main cracks at the surface of HT2 specimen. These cracks are numbered from 1 to 6 in Fig. 5. Crack 1 was observed after around 800 fatigue cycles. Hence, the crack initiation occupies only 13.4% of the total fatigue life. Then cracks 2-6 continuously initiate. Cracks 1, 2 and 6 initiated from the grain boundary and the other cracks initiated along the PSBs. These cracks propagate along the directions at certain angles to the loading direction. After 4600 cycles, the coalescence of all cracks lead s to the final fracture of the specimen, as seen in Fig. 5(d).
Fig. 4. Images from replicas after (a) 13900, (b) 14500, (c) 16000, (d) 18,400 and (e) 19,100 cycles showing initiation and growth process of main crack at surface of SENT specimen HT1 with average grain size of 12 μm.
Fig. 5. Images from replicas after (a) 2200, (b) 3100, (c) 3600 and (d) 4600 cycles showing initiation and growth process of main cracks at surface of SENT specimen HT2 with average grain size of 48 μm.
Four main cracks are detected at the surface of the HT3 specimen. Three cracks initiate along the slip bands and only one crack from the grain boundary. Cracks 1-3 are seen in Fig. 6. The mixed transgranular-intergranular mode could account for the fatigue crack propagation for HT3 specimen. The first crack, i.e., crack 1, is observed after around 400 fatigue cycles. Hence, the ratio of N0/Nf is only 7.0%. Hence, from Fig. 4, Fig. 5, Fig. 6, the following two results can be obtained. Firstly, the crack initiation life occupies a larger percentage of the total fatigue life in the specimen with a smaller grain size. Secondly, the fatigue crack initiates at second phase particles of the specimen with a small grain size. With increasing grain size, the fatigue crack preferentially initiates along the PSBs.
Fig. 6. Initiation sites of three main cracks at surface of SENT specimen HT3 with average grain size of 83 μm after 1600 cycles: (a) crack 1; (b) cracks 2 and 3.
Fig. 7(a)-(c) shows the major crack length, a, as a function of fatigue cycles, N, for HT1, HT2 and HT3 specimens, respectively, in which crack m-n denotes the nth main crack in the mth specimen. One can note that the crack nucleation can be delayed through decreasing the grain size. For specimen HT2, the combination of cracks 2-4, 2-5 and 2-6 occurs after 3600 cycles. Then, the coalescence of cracks 2-2 and 2-4 occurs after 4200 cycles. When the length of crack is higher than a critical one, the small cracks would rapidly turn to macroscopic ones and then result in the final fracture. However, the values of critical crack length are different for different specimens. For instance, critical lengths for specimens HT1 and HT2 are about 100 μm and 500 μm, respectively.
Fig. 7. Variations of lengths of main cracks along with number of fatigue cycles for specimens (a) HT1, (b) HT2 and (c) HT3.
As shown in Fig. 8(a), the crack length as a function of the cycle ratio, N/Nf, for HT1, HT2 and HT3 specimens are plotted, where the temporary arrest of crack growth are indicated by the arrows. Furthermore, the variations of normalized crack length versus the cycle ratio for different specimens are obtained in Fig. 8(b). In fact, the normalized crack length is the number of grains intersected by the growing crack front, which is defined as the ratio of crack length, a, and average grain size, da. It is interesting to find that when the crack length is larger than 10 times the grain size, the crack will propagate rapidly. Hence, we can draw the conclusion that when the crack length is about 10da, the small crack stage will transit to long crack stage. In such a case, for HT1 specimen with grain size of 12 μm, the crack initiation stage and small crack propagation stage consume $\widetilde{9}$0% of the total fatigue life. However, for specimens HT2 and HT3 with relatively large grain sizes, the percentage is only around 55%.
Fig. 8. Variations of (a) crack length and (b) normalized crack length of different SENT specimens along with cycle ratio.
Fig. 9 shows the variation of the fatigue crack growth rate, da/dN, with the crack length, a, for HT1, HT2 and HT3 specimens. Crack propagation rate is determined through using a point-to-point method. [1]
$\frac{da}{dN}=\frac{\Delta{a}}{\Delta{N}}=\frac{a_{i+1}-a_i}{N_{i+1}-N_i}$ (3)
where ΔN and Δa represent the cycles interval and crack extension, respectively; ai is the crack length at surface at the ith cycle. It can be shown that the small crack growth rates do not increase with increasing crack length, as it was normally observed for long cracks [3]. Moreover, the fluctuations of crack growth rate are obvious in the small crack growth stages. Temporary arrest of the major crack takes place in HT1 specimen. The length at which the major crack temporarily arrested is around 77 μm, which is around 6 times the average grain size. Thus, it is speculated that the temporary arrests phenomenon could be on account of the obstruction of grain boundaries.
Fig. 9. Variations of crack growth rates along with crack length of specimens (a) HT1, (b) HT2 and (c) HT3.
Fig. 10 shows the crack growth rate as a function of the normalized crack length, a/da. Firstly, one can note that when the crack length is shorter than one grain size, the crack growth rate almost linearly increases with extending the crack length in the log-log coordinates. This trend is particularly clear for specimen HT2 or HT3 with relatively large grain size. Secondly, when the crack length is in the range between one grain size and ten grain sizes, the crack growth rate shows obvious fluctuations. Thus, it can be deduced that the crack growth rate is obviously affected by the microstructure, including the grain boundary, grain orientation, twin boundary and the interaction between adjacent cracks. Nevertheless, in general, average crack growth rate increases with grain size. Except for some data-points with high fluctuations, crack growth rate can be considered to be constant in this region. Thirdly, within the normalized crack length range higher than 10, the crack grows in the long crack stage. Thus, crack growth rate also linearly increases with the increasing of crack length for specimen HT1.
Fig. 10. Variations of crack growth rates against normalized crack length, a/da of three different SENT specimens.
Fig. 11, Fig. 12, Fig. 13 show the fracture surface morphologies of specimens HT1, HT2 and HT3. The fatigue cracks initiate from the surfaces in all specimens. It is observed in Fig. 11(b) that the crack propagation is manifested as an intergranular mode in the small crack stage of specimen HT1. Then, the mixed transgranular-intergranular fracture mode is observed in the long crack stage, as shown in Fig. 11(c). The crack propagation mode in the depth directions of specimens HT2 and HT3 are also initially intergranular as well, and then followed by transition stage to transgranular fracture, as seen in Fig. 12, Fig. 13. The fatigue striations within the long crack stage can be found in specimens HT2 and HT3. This fracture mode suggests that the crack growth be governed by the plastic blunting mechanism [10,21]. Moreover, the fatigue striation width in the long crack stage of specimen HT3 is relatively lower than that of specimen HT2. This result indicates that the crack growth rate in the long crack stage of specimen HT3 is larger than that of specimen HT2. Moreover, the existence of twin boundaries will change the direction of the crack growth, as pointed out by the arrows in Fig. 13(b), indicating that twin boundaries present barriers to dislocation motion [22].
Fig. 11. (a) SEM image of entire fractured surface of HT1 specimen, high magnification SEM images of (b) region A and (c) region B.
Fig. 12. (a) SEM image of entire fractured surface of HT2 specimen, high magnification SEM images of (b) region A and (c) region B.
Fig. 13. Fracture surface morphologies of HT3 specimen in (a) small crack and (b) long crack stages.
The grain size has a significant impact on the crack initiation mechanism and fatigue life of Inconel 718 and GH4169 alloys [1,8,10,12,13,23]. Deng et al. investigated the crack initiation mechanisms in GH4169 alloys with grain diameters of 9, 15 and 25 μm at RT [1]. Their results indicated that the fatigue cracks are inclined to initiate at the positions of secondary phase particles for those specimens with comparatively small grain diameter of 9 μm. Usually, carbide or niobide inclusions are treated as the secondary phase particles in GH4169 alloy, which are formed in the cooling process after the alloy ingot is smelted. However, the cracks preferentially initiate at grain boundaries for the alloys with large grain diameter of 25 μm. Spath et al. used around 3000 cylindrical specimens to reveal the influence of grain size on the low cycle fatigue lives and crack initiation mechanisms of Inconel 718 alloy at 350 °C [23]. Results showed that the mechanisms of fatigue crack initiation relied heavily on the grain size. When the grain size was finer than about 10 μm, fatigue cracks preferred to initiate at some secondary phase particles. Crack initiation along PSBs was observed in the coarse-grained alloys. Alexandre et al. obtained the similar results as well for 718 alloy at 600 °C [13]. Then, they proposed a fatigue life prediction model to identify the transition in the crack initiation mechanisms.
In this work, the transition stage of fatigue crack initiation between fine grain size and coarse grain size is also observed (see Fig. 4, Fig. 5, Fig. 6). When the grain size is 12 μm, only one main crack is observed to initiate from the second-phase particle. The embrittlement due to oxidation of second-phase particle and subsequent volume expansion might be the main reason for crack initiation. Deng et al. [14] studied the fatigue crack initiation mechanism of GH6169 alloy at 650 °C, the average grain size of which is 9 μm. Results indicated that there was a substantial volume expansion during the oxidation of second-phase particle, leading to additional mismatch strain field between the oxidizing particle and the neighboring matrix. This field was superimposed on the external loading, leading to plastic deformation that was sufficient to suffer microscopic rupture and the subsequent crack initiation at the root of notch. For the specimens HT2 and HT3, with grain sizes of 48 and 83 μm, several main cracks initiate from the grain boundary and slip bands. However, with increasing grain size, the main crack preferentially initiates along the intense slip bands. This result is consistent with that obtained by Alexandre et al. for 718 alloy [13].
It is known that the damage in nickel-based alloys during fatigue testing is mainly due to the combination of intergranular cracking from grain boundaries and PSBs [24]. Main cracks initiate along GBs where impinging slip leads to localized plastic incompatibility and high stress concentration. Fig. 14 shows the crack 6 in HT2 specimen surface and the corresponding fracture morphologies. It can be seen that the PSBs are formed at neighboring grains. Previous studies indicated that the intergranular fatigue cracking mode is heavily dependent on the interaction of grain boundaries and PSBs in grains under fatigue [25]. Generally, one can believe that the cavity and fatigue crack nucleations are due to the stress concentrations at the grain boundaries where the interaction of PSBs and GBs takes place [26,27].
Fig. 14. Crack 6 at surface of HT2 specimen: (a) intergranular cracking caused by impingement of slip bands upon grain boundary; (b) fracture morphology near region A; (c) fracture morphologies near region B.
Incubation and initiation of microcracks account for a substantial portion of fatigue life. For 718 and GH4169 nickel-based alloys, the previous experimental data showed that the crack initiation and small crack growth consumed about 60%-90% of the fatigue life [1,14,28,29]. Based on the collection of the previous experimental data by Deng et al. [1,14] and the present experimental data, the relationships between crack initiation life, N0, and fatigue life, Nf, of the SENT specimens tested at RT and 650 °C are shown in Fig. 15. It is interesting to find that the magnitude of N0 linearly increases with increasing Nf in double log coordinates. Moreover, the life ratio N0/Nf is in the range between 0.19 and 0.54 for specimens tested at room temperature. For the specimen tested at 650 °C, the range which changes from 0.07 to 0.93 is relatively large. Previous research indicated that the fatigue crack initiation mechanism and crack initiation life should be responsible for the scattering of fatigue lives at a given testing condition [1]. Hence, from Fig. 15, it can be concluded that the fatigue lives of GH4169 alloys at 650 °C could show more scattering than those at room temperature.
Fig. 15. Variation of crack initiation life N0 along with fatigue life Nf of SENT specimens tested at room temperature and 650 °C.
The present experimental results indicated that the crack initiation life increases with reducing grain size. The values of N0/Nf are respectively 0.40, 0.13, and 0.07 for the alloys with the average grain sizes of 12, 48, and 83 μm, which indicating the fatigue life of coarse-grained ally is mainly occupied by the fatigue crack growth to failure. A microstructure-based mechanical model for crack initiation at slip bands and inclusions has been proposed, which also gave the result that the crack initiation life decreased with raising the grain size [30].
The small crack growth rates exhibit obvious fluctuation, as shown in Fig. 9. Our previous work indicated that several factors, including the position of crack initiation, interaction between adjacent small cracks and obstruction of grain or twinning boundaries, have great impact on small crack growth rates [14]. After detailed observation of the crack morphology of replicas and analysis of the relationship between crack growth rate and crack length, it can be concluded that grain boundaries and twins have a great effect on deceleration and acceleration of the small crack growth rate for GH4169 alloy. For instance, the blocking effects of GBs as well as twins on the deceleration of small crack growth for specimen HT2 can be seen in Fig. 16. For crack 1, when fatigue crack propagates through the grain boundary after 2200 cycles, the crack growth rate increases quickly, as shown in Fig. 16(a). After fatigue cycles reach 2800, the crack tip encounters the twin boundary, resulting in a significant deceleration of the crack. For crack 4, the hindering effect of GBs on the deceleration of the crack is also obvious (see Fig. 16(b)). When fatigue cycles reaches 4500, the coalescence of the cracks 4 and 5 can be observed, leading to the acceleration of combined crack.
Fig. 16. Variation of crack growth rates along with length of (a) crack 2 and (b) crack 4 at surface of specimen HT2, where the blocking effects of grain boundaries and twins on the deceleration of small crack growth can be found.
Previous studies found that there should be a transition period to rapid crack growth until the end of fatigue life once the critical small crack length shows [29]. The critical crack length of GH4169 alloys with the grain sizes of 9, 15, 25 μm was around 200 μm at RT [1]. This means that the critical crack lengths for different alloys are respectively 22, 13, and 8 times the average grain size. However, a different result was obtained by Zhu et al. [29] They determined that the critical crack length of GH4169 alloy with grain size of 16 μm was around 500 μm at room temperature, which was around 31 times the average grain size. The difference may be due to the differences of microstructure, applied load and specimen geometry during testing. In the present work, the critical crack length is around 10 times the average grain size for all specimens with three kinds of grain sizes (see Fig. 10), which agrees well with the work done by Taylor and Knott [31]. They suggested that the transition crack length from small crack to long crack should be 5-10 times the average grain size.
The crack growth rate as a function of the stress intensity factor range, ΔK, for specimens HT1, HT2 and HT3 are shown in Fig. 17. It is assumed that the shape of cracks at the root of the notches are semi-elliptical and the ratio a/c in Eq. (1) is set to be 2. Moreover, the long crack growth rate of GH4169 alloy measured under the similar conditions are utilized to compare [32]. One should note that the long crack growth rate was measured using the compact tension (CT) specimen and the average grain size was not given. Hence, the crack growth rate dc/dN is assumed to be half of da/dN in Fig. 17. It can be noted that the dc/dN-ΔK curve of the CT specimen almost coincides with that of specimen HT1 when the magnitude of ΔK is higher than 10 MPa m1/2. This result indicates that the ΔK could be treated as a parameter relating the small crack growth rate and long crack growth rate. However, the small crack growth rates have obvious fluctuation and scattering for specimens HT2 and HT3.
Fig. 17. Crack growth rate as a function of stress intensity factor range ΔK for specimens HT1, HT2 and HT3, where the data of long crack [
In this work, the grain size effect on the high-temperature crack initiation mechanism and multi-scale propagation mechanism of the typical GH4169 Ni-base alloy at 650 °C using SENT specimens was investigated. The specimens with three grain sizes were obtained by different heat treatment processings. The main conclusions are drawn in the following:
(1) For the alloy with the grain size of 12 μm, only one main crack initiated from the second-phase particle. For the alloys with large grain sizes, i.e., 48 and 83 μm, the multi-cracks initiated along the slip bands and grain boundaries at the notch surfaces. With increasing grain size, the fatigue crack preferentially initiated along the slip bands.
(2) The fine-grained alloy generally exhibited high crack initiation life and total fatigue life. For the alloys with the grain sizes of 12, 48, and 83 μm, the crack initiation lives respectively accounted for around 40.0%, 13.4% and 7.0% of the total fatigue lives. Moreover, the fatigue life increased with increasing crack initiation life.
(3) The fluctuations of crack growth rate were obvious in the small crack growth stages for all specimens, which could be due to the obstruction effect of grain boundaries as well as twins on the deceleration of crack growth. However, the transition stage from small to long crack occurred for same alloys with different grain sizes once the crack length reached 10 times the grain size.
This work was financially supported by the National Natural Science Foundations of China (Nos. 51725503, 51605164 and 51575183) and the 111 project. The author X.C. Zhang is also grateful for the support by Shanghai Technology Innovation Program of SHEITC (No. CXY-2015-001), Fok Ying Tung Education Foundation, and Young Program of Yangtze River Scholars. Y.F. Jia is also grateful for the support by Shanghai Sailing Program (No. 16YF1402300) and Shanghai Chenguang Program (No. 16CG34).
The authors have declared that no competing interests exist.

 WeChat
/
| 〈 |
|
〉 |


