Search for articles:
Alexander I. Ikeuba , Jianqiu Wang
Corresponding authors:
Received: 2018-10-13
Revised: 2018-11-27
Accepted: 2019-01-22
Online: 2019-07-20
Copyright: 2019 Editorial board of Journal of Materials Science & Technology Copyright reserved, Editorial board of Journal of Materials Science & Technology
More
Abstract
The galvanic corrosion of the Q-phase/Al couple in 0.1 M NaCl solutions has been studied using the scanning vibrating electrode technique (SVET), the scanning ion-selective electrode technique (SIET) and energy dispersive X-ray spectroscopy (EDX). The galvanic corrosion of the Q-phase/Al couple was found to be dependent on pH and immersion time. Current density maps obtained by SVET shows that the anodic oxidation processes emerge from Al in a localized manner in pH 2 and 6 solutions but is initiated in a uniform manner in pH 13 solution, whereas, the cathodic processes are more homogeneously distributed over the Q-phase at pH 2, 6 and 13. It is seen that the Q-phase remains cathodic in the Q-phase/Al couple in acidic, neutral and alkaline solutions indicating that the galvanic polarity of the Q-phase is independent of pH. The effect of the galvanic corrosion was largest at pH 2 and 13 compared to pH 6. The pH map obtained by SIET indicates that the galvanic activity of the Q-phase/Al couple proceeds via heavy alkalization of the Q-phase surface with the generation of appreciable amounts of OH- ions. The enrichment of Cu indicated by EDX is responsible for the observed cathodic activity of the Q-phase in the Q-phase/Al couple.
Keywords:
Localized corrosion of 6xxx series Al-alloys (Al-Mg-Si-Cu alloys) remains a vital issue as pitting or intergranular corrosion decreases the longevity of structural components used in the automobile and aerospace sectors [1,2]. These alloys are increasingly being sought because of their optimum strength, formability, weldability and corrosion resistance. Intergranular corrosion susceptibility is high in these alloys due to the galvanic coupling of the Al-alloy matrix with grain boundary precipitates which include the Q-phase (Al4Cu2Mg8Si7) and its precursors [[3], [4], [5]]. The Q-phase does not have any precise stoichiometry and a wide range of varying compositions have been reported which includes Al5Cu2Mg8Si6, Al4CuMg5Si4, Al4Cu2Mg8Si7, Al3Cu2Mg8Si6 and Al3Cu2Mg9Si7 [[6], [7], [8]].
Studies on 6xxx Al-alloys with respect to the influence of heat treatment [[9], [10], [11]] and alloying elements [1,3] reveal that the Q-phase play a pivotal role on the intergranular corrosion susceptibility. Svenningsen et al. [1,12] studied variants of Al-alloys having different Cu content and Mg:Si ratio and showed that the Q-phase was present in the grain boundaries of all the variants that were susceptible to intergranular corrosion. The intergranular corrosion susceptibility was attributed to micro galvanic coupling between the noble Q-phase grain boundary precipitates and the adjacent matrix. Kairy et al. [5,13] reported that the Q-phase is noble compared to the Al-matrix and other intermetallic phases present in the alloy matrix and undergoes incongruent dissolution with fine nanoscale Cu particles appearing after a period of corrosion. Li et al. [9] reported that the intergranular corrosion susceptibility of Al-Mg-Si-Cu alloy under heavily overaged condition results from the anodic dissolution of the precipitation-free zones around the grain boundary with the Q-phase acting as a continuous cathode.
Generally, the intergranular corrosion susceptibility is increased by the presence of Si and Cu but decreased by the presence of Mg [9,14,15]. Also, alloys containing Cu are more susceptible to intergranular corrosion than Cu free alloys [3]. In Al-alloys, Si has been shown to be a poor cathode relative to the matrix [3,16,17]. However, to date, no studies have been carried out to improve the current understanding of the micro galvanic activity of the Q-phase/Al-alloy couple in the acidic, neutral and alkaline environment. Thus certain information about the effect of pH and exposure time on the galvanic corrosion mechanism of the Q-phase/Al-alloy couple remains an open challenge.
The galvanic activity of the Q-phase/Al couple may be predicted by comparing the corrosion potential of the Q-phase with that of the matrix; however, forecasting the galvanic current density distribution over the Q-phase is somewhat difficult. Attending to these concerns regarding the current density distribution at the microscale is paramount in understanding the mechanisms of the galvanic corrosion process of the Q-phase/Al couple [18,19]. Obtaining this information on a micro scale would require in-situ techniques with a spatial resolution capable of resolving the electrochemical reactivity on the galvanic couple surface which cannot be acquired using traditional electrochemical methods [20]. The methods that have been shown to be suitable for giving a spatial mechanistic insight on local currents and pH distribution are the scanning vibrating electrode technique (SVET) and the scanning ion-selective electrode technique (SIET), respectively. SVET is capable of sensing anodic and cathodic processes in active sites on surfaces by means of a vibrating microelectrode while SIET can sense pH variations on a surface via an ion-selective microelectrode [21,22]. The SVET has been used to treat many corrosion problems like the galvanic corrosion of intermetallic phases [18,19,23] and the galvanic corrosion of welded steels [24]. SVET and SIET have also been combined with other electrochemical and surface analysis techniques in corrosion studies [18,21,23,[25], [26], [27], [28]]. In our recent work, we used SVET and SIET to study the galvanic corrosion of Al/MgZn2 in aqueous solutions at different pH values [19] and demonstrated that the dissolution of MgZn2 depended on the pH and exposure time. Current density maps obtained by SVET showed that MgZn2 was anodic relative to Al at pH 2 but cathodic at pH 12, while self-dissolution of MgZn2 occurred largely between pH 4 and 6. Indeed, the size, type, and distribution of intermetallic particles will greatly influence the electrochemical behavior of the bulk alloy, Therefore, detailed knowledge about intermetallic particles in the Al alloy is needed when exploring the corrosion mechanism [29]. The small size of the Q-phase intermetallic in Al-6xxx alloys (nanometer-sized) [6] is a challenge in the use of conventional microelectrochemical testing techniques. In order to increase the sample size for experiments, the bulk Q-phase intermetallic particle is synthesized.
In this study, we present a report on the distribution of Faradaic currents and pH over a Q-phase/Al couple in 0.1 M NaCl solutions using the SVET and SIET, respectively followed by the analysis of the corroded surface using EDX coupled to SEM (scanning electron microscope). The concept of this study is to improve our understanding of the galvanic activity of the Q-phase/Al couple by measuring the current density and pH over time.
The bulk intermetallic Q-phase ingot used for this study was manufactured by China Material Technology Co. Ltd. and pure Al was bought from Goodfellow Cambridge limited. The bulk form of the Q-phase was synthesized via powder metallurgy by combining appropriate proportions of commercially pure Al (99.99%), Cu (99.99%), Mg (99.99%) and Si (99.99%). The details of the synthesis of the Q-phase ingot was sourced from the equilibrium phase diagrams [30,31] and the identity of the sample was confirmed using EDX coupled to SEM and XRD. The atomic percentages of the Mg, Al, Si, and Cu in the synthesized Q-phase (Al4Cu2Mg8Si7) are 39.65%, 16.30%, 33.84% and 10.22%, respectively.
The Q-phase ingots were mounted in contact with epoxy resin with an exposed area of 1 cm2. The sample surfaces were ground to 5000 grit with silicon carbide papers, cleaned with ethanol, dried in warm air and immediately taken for electrochemical tests. The solutions used were prepared with analytical grade chemicals and distilled water. Electrochemical measurements were carried out in a corrosion cell containing 300 mL of electrolytes using the three-electrode system with the test sample as working electrode, platinum plate as the counter electrode and saturated calomel electrode as the reference electrode. All electrochemical tests were carried out in 0.1 M NaCl solution in an aerated environment at an ambient temperature of (21 ± 2 °C). The pH adjustments of the test solutions were done using H2SO4 and NaOH to desired pH values of 2, 6 and 13. All electrochemical experiments were carried out using a Gamry R600+ potentiostat. Potentiodynamic polarization tests of the Q-phase and pure Al were performed at a scan rate of 1 mV/s after monitoring the open circuit potential (OCP) for 15 min.
The galvanic potential and current flowing between the Q-phase and pure Al was also recorded directly by the electrochemical station using the zero resistance ammeter (ZRA) in pH 2, 6 and 13 solutions. The setup consisted of a three-electrode system with the Q-phase as the working electrode 1, pure Al as the working electrode 2 and the saturated calomel electrode (SCE) as a reference electrode.
2.3.1. Sample preparation
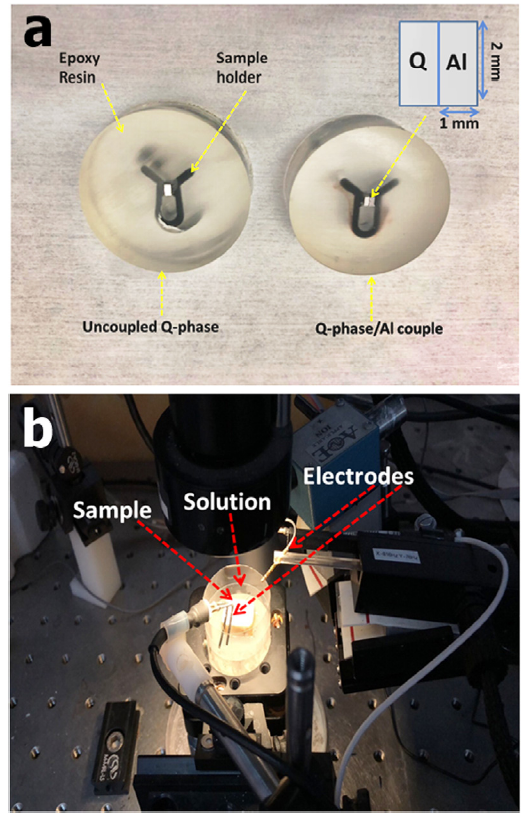
The Q-phase and pure Al were cut into 1 mm × 2 mm × 4 mm tablets. They were then coupled together along the 4 mm length with the aid of a clip, sealed at the rear by a conductive silver paste and mounted in an insulating epoxy resin (Fig. 1(a)). The exposed surface of the Q-phase/Al couple (4 mm2) and the uncoupled (2 mm2) Q-phase was then successively ground using ethanol down to 5000 grit with silicon carbide papers and transferred to the analysis chamber (Fig. 1(b)). SVET and SIET measurements were taken using a system from Applicable Electronics Inc. (USA) which is controlled by the Science Wares ASET 2.0 software.
Fig. 1. (a) Typical samples for SVET/SIET experiments (b) SVET/SIET scanning chamber showing the sample-probe (electrodes) arrangement.
2.3.2. SVET experiments
The current density distribution on the Q-phase/Al couple and the uncoupled Q-phase were successfully acquired by SVET under open circuit conditions. Prior to each SVET experiment, the resistivity of the testing solution was measured by a conductivity meter, which was fed into the software to calculate the current density. The Pt-Ir probe (Microprobe Inc.) was platinized to form a 20 μm diameter thick coating of platinum black at the tip of the probe. The probe vibration perpendicular to the sample surface was maintained at a frequency of 330 Hz. The local current densities were mapped over a 40 × 40 grid generating a mesh of 1600 data points and the time of acquiring each SVET data point was 0.9 s. The current densities were detected at 100 μm above the sample surface within an area of 4 mm2 for the coupled samples and 2 mm2 for the uncoupled samples in 0.1 M NaCl solution at pH 2, 6, and 13. During the SVET test, a pre-installed optical microscope was used to examine the corrosion morphologies of the samples to ensure no crevice corrosion on the edges. After each scanning test, the sample cell was transferred into a humidistat to reduce evaporation. All SVET experiments were carried out in the naturally aerated solutions at ambient temperature (21 ± 2 °C).
2.3.3. SIET measurements
SIET test was carried out in order to obtain the distribution of H+ ions [32] over the Q-phase/Al couple. SIET measurements were taken by mounting home-made ion-selective microelectrodes (ISME) on the same scanning system used for SVET to control the position and program the measurements. H+ ion distribution was made by back-filling silanized glass micropipettes with the inner filling solution (0.01 M KH2PO4 in 0.1 M KCl) and tip filling with hydrogen ionophore I cocktail B (Fluka, Ref. 95293). The column length of the membrane was about 60-70 μm. The pH-ISMEs were calibrated before and after each experiment using commercial pH buffers. The inner reference electrode used was a chlorinated Ag wire inserted in the inner filling solution. The external reference electrode used was an Ag/AgCl mini-electrode with an agar stabilized 0.05 M NaCl salt bridge from Microelectrode, Inc. (MI-402). The auxiliary electrode was two ring-shaped platinum black wires. All measurements were taken in a Faraday cage at room temperature. The activity of ionic H+ was detected at 50 μm above the sample surface. Time of data acquisition at each point is 3 s for potentiometric microsensors.
A consecutive SVET-SIET was carried out in order to clearly assign the evolution of acidity and alkalinity to the appropriate regions on the surface of the Q-phase/Al couple. The consecutive SIET-SVET scan was commenced after 1 h of exposure in pH 6 solution. The SVET was taken first after 1 h of exposure and then SIET was taken after 1 h 30 min of exposure resulting in a time lag of 30 min between the two experiments. These measurements were carried out at pH 6 only because changes in the concentration of H+ ions at very high (pH 13) or very low (pH 2) pH were not detectable by the selective microelectrode. The SVET and SIET data were visualized in contour maps using the QuikGrid software.
It is important to state that in reality, the Q phase will be much smaller than the bulk phase and be finely dispersed in the Al-alloy matrix, hence, the anode-to-cathode ratio will significantly differ from the 1:1 ratio, and furthermore, there will be a dispersion effect [33]. Thus the results presented herein are semi-quantitative and is aimed at reflecting the distribution and trend of the galvanic activity over the Q-phase/Al couple [32].
The relative atomic percentages of the constituent elements in the Q-phase after 24 h of SVET test of the Q-phase/Al couple in 0.1 M NaCl were analyzed by EDX coupled to SEM.
The potentiodynamic polarization curves of bulk Q-phase (anodic branch) and pure Al immersed in 0.1 M NaCl solution at different pH are presented in Fig. 2. The corrosion potential of the Q-phase is observed to be more noble than that of Al at pH 2, 6 and 13. This places the Q-phase as a net cathode in acidic, neutral and basic solutions. This result suggests that the galvanic polarity of the Q-phase is independent of pH value. Interestingly, considering the high Mg content of the Q-phase ($\widetilde{3}$8%), the corrosion potential is expected to be lowered below that of Al in acidic and neutral solutions, but this was not the case. Fig. 2 indicates that at similar potentials, the anodic activity of the Al is greater than that of Q-phase at pH 2, 6 and 13. However, at pH 2 (Fig. 2(a)), at the onset of polarization the anodic activity on the Q-phase is seen to be greater than that on Al, this can be attributed to the initial preferential dissolution of Mg. After considerable layers of the Q-phase dissolve, enrichment of more noble elements like Cu and Si occur thus causing a decrease in its anodic activity. At pH 13 (Fig. 2(c)) a limiting current is seen which may be attributed to the formation of a protective film over the Q-phase. The peak around 0.5 VSCE in Fig. 2(c) may be attributed to the breakdown and re-passivation of the protective film formed on the surface. The potentiodynamic polarization curves of bulk Q-phase (cathodic branch) and pure Al immersed in 0.1 M NaCl solution at different pH are presented in Fig. 3. The galvanic potentials estimated from the point of intersection between the curves in Fig. 3 at pH 2. 6 and 13 are -0.71 VSCE, -0.82 VSCE and -1.55 VSCE, respectively. This suggests that the galvanic potential increases with an increase in pH. From Fig. 2 it can be inferred that galvanic activity between the Q-phase and Al is more thermodynamically and kinetically favored in the alkaline region.
Fig. 2. Typical polarization curves of the Q-phase (anodic branch) and pure Al in 0.1 M NaCl solution at different pH values.
Fig. 3. Typical polarization curves of the Q-phase (cathodic branch) and pure Al in 0.1 M NaCl solution at different pH values.
The galvanic potential between the Q-phase (working electrode 1) and pure Al (working electrode 2) and the corresponding galvanic current flowing across the two electrodes was also recorded directly using ZRA and presented in Fig. 4. The measured potential is related to the mixed potential between the two electrodes and should normally correspond to the intersection of the cathodic branch of the Q-phase with the anodic branch of Al in Fig. 2. The net galvanic currents that were measured decreased in the order; pH 13 > pH 2 > pH 6. However, it is important to note that Fig. 4 was obtained from three solutions at pH 2, pH 6 and pH 13, thus cannot fully express the trend of the corrosion potential and galvanic current considering the fact that the corrosion behavior of Al may reverse under certain conditions.
Fig. 4. Variation of galvanic current and potential between the Q-phase and pure Al in 0.1 M NaCl solutions in pH 2, 6 and 12 solutions. (The surface area of each electrode is 1 cm2).
It is worthy of note that this approach to assess the galvanic activity of the Q-phase from polarization measurements for each metal does not reflect the real galvanic potential/current of the Q phase/Al-alloy couple in real systems. This is because the Q-phase is small and finely dispersed in the Al-alloy matrix and the area fraction of the Q-phase comes into play [34]. Therefore, this result can only be used for a qualitative assessment.
3.2.1. SVET current density distribution on Q-phase/Al couple
SVET contour plots were used to spatially visualize the current density distribution at different pH values for different durations and the maps are presented in Fig. 5, Fig. 6, Fig. 7. The exposed surfaces of the Q-phase and Al are shown by the area bounded by the white broken lines on the left and right-hand side, respectively. Anodic and cathodic zones were noted with the progress of corrosion which corresponds to the red and blue colored regions on the maps, respectively. For a given map, the intensity of the color is directly proportional to current density. The positive current flux is due to the metal dissolution and the negative current flux is due to reduction reactions [21,33]. Fig. 5, Fig. 6, Fig. 7 show that the anodic and cathodic current distribution changed with time.
Fig. 5. SVET current density distribution over the Q-phase/Al couple in 0.1 M NaCl solution at pH 2 after (a) 1 h, (b) 6 h, (c) 24 h and (d) optical micrograph after 24 h.
Fig. 6. SVET current density distribution over the Q-phase/Al couple in 0.1 M NaCl solution at pH 6 after (a) 1 h, (b) 6 h, (c) 24 h and (d) optical micrograph after 24 h.
Fig. 7. SVET current density distribution over the Q-phase/Al couple in 0.1 M NaCl solution at pH 13 after (a) 1 h, (b) 6 h, (c) 24 h and (d) optical micrograph after 24 h.
In pH 2 solutions, cathodic current is seen to emerge from the Q-phase while anodic current is seen to emerge from the Al. Consecutive scans initially exhibited an increase in electrochemical activity of the Q-phase/Al couple up to 6 h after which the electrochemical characteristics remained fairly constant till 24 h of exposure. The cathodic current density was fairly uniform although regions of high and low values were noted with values around -250 μA/cm2. However, the anodic current distribution of Al displayed a stochastic pattern, with values as high as 1000 μA/cm2 and low as 250 μA/cm2 in some zones (Fig. 5(a)). The magnitude of the sum of the cathodic current density on the Q-phase was generally lower than the anodic current density on Al. This imbalance is because Al also contributes as a cathode in the early stages of corrosion and the detected cathodic current on Q-phase before 6 h is part of the total cathodic current evolved by the Q-phase/Al couple (Fig. 5(a)). Although the potential difference between the Q-phase and Al is less pronounced at pH 2 (Fig. 2), it is possible that the initial dissolution of Mg can cause the Q-phase to be temporarily anodic at the early stages of corrosion thus the cathodic process observed on the pure Al. The optical image of the corroded Q-phase/Al galvanic couple after 24 h is shown in Fig. 5(d). Bubbles are seen on the Q-phase which implies that hydrogen reduction reactions still occur even after long immersion times (<24 h) and this observation is consistent with the SVET maps (Fig. 5(a-c)).
The Q-phase/Al couple in pH 6 solution displayed lower current densities compared to pH 2. The cathodic flux was distributed all over the Q-phase surface while the anodic flux seemed to emerge from a localized area. The maximum anodic and cathodic current density recorded was about 400 μA/cm2 and -150 μA/cm2, respectively (Fig. 6(a)). With the progress of galvanic corrosion, the current density distribution on the Q-phase changed only slightly while more anodic sites emerged on the Al surface which is reflected as the yellowish spots in Fig. 6(b) and (c). This increase in spotting may be attributed to the breakdown of the passive film that is formed on Al in neutral solutions. The optical micrograph of the galvanic couple surface is shown in Fig. 6(d) and it correlates well with the diminished current densities on the Q-phase/Al surface as no significant darkening was observed. In consideration of the fact that Mg dissolution occurs at the early stages of corrosion, the H2 evolved may not be visible because the optical image was taken 24 h after which the H2 gas may have escaped.
In pH 13 solutions (Fig. 7(a)) the cathodic current density distribution was uniformly sustained on the Q-phase with a cathodic flux of around -7500 μA/cm2. Unlike the pH 6 solution, the anodic flux was evenly distributed over the Al with an anodic flux of around 7500 μA/cm2. This may be attributed to the active dissolution of Al in alkaline solutions according to E-pH diagrams. The current density pattern did not change significantly over time, however, the current flux was observed to decrease with time (Fig. 7(b) and (c)). This result is similar to reports in our previous work [19] and Li et al. [18] for Al/MgZn2 and Al/MgSi couple in the alkaline solution, respectively. Under this regime, stable Mg corrosion products are believed to be formed on the Q-phase although Al dissolution still occurs actively. Optical micrographs of the Q-phase/Al couple after SVET test for 24 h are shown in Fig. 7(d).
The resistivity of the solutions is an important parameter to be considered when discussing galvanic corrosion. In aqueous solutions, current flows by ion transport therefore with an increase in the amount of ions present in the solution, conductivity increases while resistivity decreases. The resistivity of the solutions recorded at pH 2, 6 and 13 are 72.78 Ωcm, 93.90 Ωcm and 35.45 Ωcm, respectively. This suggests that the decrease in the resistivity of the solution may also contribute to the observed high galvanic current in acidic and alkaline solution.
The SVET results (Fig. 5, Fig. 6, Fig. 7) have provided supplementary information on the galvanic corrosion of the Q-phase on the microscopic scale thus taking care of certain limitations of electrochemical tests. These limitations include the inability of the potentiodynamic curves to provide information on current density distribution in different pH regimes especially under near neutral conditions (pH 6) where localized anodic zones were observed to characterize the electrochemistry of Al (Fig. 6(c)). However, other aspects such as the prediction of the galvanic polarity and trend in current density with pH of the Q-phase/Al couple by the electrochemical tests were consistent with the SVET results. It is noted that there are also limitations associated with the SVET measurements particularly when the diameter of the tip of the vibrating probe is larger than the anode-cathode spacing of active sites, thus making it difficult to detect currents on anodic and cathodic sites that are too close.
3.2.2. SVET current density distribution map of the uncoupled Q-phase
SVET current density maps were acquired over the uncoupled Q-phase in order to ascertain the extent of the influence of galvanic coupling of Q-phase with Al. The pattern of current density distribution on the surface of the uncoupled Q-phase after immersion in 0.1 M NaCl solution for 1 h at different pH values are shown in Fig. 8(a)-(c). It was noticed that anodic as well as cathodic zones appeared on the Q-phase in pH 2, 6 and 13 solutions. The SVET results demonstrate that localized corrosion occurs on the Q-phase in acidic, neutral and alkaline solution. The lowest current flux was at pH 6 (Fig. 8(b)) and the highest was at pH 2 followed by pH 13 (Fig. 8(a) and (c)). The Optical micrographs of the uncoupled Q-phase couple after SVET test in 0.1 M NaCl solution for 1 h are shown in Fig. 10(d)-(f). H2 evolution is observed at pH 2 (Fig. 8(d)) and pH 13 (Fig. 8(f)). It is noted that the current flux on the uncoupled sample may not reflect the true value due to limitations of the vibrating microelectrode especially when the anodic and cathodic sites are so close below the resolution of the technique [18,35]. For instance, the uncoupled sample reflects the current density at pH 2 > pH 13 which may not be true while the coupled sample and potentiodynamic curves indicate the current density at pH 13 > pH 2.
Fig. 8. SVET current density distribution over the uncoupled Q-phase in 0.1 M NaCl after 1 h solution at (a) pH 2, (b) pH 6, (c) pH 13 and the corresponding optical micrographs at (d) pH 2, (e) pH 6, (f) pH 13.
3.2.3. Comparison of cathodic current densities on coupled and uncoupled Q-phase
In order to determine the extent of the influence of the galvanic coupling of Q-phase with Al, the average cathodic current density in the cathodic zones of Q-phase in the SVET maps was calculated. It is important to note that quantification of the cathodic response from the Q-phase is not accurate because minor anodic activities might have not been detected. The cathodic current density was compared rather than the anodic current density because the Q-phase is cathodic relative to the matrix and comparing the inconspicuous anodic currents will not reveal the extent of the galvanic coupling of the Q-phase with Al. The algebraic mean of the negative current densities measured directly by the SVET was obtained and a quantitative comparison of the average negative current density for coupled Q-phase/Al and uncoupled Q-phase is illustrated in Fig. 9. The effect of galvanic coupling was pronounced in pH 2 solutions, the average negative current density obtained after 1 h for the coupled and uncoupled Q-phase are -250 μA/cm2 and -150 μA/cm2, respectively. This indicates that the Q-phase significantly promotes the anodic dissolution of Al at pH 2 since the complementary redox reaction for the reduction reactions on the Q-phase is Al dissolution. The difference in the cathodic current was also observed to decrease with increase in exposure time (Fig. 9(a)). In pH 6 solutions, the average cathodic current density obtained after one hour for the coupled and uncoupled Q-phase specimen is -60 μA/cm2 and -50 μA/cm2, respectively. This also indicates that the Q-phase promotes the anodic dissolution of Al at pH 6. The difference in cathodic flux between the coupled and uncoupled samples remained fairly constant with time. The cathodic current density was observed to decrease slightly with time up to 24 h (Fig. 9(b)). At pH 13, the average negative current densities that were obtained after 1 h for the coupled Q-phase/Al and uncoupled Q-phase are -7500 μA/cm2 and -160 μA/cm2, respectively. The difference in the cathodic current density between the couple and the uncoupled sample was also observed to drastically decrease with increase in exposure time (Fig. 9(c)). This relatively high current density may be attributed to the active dissolution of Al which is highly favored in alkaline solutions as is evident from the anodic current flux on Al.
Fig. 9. Comparison of the average negative current densities on the surface of coupled and uncoupled Q-phase after SVET tests at (a) pH 2, (b) pH 6 and (c) pH 13.
Fig. 10. Consecutive SIET-SVET scan of the Q-phase/Al couple after 1 h in 0.1 M NaCl solution at pH 6: (a) SVET current density map, and (b) SIET pH map.
Although there is a possibility that not all cathodic currents were captured in the coupled and uncoupled sample, the results (Fig. 9) demonstrates that the Q-phase significantly promotes the anodic dissolution of Al in pH 2, pH 6 and pH 13 solutions. The SVET results provided a good spatial resolution which clearly shows that it is possible to get complementary data supporting the physical interpretations of the galvanic activity (Faradaic currents) combined with the application of other electrochemical techniques [18,19,21,23,33].
3.2.4. A consecutive SVET-SIET scan of the Q-phase/Al couple
In order to acquire the spatial pH distribution over the corroding Q-phase/Al couple, SIET test was carried out. Fig. 10(a) and (b) present the consecutive SVET-SIET scan of the Q-phase/Al couple after 1 h in 0.1 M NaCl solution in pH 6 solution. Fig. 10(a) shows a localized region of anodic activity on the Al surface while a general distribution of cathodic current density was observed over the Q-phase. Fig. 10(b) indicates a pH as high as pH 12 over the whole Q-phase surface while the pH on the Al surface increased slightly. The comparison of Figs. 10(a) and 9(b) disclose a very high degree of consistency in the assertion that large amounts of OH- ion are produced by the cathodic reactions on Q-phase surface [19,36]. The cathodic activity on Cu-rich surfaces is often related to oxygen reduction reactions because hydrogen evolution is not likely to occur on Cu-based cathodes due to the very high overpotential of the reaction [37,38]. However, Mg supported reduction reactions which occurs due to the widely reported “negative difference effect” is overwhelmed by reduction reactions on Cu. The pH over the galvanic couple can be seen to decrease in the direction of the white arrow in Fig. 10(b); this is attributed to the migration of OH- ions towards the Al surface. However, a region of very low pH was seen in Fig. 10(b) indicated by the white circular broken lines. This low pH region happens to coincide in magnitude and sense to the region of high anodic activity on Al in the SVET map (Fig. 10(a)). The lower pH on Al can be attributed to the hydrolysis of Al3+ ions which are generated by the dissolution of Al. Fig. 10(b) further confirms that the Q-phase is a predominant cathode when galvanically coupled to Al. It is expected that the pH change at both anode and cathode may also occur at other pH value but the detection limit of SIET did not allow the sensing of the pH distribution in strong acidic and alkaline solutions. This is due to the fact that at very high [H+] or [OH-], slight changes in pH are inconspicuous and thus undetectable.
The relative atomic percentages Al, Cu, Mg and Si on the Q-phase surface after SVET measurements for 24 h at various pH values was analyzed by SEM/EDX and the results obtained are shown in Fig. 11. For reference purpose, the atomic percentages of the elements on the surface before SVET tests are included in the plot. Fig. 11 indicates active Mg dissolution accompanied by Cu and Si enrichment in pH 2 solutions. In pH 6 solution, slight dissolution of Al and Mg is observed accompanied by an enrichment of Cu and Si. Under near-neutral conditions, Al is capable of forming a stable passive oxide film whereas Mg can only form a fairly stable film. At pH 13, the atomic percentages of Mg and Al decrease slightly, that of Si remains constant while that of Cu increased. This may be attributed to the dissolution of Mg to form a stable film and the dissolution of Al that goes into solution.
Fig. 11. EDX evaluation of the relative atomic percentages of the component elements in the Q-phase surface after 24 h of SVET test in 0.1 M NaCl solution at pH 2, 6 and 13.
The relative percentages of the alloying elements after SVET test suggest the corrosion of the Q-phase is via the selective dissolution of Mg and Al followed by Si which leads to Cu enrichment on the matrix/film interface. The surface analysis results are in agreement with a recent work by Kairy and coworkers who indicated incongruent dissolution of the Q-phase in Al alloys may occur via Mg, Si and Al dissolution, along with an enrichment of nanoscale Cu particles upon the Q-phase [5,6].
The galvanic corrosion of the Q-phase/Al couple has been evaluated using an electrochemical approach (Fig. 2, Fig. 3, Fig. 4) and the SVET approach (Fig. 5, Fig. 6, Fig. 7). Results obtained demonstrate that the galvanic corrosion of the Q-phase/Al couple depends on pH and immersion time. The galvanic corrosion potential of the Q-phase/Al couple shifts to more negative values with increase in pH (Fig. 4), whereas the galvanic corrosion current density increases with increased deviation from the neutral environment (Fig. 4). The distribution of current density over the galvanic couple showed different characteristics at different pH values and the magnitude of the galvanic current was seen to follow the order; pH 13 > pH 2 > pH 6. SVET current density maps of Q-phase/Al (Fig. 5, Fig. 6, Fig. 7) indicate that the Q-phase is capable of sustaining a cathodic flux in acidic, neutral and alkaline environments when coupled with Al (Fig. 5, Fig. 6, Fig. 7). The SVET maps reveal that the severity galvanic coupling effect is more pronounced in very acidic or alkaline environment (Fig. 9). Results obtained from electrochemical measurements and the SVET both indicate that the Q-phase is cathodic relative to Al and the galvanic polarity of the Q-phase is independent of pH. SEM/EDX results (Fig. 11) reveals Cu enrichment on the Q-phase which is probably the main reason for Q-phase being cathodic relative to Al in the galvanic couple.
The Q-phase (Al4Cu2Mg8Si7) contains 4 different alloying elements which are bound to influence its corrosion behavior in different ways. According to E-pH diagrams, Mg dissolves actively in acidic and neutral solutions but passivates in alkaline solutions of pH > 10 while Al passivates between pH 4 and 9 but dissolves actively in alkaline and acidic solutions. Reports indicate that Cu supports reduction reactions whereas Si has been noted to be an ineffective cathode [39,40].
In very acidic solutions (pH 2), the Q-phase maintained its role as cathode notwithstanding the relatively high percentage of Mg which is expected to give it an anodic feature. A possible reason for this is that Mg dissolves quickly at the early stages of corrosion and the subsequent Cu enrichment places the Q-phase a net cathode. This suggests that the cathodic contribution by Cu in the Q-phase probably masks the anodic contributions by other elements. A similar phenomenon has been reported to occur on the S-phase (Al2CuMg) in which Cu re-deposition occurs resulting in the weak detection of anodic dissolution from the S- phase. The anodic activities tend to take place progressively at deeper locations inside the sponge-like structure as the is the top layers of the remnant become increasingly more porous and richer in Cu [27]. In the acidic region, the main cathodic reactions envisaged to occur on the Q-phase is given in Eqs. (1) and (2) while the main anodic reaction is given in Eq. (3) [41].
2H+ + 2e- → H2↑ (1)
O2 + 4H+ + 2e- → 2H2O (2)
Mg→Mg2++2e- (3)
In literature, some Cu containing intermetallics like Al2Cu have also been reported to be cathodic relative to the Al-alloy matrix in acidic solution [42] in contrast to other non-Cu containing intermetallics such as Al3Mg2 [43] and Mg2Si [18] which were reported to be anodic.
At pH 6, the galvanic current on the Q-phase is lower compared to other pH values (Fig. 6); however, the cathodic flux on the Q-phase was widely distributed and the main cathodic reaction in this regime is given in Eqs. (4) and (5).
O2+2H2O + 4e-→OH- (4)
2H2O+2e-→2OH-+H2↑ (5)
At pH 6, the dissolution of Al in Q-phase/al couple assumed a rather localized pattern which appears to emanate from a center. This is consistent with the current understanding of the passivation behavior of Al in neutral electrolytes; hence the localized features are attributed to passive film breakdown sites. The consecutive SVET-SIET scan (Fig. 10) confirmed heavy alkalization over the Q-phase which diffuses across to the Al surface. The reason for this pH increase on the Q-phase may be attributed to the generation of OH- ions via combination Cu-enhanced reduction reactions [3,16,17] and partly by anodic hydrogen evolution (anodic HE) by Mg [19]. The anodic HE is the increase in the rate of hydrogen gas evolved from Mg surfaces under anodic polarization in aqueous electrolytes. Evidence from experiments strongly shows that the anodic HE can significantly increase with the increase of the anodic dissolution rate although the physical reason for the anodic HE is still not clear [44]. It is expected that the enhanced anodic HE may have an influence on the corrosion of the Q-phase. In Fig. 10(b), the resulting pH distribution on the Q-phase is homogeneous, while the current distribution is not; therefore revealing that part of the cathodic activity is being canceled out by anodic reactions (Mg dissolution). This is in agreement with the EDX results which indicate the occurrence of Mg selective dissolution. In Fig. 10(b), the low pH region on Al matches to the anodic center which corresponds to the region of Al3+ hydrolysis (Eq. (6)) which generates H+ ions and causes the pH to drop.
2Al3++ 3H2O → Al2O3+ 6H+ (6)
In pH 13 solutions, the highest galvanic current density and most negative galvanic potential were recorded (Fig. 4). This implies that the galvanic corrosion of the Q-phase is kinetically and thermodynamically most favored in the alkaline region. At pH 13 the active dissolution of Al causes the evolution of a relatively high anodic current flux on Al which on the other enhances the complementary reduction reactions on the Q-phase, thus the relatively high currents observed in pH 13.
The present studies suggest that the role of the Q-phase as a cathode in the Q-phase/Al couple can be attributed mainly to Cu enrichment since Si is an inefficient cathode [3,16,17]. Polarization data obtained on pure Si and Cu, reported elsewhere, indicates the cathodic current density of Si is much smaller than that of Cu and that Si is a kinetically poor cathode although it is less active than Al [3]. More also, the SiO2 commonly formed have been noted to be an ineffective cathode [9]. Birbilis et al. and other authors reported that Cu containing intermetallics in Al alloys are capable of supporting oxygen reduction reaction [[45], [46], [47]]. Hence, the Q-phase can sustain a heavy cathodic flux on itself with the generation of OH- ions which results from oxygen reduction reactions on Cu and this significantly promote the anodic dissolution of Al.
Electrochemical methods combined with SVET and SIET have been successfully used to evaluate the galvanic activity of Q-phase/Al couple. Separate anodic and cathodic features were observed on Q-phase/Al couple. However, for situations where the anode-cathode spacing is so close below the spatial resolution of the vibrating electrode, the measured current may be misestimated. In this case, the effect of Q-phase in promoting Al dissolution can be overestimated. These scanning electrode techniques have provided supplementary information (current density distribution and pH distribution) needed to clarify certain aspects of the galvanic corrosion of the Q-phase/Al couple. The discussions above indicate that the Q-phase in Al 6000 alloys will take the role of a cathode regardless of the pH value and cause the dissolution of the adjacent Al- matrix. Thus, the Q-phase, if present along grain boundaries, could lead to severe peripheral Al-matrix dissolution.
(1)The galvanic corrosion of the Q-phase/Al couple depends on pH and immersion time. The galvanic corrosion potential of the Q-phase/Al couple shifts to more negative values with increase in pH, whereas the galvanic corrosion current increases with increased deviation from the neutral region.
(2)The Q-phase is cathodic relative to Al in acidic, near neutral and alkaline solutions indicating that the galvanic polarity is independent of pH. The effect of the galvanic coupling is more pronounced at pH 2 and 13 compared to pH 6.
(3)At pH 2, the anodic dissolution of Al in the Q-phase/Al couple is stochastic. At pH 6, the anodic dissolution of Al seems to emerge from a localized center while at pH 12 the anodic dissolution of Al is uniform.
(4)The Q-phase can significantly promote the anodic dissolution of Al and sustain a heavy cathodic flux on itself with the generation of OH- ions from Cu enhanced reduction reactions.
This work was financially supported by the National Natural Science Foundation of China (Grant No. 51571201).
The authors have declared that no competing interests exist.

 WeChat
/
| 〈 |
|
〉 |


