Search for articles:
X.Y. Jiao
Corresponding authors:
Received: 2018-09-23
Revised: 2018-10-25
Accepted: 2018-11-5
Online: 2019-06-20
Copyright: 2019 Editorial board of Journal of Materials Science & Technology Copyright reserved, Editorial board of Journal of Materials Science & Technology
More
Abstract
The fracture behavior of high-pressure die-cast hypereutectic (HPDC) Al-Si alloys was investigated using a high-resolution laboratory CT and synchrotron X-ray tomography with a particular focus on the influence of HPDC microstructure. Results showed that microstructure of the alloy was mainly comprised of primary silicon particles (PSPs), Al dendrites, Cu-rich phases and pores. Most of the coarse PSPs, Cu-rich phases and pores were located in the center of the specimen. The rapid solidification of HPDC led to a heterogeneous microstructural feature. Elemental Cu was enriched in the frontiers of solid-liquid interface, causing the formation of large size dendritic arms. The pores were formed in the interdendrites which endured high stress intensity under high applied stress. Microcracks were originated from pores and further connected Cu-rich phases causing intergranular fracture. PSPs worked as obstacles causing piling-up dislocations in the phase interface. In the regions where large size of PSPs enriched in, PSPs ruptured rather than debonded from matrix, indicating transgranular fractures of PSPs. Microcracks originated around pores and PSPs tended to converge on the main cracks to decrease the energy required for crack propagation.
Keywords:
Hypereutectic Al-Si alloys have been extensively applied in automotive industry for producing cylinder blocks of combustion engine. Affected by primary silicon particles (PSPs), hypereutectic Al-Si alloys normally exhibit high wear resistance and low thermal expansion. However, Yang et al. [1] and Haghayeghi et al. [2] believed low ductility restricted the application of hypereutectic Al-Si alloys. Li et al. [3] found that the elongation had not been improved very well in hypereutectic Al-Si alloys, even though size, morphology and distribution of PSPs were well controlled by alloying modification or rapid solidification.
High pressure die casting (HPDC) is extensively applied for manufacturing complex components with thin wall. In HPDC, rapid filling and fast solidification lead to refined microstructure. Mondal et al. [4] and Santos et al. [5] found that fine microstructure and superior mechanical properties could be obtained by HPDC. However, particular microstructure like externally solidified crystals (ESCs), defect bands (DBs) and porosity exists in castings, which is detrimental to high elongation. In addition, microstructural heterogeneity in HPDC hypereutectic Al-Si alloys would cause local stress concentration and decrease the mechanical properties. Using synchrotron X-ray tomography, Wang et al. [6] found ring-like PSPs-free and PSPs-rich zones in HPDC Al alloy A390. Li et al. [7,8] studied on the mechanical properties of HPDC of Mg alloy AM60B and found both ESCs and DBs promoted crack initiation and propagation. Dahle et al. [9], [10], [11] and Li et al. [12], [13], [14] believed that the microstructural formation in HPDC alloys was affected by flow speed. By designing different runner and inner gates, they discovered that the formation of ESCs and DBs was affected.
Initiation and propagation of cracks were affected by coarse primary silicon particles (PSPs) and porosity. As for PSPs, Yu et al. [15] studied the fracture behavior of hypereutectic Al alloy A390 and observed interfacial de-cohesion between primary Si and Al matrix during tensile tests. Kwang et al. [16] investigated extrusion of spray-formed Al-25Si-X composites and found that cracked Si particles were present on the crack surface. Cha et al. [17] believed the cracks would move around PSPs, increasing the crack propagation distance and blocking further fracture. As for porosity, Prakash et al. [18] found microcracks were originated from network pore and extended along broken intermetallic hard phase in HPDC alloy. Lu et al. [19] analyzed a stress field around a pore by finite element simulation in cyclic behavior and found the crack initiation driving force was highly sensitive to the casting pore features. However, unlike hypoeutectic Al-Si alloys, it is so hard to observe the initiation and propagation of crack by in-situ tensile tests because of brittle transient characteristics. New characterization of hypereutectic Al-Si crack is deserved to be proposed.
In this study, the fracture mechanism of high-pressure die-cast hypereutectic Al-Si alloys was studied. We employed synchrotron X-ray tomography and high-resolution laboratory CT to characterize both microstructure distribution and 3-D fracture morphology of the specimens. The influence of pores, PSPs and Cu-rich phases on crack initiation and propagation was discussed in detail.
Three hypereutectic Al-Si alloys, as designated by A, X and S were used in the experiments. TOYO BD-350V5 cold chamber die casting machine was employed for casting work (Fig. 1(a)). A standard tensile testing bar with a diameter of 6.4 mm was illustrated in Fig. 1(b). Fig. 1(c) shows key processing parameters adopted in the experiment including melting temperature (750 °C for alloy A and X, 780 °C for alloy S, i.e., 80 °C above the liquidus of the alloys), initial mold temperature (150 °C), slow-shot speed (0.1 m/s), fast-shot speed (2.75 m/s) and mold holding time (8 s). The die material was H13 steel. A vacuum system, similar as that in ref. [13] was used in the experiments.
Fig. 1. Configuration of (a) casting produced by HPDC, (b) tensile test bar and sampling locations, (c) key processing parameters in HPDC, (d) Vickers hardness test, (e) chemical composition of three hypereutectic Al-Si alloys, and (f) stress-strain curve of alloys A, X and S.
Fig. 1(b) shows the sample location and configuration for hardness tests, CT, OM and synchrotron X-ray tomography. Both sides of the fracture were investigated in detail, as marked by the green and red boxes (dotted lines). In the green region (a size of Ø 6.4 mm × 5 mm), the fracture was polished and used for OM observation. A total of 20 indentations along the radial direction were performed and four radial directions namely HV-1, HV-2, HV-3 and HV-4 were selected (see Fig. 1(d)). CT scans for crack surface were processed in the red region with a size of Ø 6.4 mm × 7 mm, based on which the 3-D fracture morphology was reconstructed and studied. Specimen of Ø 1 mm × 3.2 mm under crack surface (red region) along the radius direction was used for synchrotron X-ray tomography, based on which the volume fraction of porosity and different phases were determined using a software namely Avizo® [20].
Fig. 1(e) shows the chemical composition of the hypereutectic Al-Si alloys. More Si (20.01%) exhibited in alloy S while more Cu (4.2%) exhibited in alloy A. Tensile tests were performed on a WDW electronic universal tester with a loading rate of 2 mm/min. The metallographic samples were ground on SiC papers (#400, #800, #1200, #1500 and #2000) and polished with ethyl alcohol based colloidal silica suspension (1 μm). Vickers hardness tests were performed with a load of one kilogram force and pressure holding time of 30 s A high-resolution laboratory Nanotom CT manufactured by GE was used to scan and reconstruct the fracture morphology. The voltage and electric current were set to be 110 kV and 100 μA, respectively. Detailed information about data processing could be found in ref. [21]. Synchrotron X-ray tomography experiments were performed at Shanghai Synchrotron Radiation Facility to confirm the spatial distribution and volume fraction of porosity and different microstructures. Detailed operation conditions and data processing techniques used in this experiment were similar to those in ref. [22].
Fig. 2(a-c) shows the optical micrographs of the cross-section of the fracture after grinding. It is clear that PSPs and pores were present in HPDC hypereutectic Al-Si alloys. Fig. 2(d-f) shows extracted along radial direction of alloys A, X and S, respectively. It is shown that the density of PSPs and pores was higher in center. As for porosity, the volume fraction of porosity in alloy A was the largest while smallest in alloy X. According to Fig. 3(a-c), a small size of eutectic Si and intermetallic Cu-rich phases was also present in HPDC hypereutectic Al-Si-Cu alloys. Compared with coarse primary Si (~ 25 μm), the eutectic Si was much smaller in size (~ 1 μm) and less irregular in shape. The network Cu-rich phases distributed along the boundaries of Al dendrites [21].
Fig. 2. Optical micrographs of the cross section of the rods of HPDC Al-Si alloys (a) A, (b) X, (c) S. (d)-(f) show optical micrographs of alloys A, X and S along the radial direction, respectively.
Fig. 3. SEM observation of the microstructure of alloys (a) A, (b) X and (c) S.
Fig. 4 shows Vickers hardness along the radial direction (from surface to center) of alloys A, X and S. In Fig. 1(d), curves of different colors represented the Vickers hardness along different radius directions. The black curve represented the average Vickers hardness of different radius directions. From surface to center, the variation of the Vickers hardness was large, indicating microstructure heterogeneity existed in HPDC hypereutectic Al-Si alloys. Solute segregation under non-equilibrium solidification caused the microstructure heterogeneity. As shown in Fig. 4, the average Vickers hardness at surface (0-320 μm) and in center (3000-3200 μm) was lower than that in-between because PSPs were rarely distributed in surface and higher porosity was present in center. However, Vickers hardness did not decrease in center of alloy X because of low porosity. In addition, the average hardness of alloys A and S (~ 150 HV) was higher than that of alloy X (~ 130 HV).
Fig. 4. Vickers hardness along the radial direction from surface to center. From top to bottom correspond to alloys (a) A, (b) X and (c) S, respectively.
Fig. 1(e) shows the stress-strain curve of alloys A, X and S. It is clear that alloy A had the highest tensile stress while alloy S had the lowest elongation. More primary Si could significantly decrease both strength and plasticity. Improving Cu content could significantly increase strength. According to Wu et al. [23], primary Si particles with poor deformability would decrease the strength and elongation in Al-Si alloy. Ghost et al. [24] confirmed supersaturated solid solution, θ’’(CuAl3), θ’(CuAl2) and θ(CuAl2) were all present in Al-Cu alloy and exhibiting an apparent effect on strengthening.
Fig. 5 shows the fracture morphology and contour map of the undulation height of the fracture surface for the three alloys. As shown in Fig. 5(a-c), the undulation height of the fracture surface was about 978 μm, 982 μm and 1002 μm, respectively. Comparing with the ductile hypoeutectic Al-Si alloys, the brittle fracture of the hypereutectic Al-Si alloys induced much less crack surface fluctuation and no necking at the fracture surface. In Fig. 5, the half of total crack fluctuation is defined as baseline for determining the fracture level. According to the level of crack fluctuation, the 3-D fracture surface was classified into ridge (red), basin (blue) and plain (green) areas. From Fig. 5, large crack fluctuation existed at edge. Approaching center, cracks were relatively flat. Besides, the number and area of ridge and basin of alloy S were larger than those of alloys A and X. Furthermore, only one ridge and one basin were present in alloys A and X while four ridges and one basin exhibited in alloy S.
Fig. 5. Fracture morphology and contour map of the undulation height of the fracture surface for alloys (a) A, (b) X and (c) S. Green region is used as baseline.
Fig. 6 shows the distribution and volume percent for pores, PSPs and Cu-rich phases along the radial direction (from surface to center). The actual sampling location was shown with black dotted line frames in Fig. 5 as buried under fracture surface. A sample of 650 μm × 650 μm × 3200 μm (Fig. 1(b)) was restructured to characterize the distribution and determine the volume fraction along the length direction. For the three alloys, as shown in Fig. 6, the volume percent of pores, PSPs and Cu-rich phases all increased from surface to center. Free-pores regions were formed in the casting surface. The fast heat transfer from melt to mold led to massive nucleation of aluminum grains and this was effective for micro feeding and further hindered the formation of pores. Approaching to center, low cooling rates led to form large aluminum dendrites, making it hard to feed dendritic gap. Therefore, rich-pores region was formed in center. Simultaneously, Cu-rich phases with a low melting point was expelled to center and last solidified. From Fig. 6, the changing trend of Cu-rich phases along the radius direction was in accordance with porosity. Similar with Cu-rich phases, Si was also expelled and aggregated which led to the formation of the PSPs-rich regions. For alloy A, the volume percent of pores increased to 2.8% from surface to center. Before 1120 μm, porosity remained at a very low level while it increased abruptly to about 1.5% in 1280 μm. After 1280 μm, the porosity gradually decreased and local minimum value (0.5%) could be found near 1900 μm. The volume percent of Cu-rich phases remained 3% at first and increased abruptly to 10.5% in 1280 μm. After experiencing a local minimum value (8.8%), the volume percent of Cu-rich phase reached 13% ultimately. For alloy X, the volume percent of pores (3%) and Cu-rich phase (7%) reached maximum value around 2700 μm and then decrease abruptly approaching to center. For alloy S, the volume percent of PSPs increased from 0.5% to 10.5% from surface to center and there existed a local PSPs-rich region near 800 μm and 2240 μm. Similarly, porosity (3.2%) and Cu-rich phases (5.8%) was enriched in center.
Fig. 6. Distribution and volume percent for the pores, PSPs and Cu-rich phases of alloys (a) A, (b) X and (c) S along the radial direction (from surface to center) buried under fracture surface.
Microstructural heterogeneity determine the changes of crack propagation and affect crack morphology. It is common that pores served as defects in die cast structure and decreased the mechanical property. Zuo et al. [25] found that the improvement in porosity increased the degree of maximum stress (σmax). It could be express by Eq. (1):
σmax=
where K is the stress concentration factor of the porosity, which is related to the size and shape of pores; F is tensile force; A0 is cross section area of tensile specimen; f is the volume fraction of pores. When σmax exceeded the bonding strength of local region, huge stress intensity caused crack initiation and growth, promoting the failure of casting. In addition, by numerical flow simulation Flow-3D analysis software, Zhang et al. [26] discovered that the flow shear stress induced the migration of ESCs to center forming solid and liquid mixture region and this was conducive to the formation of pores.
According to ref. [12], small size pores (5-10 μm) with worse roundness were easy to cause stress concentration leading to microcrack initiation. The formation of pores was related to feeding failure of metal liquid in the boundary between dendrites. Because of a relatively lower cooling rate in center, dendrites became larger and formed enclosed space preventing liquid feeding. Therefore, pores were usually distributed along dendritic boundary with a shape of island or network in center.
Beneath the crack surface, the volume percent of Cu-rich phases changed in a similar tendency as that of pores (Fig. 6(d) and (f)). It is found that the mass fraction of Cu increased to 4.2% and caused a dramatic improvement in porosity (13%). It was recorded that Cu-rich phases accelerated the formation of pores by changing dendrites growth [27], [28], [29], [30]. To quantify the critical velocity for the growth of dendrite, Vtr was calculated according to the following relationships:
GL≥
Vtr=
where GL is temperature gradient, TL is the liquid temperature, GL is solute diffusivity, k0 is the partition coefficient of the solute, and ΔT0 is supercooling. The enriched Cu element increased local GL in the liquid. When Eq. (2) was approached, the unstable interface protruded into the liquid phase forming fine dendrite arms. Meanwhile, Vtr was improved and the growth of fine dendrite arms was accelerated. This was easy to form a closed gap and prevent metal liquid invaded. Fig. 7(a) shows that pores were surrounded by Cu-rich phases. From Fig. 7(c), 6.2% Cu was detected in Cu-rich phase regions. Meanwhile, coarse dendrites in Fig. 7(a) were buried under pores and they decided the formation of the pore. In Fig. 7(b), Cu-rich phase region was enlarged. It is shown that fractured Cu-rich phases distributed along the boundary of Al dendrites. According to Fig. 7(d) and (e), Cu distributed between α-Al and Si. By TEM, Sunde et al. [31] observed Cu was expelled from the solid solution and distributed along a hexagonal Si network, forming Cu-containing Q’-phase (Al6Mg6Si7Cu2). Cu accumulating at interface served as weak region because of the nature brittle property.
Fig. 7. SEM observation of (a) microstructure near pores and (b) enlarged Cu-rich phase region and corresponding EDS result in (c) and (d).
However, it was noted in Fig. 6(d)-(f) that a local minimum of porosity existed in the region between 1600 μm and 2240 μm for alloy A. The same behavior occurred in the region between 2240 μm and 2560 μm for alloys X and S. During solidification, huge crystalline latent heat was released, i.e., ~1808 kJ kg-1 [32] because of the precipitation of primary Si from liquid, which was much higher than that for the growth of Al dendrites (397 kJ·kg-1) [33]. Al dendrites remelted and the porosity annihilated.
As for high cycle fatigue fracture of hypereutectic Al-Si alloys, crack originated from pores and had a flat crack propagation area with the height less than 50 μm [21,34]. Instead, the tensile fracture was more tortuous. Affected by high applied stress in tensile tests, main crack originated from surface and microcracks initiated around high stress intensity region like pores or brittle phases. Stress intensity factor at crack tip (K) was used to measure fracture performance. It can be expressed by Eq. (4):
K=f$(\frac{a}{W})σ\sqrt {πa}$ (4)
where f is the shape correction factor, which is related to crack size (a) and the dimension of component (W). Crack tip in Fig. 7 with high f endured high stress intensity and owned low crack propagation resistance. In the direction perpendicular to the crack width, island or network pores were highly susceptible to stress and easy to expand. Microcracks formed along the tip of pores and crack length continued to increase. Meanwhile, the island or network pores was distributed along dendritic boundary. When applied stress exceeded the bonding strength between dendrite arms, intergranular fracture would occur. Besides, the intermetallic Cu-rich phases around the pores tended to rupture and served as new initiation sites for crack further extension. Gao et al. [35] proved that the density of the Al2Cu in the intergranular fracture regions was much higher than that in the transgranular regions. In Fig. 6(d) and (f), a local maximum value of porosity and Cu-rich phases in alloy A between 1280 to 1600 μm was present. Accordingly, this area could suffer from intense stress and become the weak position in tensile tests.
In tensile tests, the microcracks tended to firstly initiate around PSPs, which could be attributed to the dislocation pileup theory [17]. When dislocations encountered with obstacle like precipitates or grain boundaries, the motion of dislocations could be terminated. The generation of new and active dislocations interacted with deactivated dislocations causing stress concentration in two phase interface. To further to calculate the distribution of dislocation around phase interface, the position of dislocation (xj) can be expressed by the following relationship:
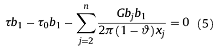
τ0=nτ (6)
where τ and τ0 are external stress and reaction force of obstacles; b1 and bj are Burgers vector of leading dislocation and dislocation numbered j; ϑ is Poisson ratio; n represented the number of dislocation. Calculation results show that dislocation was uneven distribution. The closer around the obstacle, the denser the dislocation was. Besides, increasing n value would improve reaction force of obstacles and local stress concentration occurred. Accordingly, microcracks were formed in phase interface.
Microcracks formed in phase interface and increased with improving applied stress. Because of the poor deformation coordination ability of silicon, PSPs always ruptured or was bypassed. According to our previous work [21], the crack tended to propagate along the edge or surface of PSPs, e.g. {111} planes under high cycle fatigue while not through primary silicon. The crack surface was flat and had not tortuous propagation route. However, under low cycle fatigue with high stress intensity, the crack front tip was powerful enough to break PSPs. The fluctuated fracture surface was formed and the area of the instantaneous crack area was greatly improved. Fracture of tensile specimen was similar with that of low cycle fatigue. That could be proved that the fracture morphology was related to the magnitude of the applied load. When applied stress was at a higher level near tensile strength of material, the fracture morphology was tortuous. But if the specimen endured a lower level intensity far away from tensile strength of material, flat crack propagation route was apparent in fracture surface.
Fig. 8 shows the diagram of the equivalent diameter of PSPs versus relative distance away from surface, as well as the local fracture surface corresponding to the region marked by black arrow in Fig. 5. In this experiment, PSPs larger than 50 μm were actually the so-called ESCs which formed in the shot sleeve while other small size of PSPs formed later in the cavity during solidification [36]. From Fig. 8(a-c), it is found that small size of PSPs distributed evenly along the radius direction while coarse PSPs segregated in specific locations. For alloy A and alloy X, the largest PSPs (~ 90 μm) exhibited at 1600 μm away from the surface. However, the largest PSPs (~ 105 μm) for alloy S exhibited in the center and a local maximum value (~ 80 μm) exhibited at 1000 μm away from the surface. From Fig. 5, in the region of a large size of PSPs gathering (marked by black arrow), the color changed obviously. In other words, large surface fluctuation occurred. The corresponding crack surface was shown in Fig. 8(d-f). It can be seen that PSPs with large size distributed in both sides of the crack surface fluctuation zone and it indicated that hard PSPs changed the direction of main crack propagation. Simultaneously, it is found that PSPs ruptured rather than debonded from Al matrix indicating crack transgranular growth instead of intergranular growth. The result was in accord with that of low cycle fatigue. To further prove the transgranular fracture of PSPs, PSPs in center of alloy A, alloy B and alloy C were extracted from fracture. It is shown in Fig. 9 that the surface of PSPs existed many deep rifts. Those rifts almost passed through the whole length of PSPs and predicted the huge stress effect during the instant crack process.
Fig. 8. Thermodynamic diagram of the equivalent diameter of PSPs along relative distance away from surface and crack surface fluctuation (corresponding to the arrow in black dotted line frame in
Fig. 9. SEM observation of ruptured PSPs in center of alloys (a) A, (b) X and (c) S.
Stress intensity caused cracks initiation and propagation. Therefore, it is necessary to estimate stress intensity factor at main crack tip. The arrow in Fig. 5 indicated the location where large size of PSPs enriched in. Assuming crack extension to this position, instantaneous break occurred. The crack length (a) was 1600 μm, 1600 μm and 1000 μm for alloys A, X and S, respectively. The stress intensity factor KI was calculated to quantify stress intensity:
KI=Yσ
The geometry factor Y was:
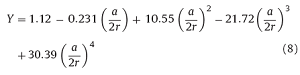
The geometry factor and the stress intensity factors of the different hypereutectic Al-Si alloys were listed in Table 1. It is clear that alloy S with high Si content had the minimum Y and KI. In other words, instantaneous break of alloy S occurred under lower stress intensity indicating the ability to resist crack propagation alloy S was relatively weak.
Table 1 Geometry factor and stress intensity factor of the hypereutectic Al-Si alloys.
| Alloy | Tensile strength (σ) | Geometry factor (Y) | Stress intensity factors (KI) |
|---|---|---|---|
| A | 320 MPa | 1.50 | 34.02 MPa·$sqrt{m}$ |
| X | 300 MPa | 1.50 | 31.89 MPa·$sqrt{m}$ |
| S | 300 MPa | 1.28 | 21.51 MPa·$sqrt{m}$ |
In tensile tests, main crack originated from the surface and further expanded with the improvement of applied stress. Affected by geometric factor of pores, the edge zone of network or island pores induced large stress intensity promoting microcracks initiation. In Fig. 7(a), crack tip located on grain boundary and it would expand along grain boundary direction. When crack tip touched with eutectic silicon or Cu-rich phases, the brittle phases would rupture. Gao et al. [35] found that the main crack expanded along the region of gathered pores, and rupture intermetallic particles existed in crack surface. By in-situ tensile tests, Li et al. [12] discovered that microcracks originated from pore and further extended along dendritic boundaries and brittle intermetallic island or network β phases. According to dislocation pileup effect, large stress intensity in the frontier of PSPs caused microcracks. However, PSPs inhibited the microcracks further propagation. When the stress in the frontier of PSPs exceeded the bonding strength of primary Si, PSPs would rupture. By in-situ bending tests, Yu et al. [15] found that primary Si particles were firstly broken into pieces perpendicular to (101) and (001) lattice planes before main crack passed through it. Meanwhile, microcracks around pores and PSPs provided shortcut for main crack propagation. They tended to converged on the main crack to decrease the energy required for crack propagation. Increasing Cu and Si in hypereutectic Al-Si alloy would increase the number of microcracks source and promote the failure of casting.
In this work, the fracture mechanism of HPDC hypereutectic Al-Si alloys was investigated with focus on the influence of microstructure. Based on the experimental data, the following conclusions can be drawn:
(1) The microstructure of the HPDC hypereutectic Al-Si alloys was mainly comprised of PSPs, Al dendrites, Cu-rich phases and pores. Due to rapid solidification of HPDC, microstructure heterogeneity was present in hypereutectic Al-Si alloys. In addition, Cu-rich phases affected the growth of Al dendrite arms and promoted the formation of pores.
(2) Under high applied stress, microcracks tended to be originated around pores with worse roundness and further expanded along Cu-rich phases causing intergranular fracture. PSPs served as obstacles leading to dislocation piled up in phase interface. When the stress intensity around crack tip exceeded the bonding strength of Si, PSPs would rupture and form transgranular fracture. Meanwhile, affected by the hindrance of hard PSPs, large crack surface fluctuation was formed near the rupture PSPs regions.
The authors thank the National Natural Science Foundation of China (Grant No. 51775297), the National Science and the Tsinghua University Initiative Scientific Research Program (No. 20151080370) and UK Royal Academy of Engineering/Royal Society through the Newton International Fellowship Scheme for financial support. The authors also appreciate the help provided by Shanghai Synchrotron Radiation Facility and their provision of beam time.
The authors have declared that no competing interests exist.

 WeChat
/
| 〈 |
|
〉 |


