Search for articles:
D.J. Yu , H. Wang
Corresponding authors:
Received: 2018-07-18
Revised: 2018-08-10
Accepted: 2018-08-12
Online: 2019-06-20
Copyright: 2019 Editorial board of Journal of Materials Science & Technology Copyright reserved, Editorial board of Journal of Materials Science & Technology
More
Abstract
Thermo-mechanical coupled finite element calculations were carried out to simulate the Gleeble compression of the samples of a titanium alloy (Ti60), and the results are analyzed and compared with the actual compression tests conducted on a Gleeble 3800 thermo-mechanical simulator. The changes in temperature, stress and strain distribution in the samples and the source of error on the constitutive relations from Gleeble hot compression test were analyzed in detail. Both simulations and experiments showed that the temperature distribution in the specimen is not uniform during hot compression, resulting in significant deformation inhomogeneity and non-ignorable error in the flow stress strain relation, invalidating the uniform strain assumption commonly assumed when extracting the constitutive relation from Gleeble tests. Based on the finite element simulations with iterative corrections, we propose a scheme to refine the constitutive relations from Gleeble tests.
Keywords:
Accurate flow stress strain relation of materials is vitally important in developing mathematical models for deformation behavior simulation and analysis, as well as in establishing thermal-mechanical treatment route. Hot compression tests on Gleeble thermo-mechanical simulating machines are presently a popular method to obtain the constitutive relationship for metallic materials [1], [2], [3], [4], [5], [6], [7], [8], [9]. In order to get the stress-strain relation from Gleeble test, it is usually assumed that the distribution of temperature and strain in the Gleeble sample are uniform during measurement. However, despite the vast efforts to improve the Gleeble test rig design and operation procedure, the temperature distribution in Gleeble sample in most compression test, especially at high temperature, is often far from uniform [10,11], due to the radiation from the surface and conductive heat loss from the end of the sample. These result in severe deformation inhomogeneity and errors arise inevitably in the stress-strain relations obtained. In order to reduce such deformation non-uniformity, a number of studies have been carried out to clarify the effects of friction and plastic deformation heat [12], [13], [14], [15]. But no report is found on the effects of temperature inhomogeneity in the sample and their effects on the constitutive relation.
Because of the heat loss into the anvils at the end contacts and radiation into space from the sample surface, complicated non-uniform temperature distribution arises, which is impossible to estimate analytically. In the present work, finite element method (FEM) is employed to study the deformation process during Gleeble compression tests. The temperature and strain distribution evolution is analyzed in detail, and comparison is made carefully between the simulated and measured stress strain relations, exemplified with a newly developed high temperature titanium alloy, Ti60 (Ti-5.8Al-4Sn-3.5Zr-0.41Mo-0.4Nb-1Ta-0.4Si-0.06C, wt%) [16,17]. A correction scheme is proposed to obtain more accurate constitutive relations from Gleeble results.
Thermo-mechanical coupled calculations by active finite element method were carried out to simulate high temperature Gleeble compression. Due to the rotational symmetry of the system, the simulation was simplified into two-dimensional. The details of the heat conduction inside each piece of graphite paper were neglected, and their effect was accounted by selecting an appropriate heat exchange coefficient. Heat conduction, radiation, deformation heating, frictional heating were included in the simulations. The compression heads providing electric power and stress was water cooled, and therefore regarded as constant temperature rigid body. The blackness coefficient of metal surface is mainly determined by the surface state; the heat transfer coefficient between sample and the air is mainly related to air pressure; the interfacial heat transfer coefficient, either between sample and the coat or between sample and anvils, is mainly determined by contact pressure; while the dependence of all these parameters on the sample material itself is relatively weak. According to the authors' experience, some materials insensitive parameters used in previous studies can be employed here to simulate Ti60 [20], [21], [22], [23]. These parameters for the present FEM simulation are listed in Table 1.
Table 1 Heat exchange related parameters employed in the FEM simulation.
| Blackness coefficient of sample & anvils | Heat transfer coefficient between sample and air (W/m2K) | Interfacial heat transfer coefficient between sample and insulating coat (W/m2K) | Interfacial heat transfer coefficient between sample and anvils (kW/m2K) |
|---|---|---|---|
| 0.75 | 0.002 | 0.02 | 6 |
The material used to validate the simulations is Ti60, a newly developed high temperature titanium alloy working up to 600 °C [16,17]. The measured β transus of this alloy is 1040 °C. The alloy bars were β annealing at 1060 °C for 15 min followed by furnace cooling. By this means a colony microstructure was obtained. Cylindrical specimen of 12 mm high and 8 mm in diameter were machined for Gleeble annealing. The Ti60 samples were compressed at different temperatures and strain rates on a Gleeble 3800 thermo-mechanical simulator. Two WC strengthened alloy anvils with dimensions of Φ19 mm × 19 mm and Φ19 mm × 6 mm are used at each end of the sample, and graphite paper and tantalum foils were used between each contact to prevent chemical reaction, reduce friction and heat loss from both ends of the sample. The anvils are treated as rigid body during deformation due to their high strength and stiffness. Heating and temperature control of the sample are achieved by controlling the electric current passing through the specimen and anvils.
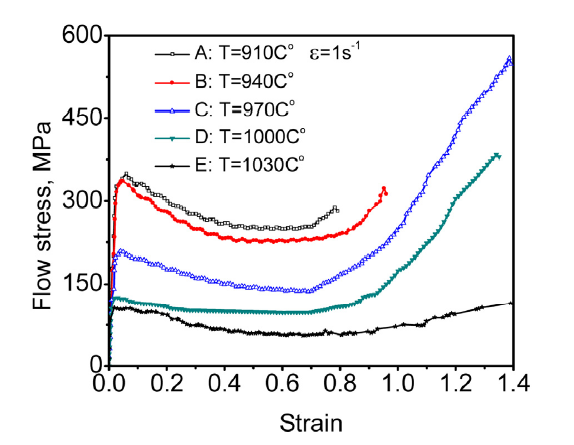
Fig. 1 shows the stress strain curves of the Ti60 alloy from Gleeble 3800 compression at various temperatures under strain rate of 1 s-1. Fig. 2 shows the simulated temperature distribution on a quarter of the longitudinal section, and experimental microstructures observed at the corresponding position in the sample, after Gleeble annealing at 1000 °C for 10 min and then air cooled to room temperature. As shown in Fig. 2(a), the temperature is not uniform, span more than 200 °C across the sample. In order to estimate the temperature at which the various microstructures was formed, the volume fraction of the different phases in the Ti60 alloys was calculated, using Pandat [18], see Fig. 3. According to the calculated diagram, the primary α lamellar volume fraction decreases as the actual temperature in the Gleeble sample increases. The microstructure at the end of the specimens contain little β phase, therefore the temperature there should be very low in the α+β phase field, at a temperature lower than 900 °C. The temperature at the center is higher than that at the edge because of the primary α lamellar content at the center of the specimens is much lower than that at the edge, with α fraction of only a few percent, corresponding to an equilibrium state at 1020 °C or higher, well above the temperature setting of 1000 °C for Gleeble annealing. The experimental phase fraction results in general were in good agreement with the simulated temperature distribution. From the above simulation and test, it was shown that both FEM simulations and Gleeble experiments confirm that temperature distribution deviates significantly from uniform. Simulation on different material show that the smaller the thermal conductivity and heat capacity, the larger the temperature deviation from uniform. Since the flow stress of metals and alloys depend strongly on temperature, from the above FEM simulations, the non-uniform temperature distribution cause inhomogeneous deformation in Gleeble sample, therefore induce errors in the constitutive relation. A comparison between the simulation and experiments for the final sample shape, microstructure, temperature and stress distribution is made in Fig. 4. It was shown that the FEM simulated shape agrees well with the Gleeble tests, with a typical lantern shape obtained in both cases. These confirm that the simulation parameters we choose are appropriate. Further analysis and comparison of FEM results from simulation with different friction coefficients of 0 to 0.5 show that, temperature non-uniformity is the main cause of error instead of friction between sample and anvils.
Fig. 1. The stress strain curves of Ti60 under compression at different temperatures under strain rate of 1 s-1.
Fig. 2. Simulated temperature distribution (a) and experimental microstructure at the corresponding positions in (a) after Gleeble annealing at 1000°C for 10 min (b, c, d). Only one quarter of the cross section is shown in (a) to save space.
Fig. 3. Volume fractions of different phases in Ti60 as a function of temperature, obtained from thermodynamic calculation using Pandat [
Fig. 4. Comparison of the distribution of (a) microstructure, (b) temperature (in °C), (c) shear and (d) normal strain in the compressed Gleeble sample. The compression is done at 1000°C under strain rate of 1s-1, and to nominal strain of 0.5. Only one quarter of the cross section is shown to save some space.
Stress and strain distribution calculation during the FEM analysis of the compression process show that, in the beginning, the strain in the sample is mainly normal, as deformation proceeds, shear strain increases gradually, with maximal influence at the nominal strain of 0.5 to 1.0. Such influence reduced when nominal strain is larger than 1.5, as the bow out part of the sample contact with anvils. According to Fig. 4, the temperature and strain distribution in the sample are far from uniform, with the maximal strain more than twice the nominal strain, while the minimal strain close to 0. Therefore, the actual deformation occurred as coordinated deformation of various regions with different temperatures, strains and strain rates, and the measured flow stress is the average of the stress of various parts with different temperatures, strains and strain rates. It can be observed that in the last stage of compressive deformation, the temperature at the center of sample tends to drop, together with the average temperature of the whole sample (compare Fig. 2(a) and Fig. 4(b)). Analysis show that, as compression proceeds, the sample shortens, and more heat loss into anvils made the temperature drop in the central region. Moreover, the two cold ends of the sample are pushed into the center, resulting in more significant temperature drop therein. At the nominal strain of 2, such temperature drop can be close to 100 °C.
Concerning the measured flow stress, at the beginning, temperature non-uniformity leads to a yield stress lower than the real value, due to the yielding at the sample center with higher temperature than the surface where the sample temperature was measured, using a tiny thermal couple weld on the surface. In contrast, when deformation proceeds to certain stage, the temperature at the center may not be higher than the nominal value, the average temperature maybe lower than that and tends to drop. This results in the restriction of deformation around the center, and therefore a higher stress is obtained.
In order to reduce the error in stress-strain relation caused by the above non-uniform temperature distribution, the following scheme for obtaining more accurate constitutive relation is proposed: 1) Flow stress data were first measured by Gleeble tests, and used as input for FEM simulation of the Gleeble compression process. A set of simulated flow stress curves are obtained from FEM simulation; 2) Compare the simulated curves with the Gleeble measured ones, corrections are made according to the difference between the two; 3) The corrected data are used as input and make further FEM simulation, new corrections are made according to the difference between the new simulation results with the Gleeble measured ones; 4) Repeat the above process 2 to 3, until the difference between the two iteration is smaller than a certain criterion. The last corrected relations obtained are considered as the true flow stress strain relations of the material. The final relations obtained should be independent on the initial input, and by going through step 1 to 4 repeatedly, a unique set of true stress-strain curves can be obtained.
Fig. 5 shows the true stress strain curves of Ti60 at 1000 °C under strain rate of 1 s-1. Curve A is that from Gleeble compression (Curve D in Fig. 1), and B is from FEM simulation with curve A as input. It can be observed that large deviation exists between the two, thus the experimental curve does not reflect the real property of the material. When strain is larger than 1, the error is too large that the curve becomes non interpretive.
Fig. 5. The stress strain curves of Ti60 under compression at 1000°C and strain rate of 1 s-1. Curve A is the direct Gleeble result, and B from FEM simulation with curve A as input. The Curve C is the corrected and D is the second FEM result with curve C as input.
In the starting constitutive model, the influence of deformation temperature, strain and strain rate on flow stress can be described by σ = A${\dot{ε}}^{m}$εn$(\frac{Q}{RT})$exp [19], where σ is stress, $\dot{ε}$ strain rate, ε strain. In fact, the Gleeble measured flow stress is an average over various zones in the sample which may deform under different temperature, strain and strain rate. The main reason for the deviation of stress from that measured is the non-uniform strain (Fig. 4(d)) caused by the non-uniform temperature distribution (Fig. 4(b)). Considering the consistency of deformation mechanism, we try our best to maintain the original formula and focus on the modification of the hardening index, etc. When strain is very small, the stress in the sample should actually be elastic, with magnitude proportional to strain. A simple correction will not affect the converged result of the iterative FEM simulation, however, with more fitting parameters, faster convergence can be achieved with fewer FEM iteration, and computer simulation time can be reduced.
In order to obtain the true constitutive relation for the material studied, we propose a correction scheme for the flow stress of the sample materials as:
σtrue=A $\dot{ε}$ m(B+εn+Cεo+Dεp)exp$\frac{Q}{RT}$σtest+E $\dot{ε}$ m exp$\frac{Q}{RT}$, (1)
where Q is the deviation of activation energy, m the modified strain rate sensitivity index, A the modified structure factor, and n, o, p the modified hardening indexes. In the above equation, σtrue and σtest are the corrected flow stress and raw Gleeble test results. The parameters in the above equations are obtained by fitting all the experimental and simulation results, as shown in Table 2. The curve C in Fig. 5 shows the corrected flow stress, which can be considered as true flow stress of the material under first-order approximation. Curve D is the flow stress from FEM-simulation, with corrected flow stress (curve C) as input. It is seen that, for strain in the range of 0 to 1, the new FEM simulation (curve D) agrees well with the raw Gleeble result (curve A), demonstrating the good quality of the correction. These results, on the other hand, confirm again that the simulation parameters chosen are appropriate. When strain is smaller than 0.01, the stress change very fast with strain linearly within the elastic range, and since the Gleeble result contains contribution from the whole sample deformed to various strains, one-time correction may not capture all the details. Similarly, at high strain, the temperature of the sample is mostly below the target temperature, and one-time correction may also be insufficient. However, in both cases, satisfactory convergence is expected to be obtained by iterative corrections, due to the negative feedback nature of the correction scheme.
Table 2 Parameters obtained in the constitutive relation after one-time correction. Q is the corrected deformation activation energy, m the modified strain rate sensitivity index, and n, o, p are modified hardening indexes, A is the modified structure factor. B, C, D and E are fitting parameters in Eq. (1).
| Strain | A | m | Q | n | o | p | B | C | D | E |
|---|---|---|---|---|---|---|---|---|---|---|
| 0-0.01 | 0 | 0.04 | -12437 | 0 | 0 | 0 | 0 | 0 | 0 | 26.765.6 |
| 0.01-0.04 | -0.0744384 | 0.04 | -12,437 | -1.267 | -0.534 | -3.434 | 62.81 | -28.2 | -0 | -0.0736 |
| 0.04-1.00 | 1.41026 | 0.04 | -12437 | 7.0457 | 2.681 | 2.6241 | 1.924 | -66 | 64.8 | 0 |
| 1.00-1.40 | -7.36E-02 | 0.04 | -12437 | -59.93 | -2.099 | -59.55 | -0.092 | -0 | -1 | 0 |
The Gleeble hot compression process of Ti alloy samples are simulated using FEM. It was shown that for high temperature Gleeble compression, the temperature is far from the assumed uniform distribution, especially for the specimen with low thermal conductivity and heat capacity, resulting in inhomogeneous deformation. Analysis show that such inhomogeneity is mainly caused by heat loss into the compression anvils and radiation from the surface of samples, and lead to a significant error in measured constitutive relations. A correction scheme is proposed to obtain more accurate stress strain relations for Ti60 alloy from Gleeble measurement, with the help of FEM simulations. The scheme is expected to be applicable to other alloy as well.
The support of the National Key Research and Development Program of China (2016YFB0701300, 2011CB606404), the CAS informatization Program (XXH13506-304) and the National Natural Science Foundation of China (51171195, 50911130367) are gratefully acknowledged. Simulations were performed at the CAS Shenyang Supercomputing Center.
The authors have declared that no competing interests exist.

 WeChat
/
| 〈 |
|
〉 |


