Search for articles:
Liwei Zhong , Zhaohui Feng
Corresponding authors:
Received: 2018-10-22
Revised: 2019-04-30
Accepted: 2019-05-26
Online: 2019-10-05
Copyright: 2019 Editorial board of Journal of Materials Science & Technology Copyright reserved, Editorial board of Journal of Materials Science & Technology
More
Abstract
Uniaxial compression tests were carried out on an Al-Cu-Li alloy at a temperature range of 300-500°C and a strain rate range of 0.001-10 s-1. Four representative instability maps based on Gegel, Alexander-Malas (A-M), Kumar-Prasad (K-P) and Murty-Rao (M-R) criteria were constructed. Through formula deduction and microstructural observation, it can be concluded that M-R criterion is more accurate than K-P criterion, and the first two criteria are better than Gegel and A-M criteria. From a power dissipation map and a M-R instability map, the optimized processing parameters are 480-500°C/0.001-0.1 s-1 and 420-480°C/0.1-1 s-1. The corresponding microstructural analysis shows that dynamic recovery and partial dynamic recrystallization are main dynamic softening mechanisms. Transmission electron microscopy observation indicated that a large number of primary coarse T1 (Al2CuLi) particles precipitated in the homogenized specimen. After deformation at 500°C, most of the primary T1 particles dissolved back into the matrix, and secondary fine T1 particles precipitated at deformation-induced dislocations, high angle grain boundaries and other dispersed particles.
Keywords:
In aluminum (Al) alloys, each unit addition of lithium (Li) reduces density by about 3% and improve elastic modulus by about 6%, up to the maximum solid solubility of Li in Al [1]. Meanwhile addition of Li makes improvements in specific stiffness (elastic modulus/density) and strength (strength/density) of Al-Li alloys. As the third-generation Al-Li alloys, Al-Cu-Li alloys possess a lower density (2%-8%), higher specific strength (8%-15%) and higher modulus (15%-25%) that those of conventional AA 2XXX and 7XXX series aerospace Al alloys, respectively [2]. Moreover, Al-Cu-Li alloys have good damage tolerance, superior fatigue and corrosion resistance [3,4]. These advantages enable Al-Cu-Li alloys to be mainstream structural materials in aerospace industry, such as in fuselage and wings of aircrafts and cryogenic propellant tanks of spacecrafts [5]. However, previous research was mainly focused on the effects of alloy composition and heat treatment on microstructural evolution and mechanical properties of Al-Cu-Li alloys [6], [7], [8]. Scarce attention has been paid on the processing maps based on different instability criteria and evolution of precipitates during hot deformation of this kind of alloys, especially of Al-Cu-Li X2A66 alloy.
The processing parameters, such as deformation temperature (T), strain rate (ε˙) and strain (ε), have an important influence on the microstructure and properties of XXX alloys [9,10]. He et al. [11] pointed out that the volume fraction of coarse particles in Al-Cu alloy 2219 decreased with an increase in deformation temperature, which was beneficial to the improvement in mechanical properties. Wang et al. [12] studied the effects of cumulative strain on the microstructure and mechanical properties of Al alloy 2A14 and found that the mechanical properties of the alloy were optimal when the cumulative strain was 3.6. Therefore, it is necessary to identify and optimize the range of hot working parameters to improve quality of industrial alloy products. At the present, processing map is recognized as an effective tool to guide the establishment of hot processing regime. A processing map based on dynamic material model (DMM) [13], [14], [15] can accurately reflect the constitutive relationships between microstructure evolution, hot workability, and flow instabilities of materials under various deformation conditions (T, ε˙, and ε). In recent years, DMM-processing maps have been successfully applied to Al alloys [16], steel [17], titanium alloys [18], magnesium alloys [19], copper alloys [20], etc. According to DMM, a workpiece is generally regarded as a nonlinear power dissipator. The total input power P of a workpiece can be divided into two parts and represented as [15]:
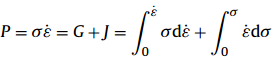
where σ is the flow stress, G expressed by the first integral is the power dissipation content which mostly transforms to heat, and J given by the second integral is the power dissipation co-content related to the physico-metallurgical behaviors.
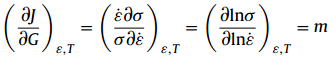
At a certain strain and temperature, the partitioning of P between J and G is identified by the strain rate sensitivity of flow stress m [13]:
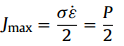
For an ideal linear dissipator, m = 1, and J reaches the maximum value (Jmax), namely:
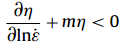
The relationships between the power dissipated by microstructure evolution and the linear dissipation power during hot deformation of material can be expressed by a dimensionless parameter called the efficiency of power dissipation η, which also denotes the dissipation capacity of the workpiece and can be written as [21]:
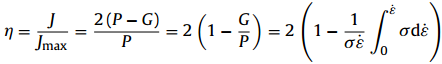
When the strain rate sensitivity m is constant, the power dissipation efficiency η can be calculated by the following equation [15]:

The variation of η with T and $\dot{ε}$ , at a given ε, forms a power dissipation map. The different domains in the map correspond to their specific microstructure evolution mechanisms. In general, the higher the value of η, the better the workability of material is, due to the more power dissipated by the microstructure evolution. Accordingly, the domains with a high value of η in the power dissipation map may correspond to superior processing parameters. However, additional criteria are required to distinguish between safe and unsafe regions in the map because high η value may also relate to unstable region [17,22].
At present, there are two main types of DMM instability criteria. One is based on the Ziegler’s plastic flow theory [23] and the other is derived from the Lyapunov’s functions [24]. According to the theory of Ziegler’s plastic flow, Kumar et al. [25] and Prasad et al. [15] came up with a criterion for predicting the unstable flow domains, as shown below:
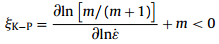
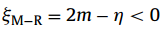
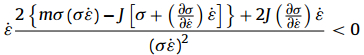
This criterion has been successfully applied to a large number of materials [26]. It is important to note that the premise of this criterion is that m is a constant, and σ- $\dot{ε}$ relationship follows the law of power function (σ=K$\dot{ε}^{m}$). However, Murty et al. [21] pointed out that for pure metals and alloys with simple components, m is a constant, but for complex alloy systems, m is not a constant. Therefore, they proposed another instability criterion suitable for any kind of σ- $\dot{ε}$ relationships:
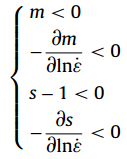
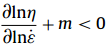
On the basis of Lyapunov’s functions, Gegel et al. [27] suggested a criterion for identifying the stable flow regions in a power dissipation map. Apart from the stable flow regions, the other regions are flow instability domains. Therefore, the corresponding instability criterion can be written as:
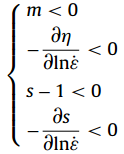
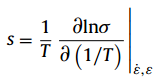
where s is a temperature sensitivity and given by
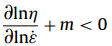
Alexander [28] and Malas [29] believe that m not only represents the distribution of P between G and J, but also satisfies the Lyapunov’s functions, so the η of the second inequality in Gegel criterion can be replaced by m. In the same way, A-M criterion for defining the stable domains can be rewritten as the form of instability criterion:
According to these instability criteria, the instability maps can be constructed. The different flow instability domains in the map may correspond to different flow instability behavior. The typical instability manifestations include flow localization, adiabatic shear band, dynamic strain aging, and wedge cracking [17]. The development of instability criteria plays a key role in the investigation of flow behaviors and the optimization of hot working parameters. However, the study of instability criteria has not yet formed a unified conclusion. Based on the same experimental data, the flow instability regions obtained by using different instability criteria may be different, or even opposite [30]. Therefore, it is necessary to make a detailed and thorough comparative study of the characteristics of instability criteria, and to verify the reliability and accuracy of their predictions. In addition, some advanced analytical techniques such as electron backscatter diffraction (EBSD) and transmission electron microscopy (TEM) have been used to study the microstructure evolution during hot deformation. For example, Basanth et al. [31] have used EBSD to study the characteristics of grain boundary and misorientation distribution of titanium alloy during hot compression. Lin et al. [32] have investigated the changes of δ phase and dynamic recrystallization (DRX) grain, and the interactions between δ phase and DRX grain in a nickel-based superalloy during hot compression using TEM and EBSD. However, there are few public reports about the evolution of grain boundary, misorientation distribution, and precipitates of X2A66 alloy during hot working.
In this work, to investigate the flow behavior of Al-Cu-Li alloy X2A66, the initial true strain and true stress data were obtained by hot compression tests. The instability maps based on different instability criteria were established and discussed in detail. The microstructures were characterized by optical microscopy (OM), EBSD, and TEM. Meanwhile, the relationships between the dynamic softening behavior and second phases were analyzed.
The actual chemical composition of the Al-Cu-Li alloy X2A66 pieces tested with inductively coupled plasma atomic emission spectroscopy (ICP-AES) is shown in Table 1. The semi-continuous casting ingot of X2A66 with a diameter of 450 mm (supplied from Southwest Aluminum (Group) Co., Ltd, China) was homogenized at 410°C for 10 h and 500°C for 36 h. Cylindrical specimens with a height of 15 mm and a diameter of 10 mm were machined from the homogenized ingot, and then both ends of specimens were mechanical ground to obtain smooth planes to reduce the friction during experiments.
Table 1 Chemical composition of the experimental X2A66 alloy (wt%).
| Cu | Li | Mg | Zn | Mn | Zr | Fe | Si | Ti | Al |
|---|---|---|---|---|---|---|---|---|---|
| 3.63 | 1.34 | 0.39 | 0.64 | 0.31 | 0.12 | <0.10 | <0.05 | <0.10 | Bal. |
Hot compressive deformation was performed on a Gleeble-3500 thermo-mechanical simulator. First, thermocouples were welded onto the mid-height of the specimen to make the test run at a preset temperature. Graphite sheets and high temperature grease were used to minimize the interfacial friction between both ends of sample and platens. Before each compression, the sample was heated up to a preset deformation temperature at a rate of 10°C s-1 and held for 180 s to eliminate the temperature gradient. The isothermal compression tests were conducted in the temperature range of 300-500°C with an interval of 40°C and the strain rate range of 0.001-10 s-1 up to a true strain of about 0.7. After compression, the specimens were immediately water-quenched to room temperature to retain the deformed microstructure at high temperature.
The quenched specimens were sectioned symmetrically along the compression axis and a central part of the sectional plane was used for microstructural observations. The samples were observed by OM (Leica DM4000 M) after preparing by standard metallographic techniques and etching in Keller’s reagent composed of 2 ml HF, 3 ml HCl, 5 ml HNO3, and 90 ml H20. The specimens for EBSD were carefully ground by hand, then mechanically polished, and finally electrolytic polished in a solution including 10% HClO4 and 90% C2H5OH at 25 V for 30 s. The EBSD analysis was conducted on a scanning electron microscope (JEOL JSM-7001 F). In the preparation for TEM, the foils were grinded to about 50 μm by hand firstly, then the disks with a diameter of 3 mm were punched, and finally the disks were processed by twin-jet electrothinning in a solution containing 30% HNO3 and 70% methanol at 20 V and -30°C. The electrothinning disks were observed by FEI TECNAI G2 F20 TEM, equipped with a high-angle annular dark field detector (HAADF) for scanning transmission electron microscopy (STEM) imaging.
To minimize the adverse effect of friction and deformation heat during the test, the flow curves of X2A66 alloy at low strain rates of 0.001-0.1 s-1 were corrected for friction, and the curves at high strain rates of 1 and 10 s-1 were corrected for friction and deformation heat, as shown in Fig. 1. It can be seen that the flow stresses rise rapidly in the initial small strain stage. This is because the deformation causes a large number of dislocations to initiate and multiply which results in the work hardening. With the increase of strain, the flow curves can be divided into two categories. At the low strain rates $\dot{ε}$ ≤0.1 s-1, the flow curves first increase to the peak value and then gradually decrease until steady state, which is caused by dynamic softening including dynamic recovery (DRV) and DRX. At the high strain rates $\dot{ε}$ ≥1 s-1, the flow curves have no peak value and transform into a steady flow state directly, reflecting an equilibrium between work hardening and dynamic softening. However, it is pointed out that flow curves may not accurately reflect the dynamic softening characteristics [33,34], and therefore it is necessary to observe the microstructure of hot compression specimens.
Fig. 1. True stress-true strain curves of X2A66 alloy at different temperatures with strain rates of (a) 0.001 s-1, (b) 0.01 s-1, (c) 0.1 s-1, (d) 1 s-1, and (e) 10 s-1.
The peak flow stresses at different hot deformation conditions are shown in Fig. 2. It can be seen that the peak flow stresses decrease with the increase of temperature or the decrease of strain rate. For example, the peak flow stress reaches the maximum value of 184.6 MPa at 300°C and 10 s-1, and reaches the minimum value of 17.4 MPa at 500°C and 0.001 s-1. The thermoplastic deformation process of the alloy is controlled by thermal activation. The higher the temperature, the greater the average kinetic energy and amplitude of atoms. It is beneficial for the movement of vacancies, the climbing of edge dislocations and the cross slip of screw dislocations in the alloy. A large number of dislocations counteract with each other causing a decrease of peak flow stress. In the process of deformation, the dislocations quickly initiate and tangle with each other. The lower the strain rate is, the longer the available time of dynamic softening is, so the peak flow stress decreases.
Fig. 2. Variation of peak flow stresses of X2A66 alloy at different temperatures and strain rates.
3.2.1. Strain rate sensitivity map and power dissipation map
According to the previous introduction, the strain rate sensitivity coefficient m is a key element to determine the power dissipation efficiency η and the parameters of various instability criteria. The value of m indicates the capability of material to resist necking and affects the overall deformation and stability during hot processing [35]. The m values were obtained by Eq. (2). To calculate the m values at any specified strain rates with constant strain and temperature, namely the slope of lnσ-ln ε˙ curve, the lnσ-ln ε˙ curves were fitted by the cubic spline function, as shown in Fig. 3. It can be clearly seen that the slopes of curves are not constant but vary with the changes of strain rate, especially when the deformation temperature is 500°C.
Fig. 3. Relationship between flow stress and strain rate with the strains of (a) 0.3, (b) 0.4, (c) 0.5, and (d) 0.65.
The three-dimensional distributions of m values and η values are shown in Fig. 4. It can be found that the values of m and η are positive and have similar overall distribution. Fig. 4(b) shows that the deformation temperature has a significant impact on η value. At a certain strain and strain rate, η value increases with the rising temperature, and the corresponding color changes obviously in the map. At a given strain and temperature, the variation of η value caused by strain rate is smaller, and the corresponding color changes little, except for the temperature at 500°C. This is in accordance with the change characteristics of the m value in Fig. 3. With the increase of strain, η value increases first (from 0.3 to 0.5) and then decreases (from 0.5 to 0.65). However, the change of η value with strain is not obvious, i.e., the strain has no significant effect on η value. The reason can be traced back to the flow stress as input data. From Fig. 1, it can be found that when the strain exceeds 0.3, most of the flow curves reached a steady state. The values of η were calculated based on the flow stresses, leading to the previously described phenomenon.
Fig. 4. 3D strain rate sensitivity map (a) and power dissipation map (b) for the studied X2A66 alloy.
It is recognized that the η value can reflect the mechanism of microstructure evolution during hot deformation. For example, a high η tends to favor the occurrence of DRX. Since a large strain is often involved in the actual hot working, the power dissipation map with the strain of 0.65 is selected for character analysis. Two characteristic regions can be found in the map. The first region with the peak η value of 0.38 is in the temperature range of 480-500°C and strain rate range of 0.001-0.1 s-1. The second region is a plateau domain with the peak η value of 0.27 in the temperature range of 420-480°C and strain rate range of 0.1-1 s-1. The specific microstructure evolution mechanism will be verified with the microstructure observation in later section.
3.2.2. Different instability maps
As described in the introduction, the Gegel and Alexander-Malas (A-M) criteria derived from the Lyapunov’s functions are all the same except for the second inequalities which are different in the variables used. Therefore, the results were compared based on the second inequalities. As shown in Fig. 5, the region composed of light cyan and red boundary and the region composed of black slash and black boundary are the unstable regions identified by the second inequalities of the Gegel and A-M criteria, respectively. In addition to the unstable region, the rest of the map is the stable region, as shown in the blank area. It is seen from the map that both groups of unstable regions are highly superposed, namely the unstable regions determined by these two criteria are basically the same.
Fig. 5. Instability maps established as per the second inequalities of Gegel’s and A-M’ s criteria at a strain of 0.65.
According to Eq. (5), it can be obtained:
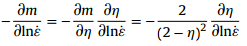
Since 22-η2 in Eq. (11) is always positive, the second inequalities of the Gegel and A-M instability criteria are arithmetically equivalent. Therefore, Eqs. (8) and (10) should predict the same unstable domains, as shown in Fig. 5.
The instability map based on the A-M criterion is shown in Fig. 6. The green slant and pale yellow shadow areas correspond to the second and fourth inequalities respectively. The first and third inequalities do not reveal any unstable regions. From the map, the unstable regions identified by the A-M criterion are large and there is an overlap. Apart from the unstable regions, the stable region is divided into two parts.
Fig. 6. Instability map constructed based on A-M criterion at a strain of 0.65.
The instability maps identified by Kumar-Prasad (K-P) and Murty-Rao (M-R) criteria deriving from Ziegler’s plastic flow theory are shown in Fig. 7. Obviously, the shape of both unstable domains is similar, but the coverage of the latter is slightly smaller than that of the former. Besides, a domain of the latter in the lower-left corner is moved to the higher strain rate relative to the former. Fig. 7(b) shows that the unstable domain based on the M-R criterion has two parts, which are in the domains of 0.007-0.275 s-1/300-312°C and 5.623-10 s-1/382-434°C respectively. The η values of these two domains are low, and the corresponding possibility of flow instability is greater.
Fig. 7. Instability maps established as per (a) K-P and (b) M-R instability criteria at a strain of 0.65.
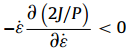
Based on Eq. (5), the K-P instability criterion, i.e. Eq. (6), can be changed to:
Depending on Eq. (4), the M-R instability criterion can be adapted as
According to Eqs. (1) and (2) and (4), Eq. (13) can be rewritten as [22]
Then:
The η values in this study are all positive, thus Eq. (15) can be shifted to
Obviously, Eq. (12) is the same as Eq. (16), which shows that the K-P criterion is arithmetically equivalent to the M-R criterion. Therefore, the unstable domains determined by these two criteria are similar, as shown in Fig. 7.
The A-M instability map was superimposed on the M-R instability map, as shown in Fig. 8. It can be seen from the graph that the range of A-M instability domain is much larger than that of the M-R instability, and they are opposite and complementary, which is agree with the study of Zhang et al [36]. The unstable domain of the superposition of two kinds of instability maps is large in the plot, and the rest of the plot is the stable domain which is divided into two parts.
Fig. 8. Comparison of instability maps plotted at a strain of 0.65 based on the A-M and M-R criteria.
According to Eqs. (4) and (5), the second inequality of A-M criterion can be transformed into
From the definitions of P and J given in Eq. (1), Eq. (17) can be changed to [36]:
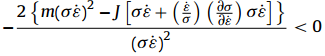
Then
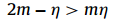
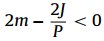
It can be found that the terms on the left side of Eq. (19) are the same as that of M-R instability criterion (Eq. (7)). In this study, the values of m and η are always positive (Fig. 4), thus mη>0. When 2m-η>mη, the A-M second criterion identifies the unstable domain, but the M-R instability criterion identifies the stable domain. When 2m-η<0, the A-M second criterion identifies the stable domain, but the M-R criterion identifies the unstable domain. Therefore, the unstable domains identified by A-M second instability and M-R instability criteria are opposite, as shown in Fig. 8.
3.3.1. Microstructure before deformation
The microstructure of Al-Cu-Li X2A66 alloy after homogenization heat treatment is shown in Fig. 9. It can be seen from Fig. 9(a) that the microstructure is uniform and mainly consists of equiaxed grains. The average grain size calculated by EBSD is 451.42 μm. The X-ray diffraction (XRD) pattern of the alloy indicates that T1 (Al2CuLi) is the main intermetallic phase, as shown in Fig. 9(b). There are no matching diffraction peaks of other common second phases such as δ' (Al3Li) and β' (Al3Zr), which is probably because of their insufficient contents in the homogenized alloy X2A66. The bright-field (BF) TEM micrograph (Fig. 9(c)) shows that there are mainly three kinds of second phases, namely lath-shaped, spherical and blocky particles. The corresponding selected area electron diffraction (SAED) pattern as shown in Fig. 9(d) confirms the presence of lath-shaped T1 and coherent δ' precipitates, which are the main strengthening phases in the third-generation Al-Cu-Li alloys [37]. Fig. 9(e) and (f) shows the presence of spherical β' and blocky T (Al20Cu2Mn3) dispersoids, which precipitate during the homogenization process and will be stable in the subsequent heat treatment [38].
Fig. 9. Microstructures of as-homogenized X2A66 alloy: (a) EBSD micrograph; (b) XRD pattern; (c) BF TEM image; (d) SAED pattern along [
3.3.2. Microstructure after deformation
The metallographic structure of X2A66 alloy deformed under different deformation conditions is shown in Fig. 10. It can be seen from the image that after hot compression, grains are compressed and elongated along the direction perpendicular to the compression axis. At the temperature of 460°C, the DRX occurs, and a small number of fine DRX grains are formed at the grain boundaries where the atomic diffusion speed is fast and the energy is high [39]. When the temperature is further increased to 500°C, the number of DRX grains generated at the original grain boundaries increases significantly. At this temperature, some DRX grains continue enlarging their size. In addition, with the increase of strain rate, the available time for DRX is shortened which leads to the decrease of the number of DRX grains. According to the observation and analysis of microstructure evolution, it can be concluded that the dynamic softening mechanisms are mainly DRV and partial DRX. Besides, the optical microstructures also provide a good validation for the processing map.
Fig. 10. Optical micrographs of alloy X2A66 deformed at the strain of 0.7 with different temperatures and strain rates.
The effects of strain on grain boundary and misorientation distribution of alloy X2A66 are shown in Fig. 11, Fig. 12 respectively. From Fig. 11, as the strain increases, the grains are squashed and the ratio of long to short axis increases. At the small strain of 0.1, the grain boundaries are mainly composed of the original high angle grain boundaries (HAGBs) which are defined by a misorientation between contiguous grains θ≥15°, as indicated by the blue lines in Fig. 11(a). When the strain is 0.4, the low angle grain boundaries (LAGBs) which are defined by θ<15° generate near the original grain boundaries, represented by the red and green lines in Fig. 11(b). When the strain increases to 0.7, the fine DRX grains can be obviously found at grain boundaries, and LAGBs are gradually formed in the grain interior. The deformation energy increases further as the strain reaches 1.2, which results in an increase of the number of DRX grains. Meanwhile, the proportion of LAGBs in the range of 2°-5° gradually decreases, and that in the range of 5°-15° gradually increases, as shown in the inserts of Fig. 11(b)-(d). As seen in Fig. 12, the average misorientation first decreases to about 14° and then reaches a plateau with increasing strain. Besides, the frequency of LAGBs first increases to about 74% and then enters in plateau. These results suggest that the formation of LAGBs and the transition from LAGBs to HAGBs reach a dynamic balance, and the main dynamic softening behavior is DRV and incomplete DRX.
Fig. 11. Grain boundary maps of X2A66 alloy compressed at 500°C and 0.01 s-1 with different strains: (a) 0.1; (b) 0.4; (c) 0.7; (d) 1.2.
Fig. 12. Misorientation distribution plots of X2A66 alloy compressed at 500°C and 0.01 s-1 with different strains: (a) 0.1; (b) 0.4; (c) 0.7; (d) 1.2.
The TEM images of alloy X2A66 at the strain rate of 0.01 s-1 and the strain of 0.7 with different temperatures are shown in Fig. 13. At the temperature of 300°C (Fig. 13(a) and (b)), the density of dislocations in the deformed grains is high. The tangled dislocation gradually evolves into the neat dislocation wall through climbing and sliding which makes the dislocation change from the horizontal distribution with high energy into the vertical distribution with low energy. The deformed grain is divided into several small areas with different orientations by the dislocation walls, showing a typical DRV feature. Besides, the phenomenon of pinning the dislocation by the second phase particles can be observed. As the temperature reaches 420°C (Fig. 13(c) and (d)), dislocations unpin from the second phase particles and move toward the grain boundary and dislocation wall, leading to the decrease of intragranular dislocation density and the formation of substructure. Grain boundaries and sub-boundaries are also found to be pinned by second phase particles. When the temperature reaches 500°C (Fig. 13(e) and (f)), there are few residual dislocations in the grain. The second phase particles are obvious, and the grain boundary is straight and clear. The appearance of the steady triple junctions and the HAGB shows the typical characters of DRX.
Fig. 13. TEM micrographs of X2A66 alloy deformed at the strain rate of 0.01 s-1 with different temperatures: (a, b) 300°C; (c, d) 420°C; (e, f) 500°C.
The second phase of the sample compressed at 500°C and 0.01 s-1 is shown in Fig. 14. It can be found that some fine lath-shaped second phases precipitate on the dislocations, grain boundaries and other dispersed particles, which correspond to the yellow, pink and blue arrows in Fig. 14(a) and (b), respectively. The matching insets of SAED patterns obtained along [112] zone axis prove that they are T1 phases. In order to distinguish the two kinds of T1 phases in this study, the coarse T1 particles in the homogenized sample and the fine T1 particles in the sample deformed at 500°C are named primary T1 and secondary T1 phases, respectively. The HAADF-STEM images are used to better display the distribution of T1 particles. Fig. 14(c) shows that there are many cross-distributed primary T1 particles in the homogenized sample. Combined with Fig. 9(c), it can also be found that the length of primary T1 particles is longer than that of T particles, and the size of primary T1 and T particles is bigger than that of β'. A comparison of the primary and secondary T1 particles in the sample deformed at 500°C is shown in Fig. 14(d). It can be seen that most of the primary coarse T1 particles were broken and dissolved back into α-Al, and the thickness and length of the secondary T1 particles are much smaller than that of the residual primary T1 particles.
Fig. 14. Microstructures of X2A66 alloy deformed at 500°C and 0.01 s-1: (a) T1 phase on dislocations; (b) T1 phase on grain boundary and dispersed particles; (c, d) HAADF-STEM images showing the T1 particles before and after compression, respectively.
Although some researches have compared the different instability criteria from the point of experiment, few have compared them from the point of theory, especially combining the expression of formula. By comparison, it is found that the above four instability criteria are intersected or complementary.
Both Gegel and A-M criteria are based on Lyapunov's functions, and the A-M criterion is obtained by replacing η in the second inequality of Gegel criterion with m. Moreover, the formula transformation result of these two criteria as presented in Eq. (11) shows that the Gegel and A-M criteria are mathematically equivalent. Therefore, based on the same test data, the unstable domains identified by both criteria are basically the same (Fig. 5). The slight difference in the unstable domains of these two criteria which can be neglected in this study is caused by the error during interpolation and calculation [17]. Fig. 5 also shows that the instability regions predicted by these two criteria are large, which is consistent with the result of the study of 6061/20% Al2O3 composites conducted by Spigarelli et al. [40]. The K-P and M-R criteria are both on the basis of the relationship dD/d ε˙ <D/ ε˙ based on the extremum theories of irreversible thermodynamics applicable to the large plastic deformation [41]. Eqs. (12) and (16) indicate that the K-P and M-R criteria are mathematically equivalent. Moreover, the dissipation function D(ε˙) is replaced by J in the derivation of these two criteria. Thus the unstable domains identified by them are similar (Fig. 7). However, Fig. 7 also shows some differences between the instability regions predicted by the two criteria, i.e., the upper instability region in Fig. 7(b) is smaller than that in Fig. 7(a), and the leftmost instability region in Fig. 7(b) moves to a higher strain rate than that in Fig. 7(a). This is mainly because the ηK-P value in K-P criterion is calculated by Eq. (5), which assumes that σ=Kε˙m and m is a constant and independent of ε˙, but the ηM-R value in M-R criterion is calculated by Eq. (4) which is applicable to conditions whether m is constant or not. The η values calculated by these two different methods can lead to different ξ values, as shown in Fig. 7. Eqs. (19) and (7) reveals that the unstable domains depicted by A-M’ s second inequality and M-R criteria are opposite. Besides, the relationship dD/d ε˙ >D/ ε˙, which is contrary to that in the M-R criterion, is used in the derivation of A-M criterion, and the second law of thermodynamics is also considered. All these lead to the opposite and complementary instability regions predicted by the A-M and M-R criteria, as shown in Fig. 8. It is also evident that the instability regions predicted by M-R criterion are much larger than that predicted by A-M criterion, which is in agreement with the findings of Shao et al [42].
Microstructure observation indicates that flow instability manifestations are not found in this research. For example, grains undergo DRX and no instabilities occur or are observed at the condition of 500°C/1 s-1 (Fig. 10). This condition is in the stable domain predicted by the K-P and M-R criteria (Fig. 7(a) and (b)), but in an unstable domain predicted by the Gegel and A-M criteria (Fig. 5). Overall, the M-R criterion is more accurate than the K-P criterion, and these two criteria are better than the Gegel and A-M criteria in this study. Due to rigorous theoretical deduction and calculation, M-R criterion possesses wider applicability and higher accuracy, but its η value is difficult to calculate. To solve this problem, MATLAB software with programming function is used in this study, and the result is shown in Fig. 4(b). It is worth noting that the conclusions of some literatures are different from that of this study. In the study of Ti662 titanium alloy, Poletti et al. [43] found that the unstable domains identified by K-P and M-R criteria were very different, even contrary. Cavaliere et al. [44] concluded that Gegel criterion is superior to K-P criterion for Al-based metal matrix composites. These facts illustrate none of the instability criteria is applicable for any kinds of materials at present. Therefore, it is worthwhile to evaluate the M-R criterion as the most suitable instability criterion for alloy X2A66.
During hot deformation, work hardening and dynamic softening exist simultaneously. Work hardening is caused by the dislocations multiplication and tangle, and dynamic softening results from the dislocations annihilation and rearrangement [45]. Dynamic softening is closely related to the thermo-mechanical processing conditions, i.e. T, ε˙ and ε. At the condition of lower temperature (300°C) and strain rate (0.01 s-1), the effect of thermal activation is not significant. The tangled dislocations transform to dislocation walls, and no DRX grains are found due to insufficient residual stored energy (Fig. 13(a) and (b)). It manifests that DRV is the main softening mechanism. At the higher temperature of 500°C, atoms and dislocations become more active. DRV resulted from the sliding and climbing of dislocations is limited, and sufficient residual stored energy enables DRX to occur (Fig. 13(e) and (f)). Meanwhile, as the strain rate increases to 10 s-1, the time of dynamic softening shortens, resulting in the reduction of the number of DRX grains (Fig. 10). Moreover, strain also has an important influence on dynamic softening behavior. When the temperature is 500°C and the strain rate is 0.01 s-1 (Fig. 11), the dislocation density and deformation stored energy increase with the increase of strain. As the strain increases to a critical value, DRX starts to occur.
Additionally, the stacking fault energy (SFE) of materials plays a vital role in dynamic softening. The SFE is proportional to 1/d, where d is the stacking fault width [46]. Materials with low SFE, such as 304 stainless steel (21 mJ m-2) [47], have a wider width of stacking fault. Dislocations are not easy to counteract with each other by climbing and cross-slipping, that is, DRV is hindered. Thus, high dislocation density and sufficient stored energy make DRX occur. Materials with high SFE, such as Al (166 mJ m-2) [47] and its alloys, have a narrower width of stacking fault. This impedes the separation of the perfect dislocation into two partial dislocations which facilitates the slip, cross-slip and climb of the perfect dislocation. DRV reduces the dislocation density and consumes most of the stored energy, which makes DRX quite difficult to occur. However, even though Al-Cu-Li X2A66 alloy is a high SFE material and DRV is the main softening mechanism during hot deformation, DRX can still occur under suitable conditions, as shown in Fig. 10, Fig. 13.
Furthermore, it is generally known that second phase particles have a significant effect on the mechanisms of dynamic softening. For the Al-Cu-Li X2A66 alloy, the Zr and Mn elements with opposite segregation modes can form coherent β' and semi-coherent T dispersed particles during the homogenization process respectively [38]. T and β' dispersoids have a strong hindrance to the motion of dislocation and grain boundary, thus inhibiting recrystallization and grain growth. Tsivoulas et al. [38] found that the effect of β' particles on restraining recrystallization was stronger than that of T particles. On the one hand, T particles are much coarser than β' particles, so the Zener pinning pressure provided by T particles is less than that of β' particles, because the Zener pinning pressure is proportional to 1/r, where r is the size of particle [46]. On the other hand, the coherency of T particles is poorer than that of β' particles, and the interaction between coherence particles and dislocations is stronger [48], thus the inhibiting effect of T particles on recrystallization is weaker. Due to the high temperature stability of β' and T particles, they can strongly inhibit DRX during high temperature deformation, even at 500°C (Fig. 13, Fig. 14). Moreover, it is worth noting that the primary coarse T1 particles dissolve back into α-Al and the secondary fine T1 particles precipitate after compression at 500°C (Fig. 13, Fig. 14). From the isothermal phase diagram of Al-Cu-Li system at 500°C [49], it can be inferred that there is no T1 phase in the tested alloy at 500°C. Therefore, most of the primary coarse T1 particles were broken and dissolved back into α-Al during deformation at 500°C. The dissolution of primary T1 particles makes the solid solution supersaturates and provides more Cu and Li atoms for the precipitation of secondary T1 particles during subsequent cooling. Meanwhile, the T and β' dispersoids can provide heterogeneous nucleation sites for the precipitation of secondary T1 particles. The HAGBs and the dislocations introduced by deformation are also beneficial to the nucleation of secondary T1 particles (Fig. 13, Fig. 14). The decrease of primary T1 particles and the absence of secondary T1 particles during deformation at 500°C reduce the Zener pinning pressure provided by the second phase particles, which is conducive to the occurrence of DRX.
The hot deformation characteristics of Al-Cu-Li X2A66 alloy are investigated by conducting the thermal simulation experiments at the strain rate range of 0.001-10 s-1 and temperature range of 300-500°C. The main conclusions are summarized as follows:
(1) The 3D strain rate sensitivity and power dissipation maps indicate that the deformation temperature and strain rate have great influence on the values of that two coefficients, and the strain has little influence on them. The distribution patterns of these two maps are similar, and two high-η domains, namely 480-500°C/0.001-0.1 s-1 and 420-480°C/0.1-1 s-1, are identified.
(2) Four typical instability criteria were compared from the theoretical and experimental point of view. The prediction results of the M-R and K-P criteria based on Ziegler's plastic flow theory are similar, and the predictions of the Gegel and A-M criteria based on Lyapunov's functions are quite similar, while the predictions of the criteria based on the previous two different principles are contrary and complementary. Combined with the microstructure observation, M-R criterion is more precise than K-P criterion, and the former two are better than Gegel and A-M criteria.
(3) DRV is the main dynamic softening mechanism of the testing alloy deformed at low temperature and high strain rate. At the condition of 460°C and 0.01 s-1, a small number of DRX grains are formed. As the temperature is increased up to 500°C, the characteristic of partial DRX is obvious. With the increase of strain, deformation stored energy increases, then DRX takes place, finally the average misorientation and the proportion of LAGBs achieve a plateau.
(4) After deformation at 500°C, most of the primary coarse T1 particles were broken and dissolved back into the aluminum matrix. Meanwhile, the β' and T dispersed particles provide heterogeneous nucleation sites for the generation of secondary fine T1 particles, and the dislocations and grain boundaries are also favorable for the precipitation of the secondary T1 particles.
This work was supported financially by the National Natural Science Foundation of China (Nos. 51374187, 51474195 and 51474101).
The authors have declared that no competing interests exist.

 WeChat
/
| 〈 |
|
〉 |


